| Param | Original file | Final file |
|---|---|---|
| Filename | modeM0/AS1A10_053T17_9000004366_30366cztM0_level2.evt | modeM0/AS1A10_053T17_9000004366_30366cztM0_level2_quad_clean.evt |
| Size (bytes) | 931,302,720 | 120,458,880 |
| Size | 888.2 MB | 114.9 MB |
| Events in quadrant A | 6,361,365 | 742,664 |
| Events in quadrant B | 8,009,241 | 755,888 |
| Events in quadrant C | 7,661,114 | 705,249 |
| Events in quadrant D | 5,468,298 | 720,662 |
| Mode M0 | |||
|---|---|---|---|
| Quadrant | BADHDUFLAG | Total packets | Discarded packets |
| A | 0 | 25491 | 2 |
| B | 0 | 31526 | 2 |
| C | 0 | 29643 | 2 |
| D | 0 | 22758 | 2 |
| Mode M9 | |||
|---|---|---|---|
| Quadrant | BADHDUFLAG | Total packets | Discarded packets |
| A | 0 | 22 | 0 |
| B | 0 | 22 | 0 |
| C | 0 | 22 | 0 |
| D | 0 | 22 | 0 |
| Mode SS | |||
|---|---|---|---|
| Quadrant | BADHDUFLAG | Total packets | Discarded packets |
| A | 0 | 214 | 0 |
| B | 0 | 214 | 0 |
| C | 0 | 214 | 0 |
| D | 0 | 214 | 0 |
| Quadrant | Total seconds | Saturated seconds | Saturation percentage |
|---|---|---|---|
| A | 10438 | 387 | 3.707607% |
| B | 10439 | 148 | 1.417760% |
| C | 10439 | 727 | 6.964269% |
| D | 10439 | 97 | 0.929208% |
Noise dominated data is calculated using 1-second bins in cleaned event files. If a bin has >2000 counts, and if more than 50% of those come from <1% of pixels, then it is considered to be noise-dominated and hence unusable.
| Quadrant | # 1 sec bins | Bins with >0 counts | Bins with >2000 counts | High rate bins dominated by noise | Noise dominated (total time) | Noise dominated (detector-on time) | Marked lightcurve |
|---|---|---|---|---|---|---|---|
| A | 12618 | 10438 | 258 | 258 | 2.04% | 2.47% | 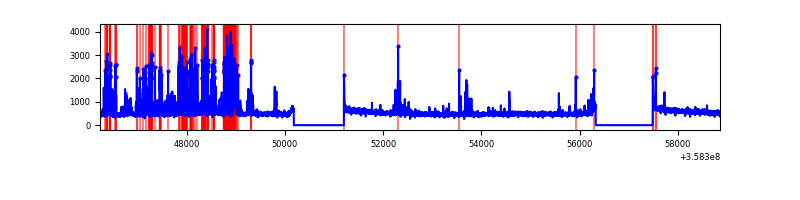 |
| B | 12619 | 10439 | 0 | 0 | 0.00% | 0.00% | 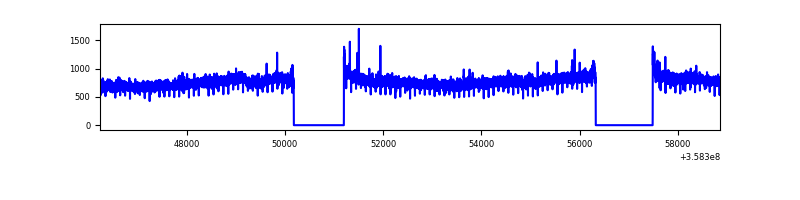 |
| C | 12619 | 10439 | 259 | 259 | 2.05% | 2.48% | 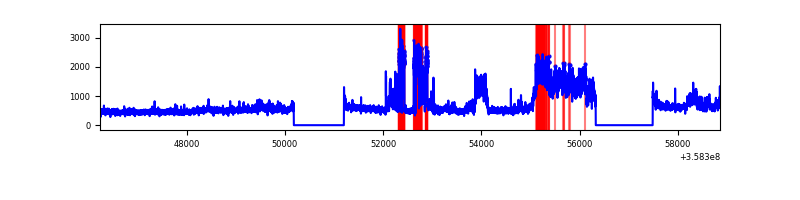 |
| D | 12619 | 10439 | 27 | 27 | 0.21% | 0.26% | 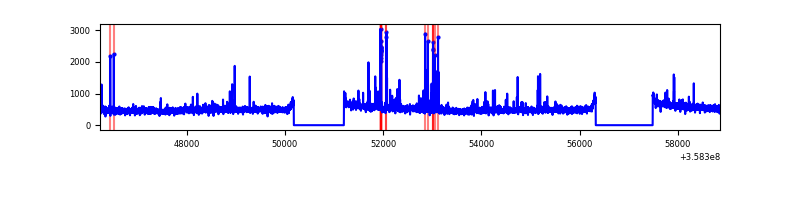 |
Top three noisy pixels from each quadrant. If the there are fewer than three noisy pixels in the level2.evt file, extra rows are filled as -1
| Pixel properties | Quadrant properties | ||||||
|---|---|---|---|---|---|---|---|
| Quadrant | DetID | PixID | Counts | Sigma | Mean | Median | Sigma |
| A | 0 | 13 | 910161 | 3432.55 | 1327 | 1302 | 264.8 |
| A | 12 | 96 | 303058 | 1139.66 | 1327 | 1302 | 264.8 |
| A | 8 | 192 | 25475 | 91.29 | 1327 | 1302 | 264.8 |
| B | 6 | 159 | 2818158 | 11419.71 | 1318 | 1286 | 246.7 |
| B | 12 | 111 | 30909 | 120.09 | 1318 | 1286 | 246.7 |
| B | 11 | 111 | 28079 | 108.62 | 1318 | 1286 | 246.7 |
| C | 3 | 233 | 2554515 | 8847.55 | 1249 | 1260 | 288.6 |
| C | 14 | 238 | 208762 | 719.04 | 1249 | 1260 | 288.6 |
| C | 2 | 114 | 24039 | 78.93 | 1249 | 1260 | 288.6 |
| D | 8 | 195 | 289707 | 897.28 | 1288 | 1258 | 321.5 |
| D | 2 | 250 | 128252 | 395.04 | 1288 | 1258 | 321.5 |
| D | 2 | 234 | 50179 | 152.18 | 1288 | 1258 | 321.5 |
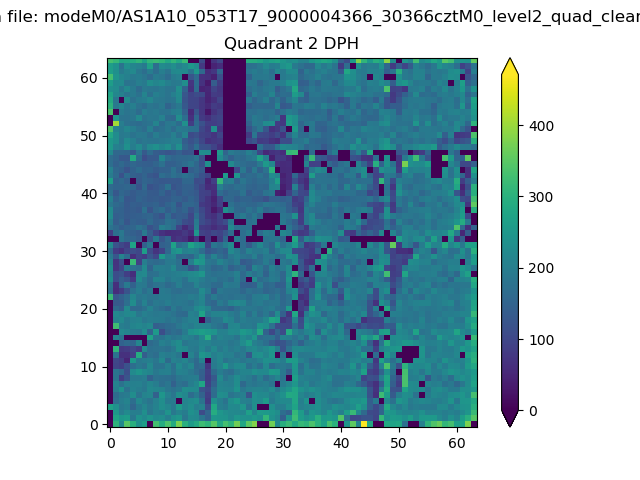
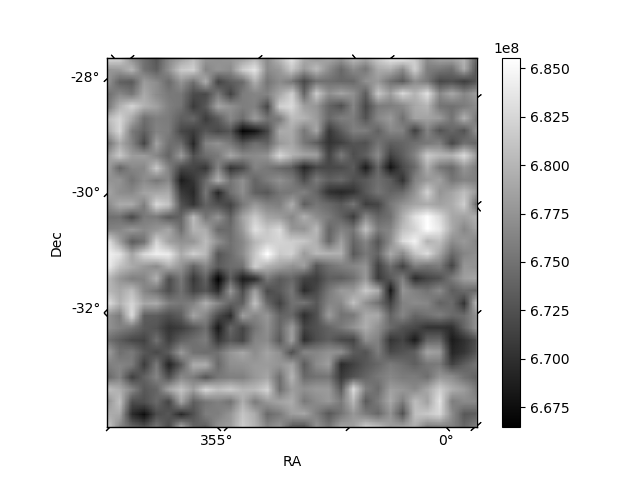
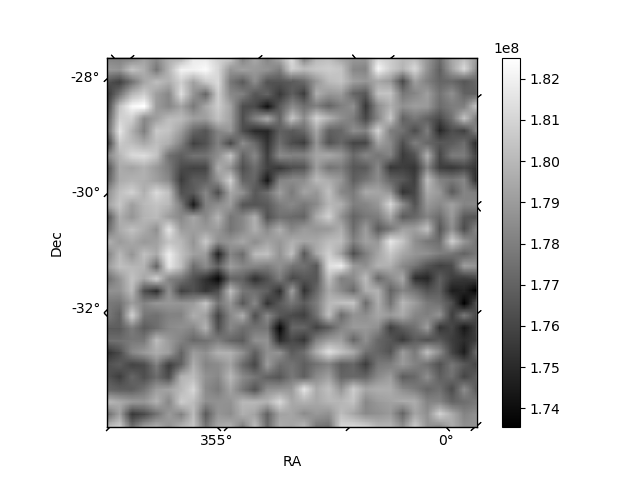
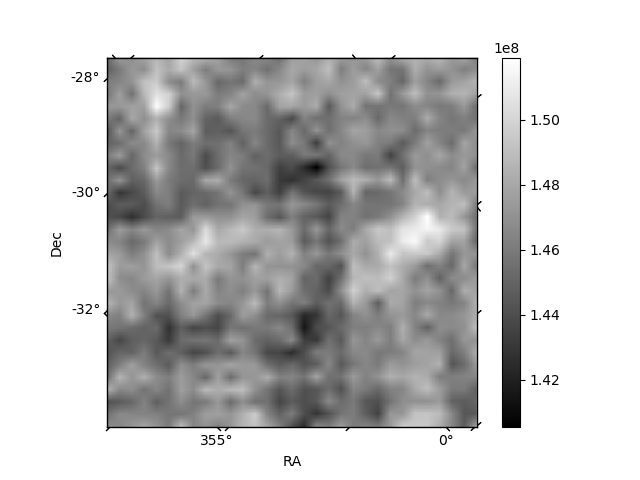
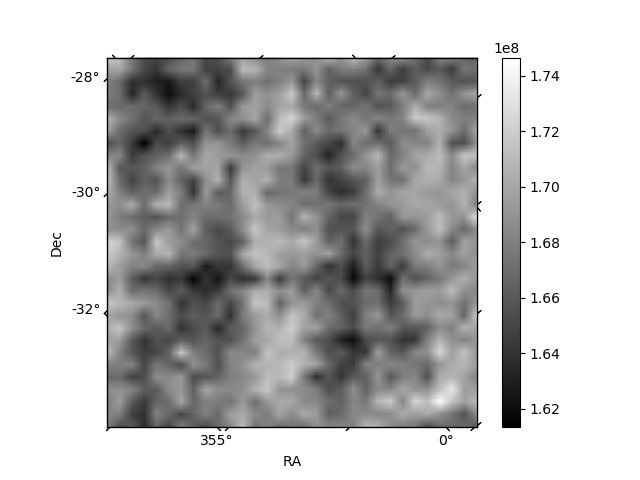
Histogram calculated using DETX and DETY for each event in the final _common_clean file
| Quadrant A | 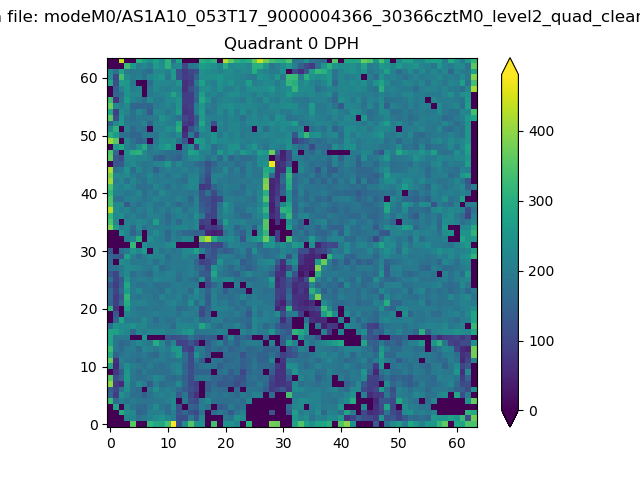 |
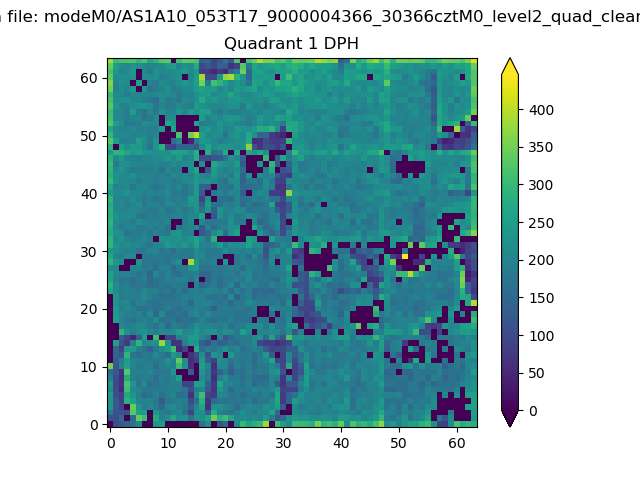 |
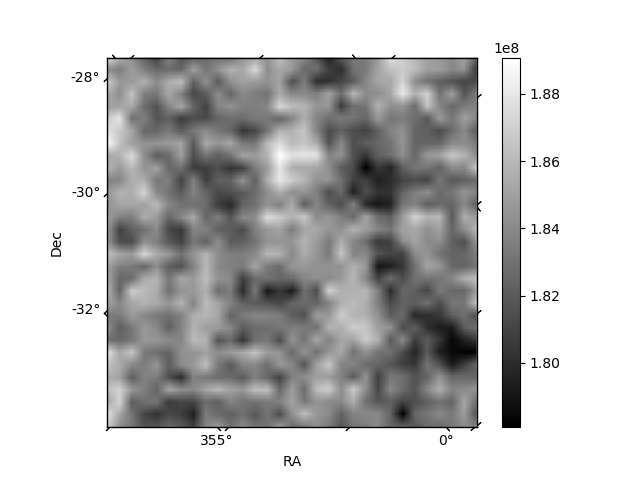
Quadrant B |
|---|---|---|---|
| Quadrant D | 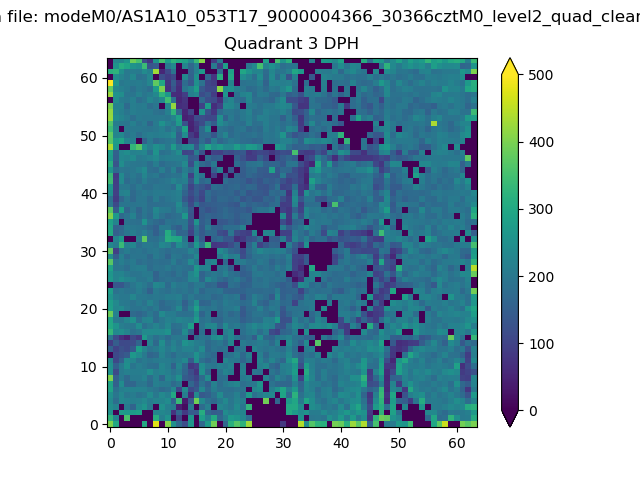 |
 |
Quadrant C |
| Plot type | Count rate plots | Images |
|---|---|---|
| Comparison with Poisson distribution Blue bars denote a histogram of data divided into 1 sec bins. Red curve is a Poisson curve with rate = median count rate of data. |
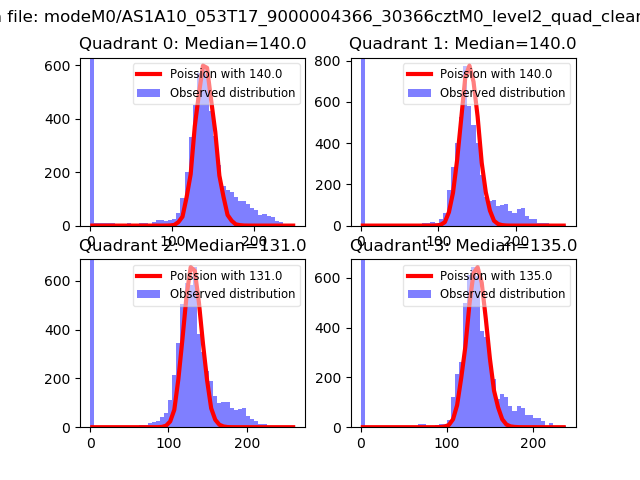 |
 |
| Quadrant-wise count rates Data is divided into 100 sec bins |
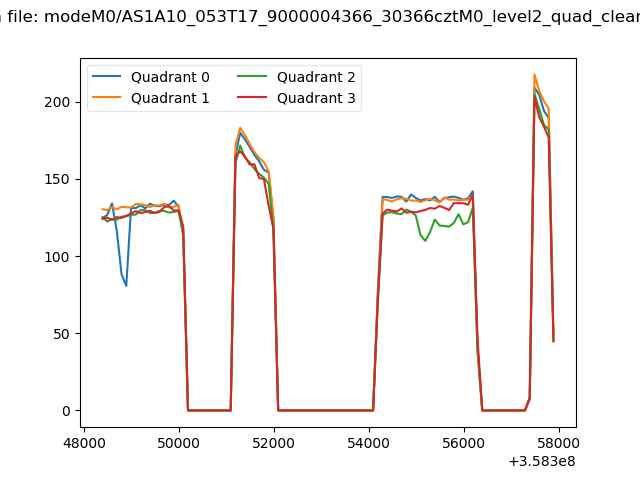 |
|
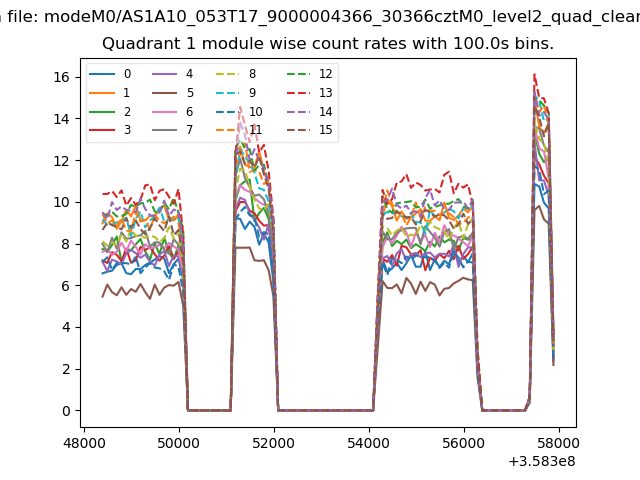
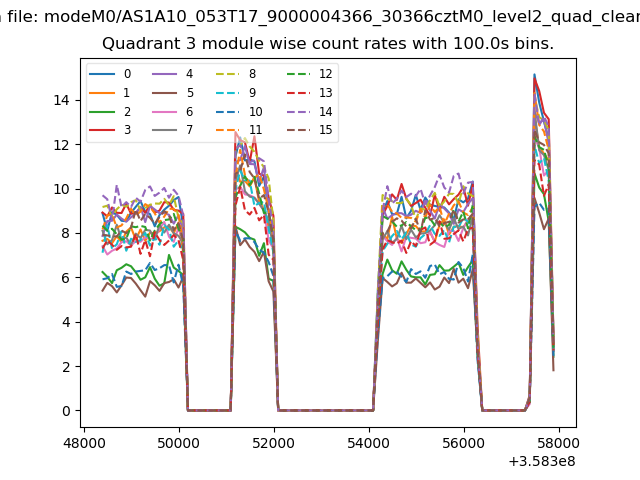
| Module-wise count rates for Quadrant A Data is divided into 100 sec bins |
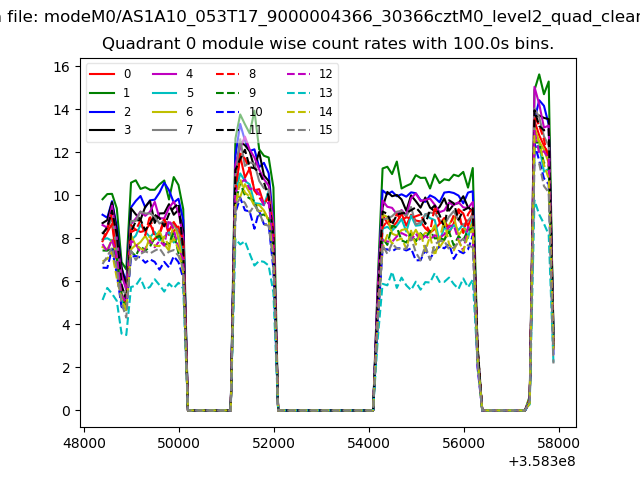 |
 |
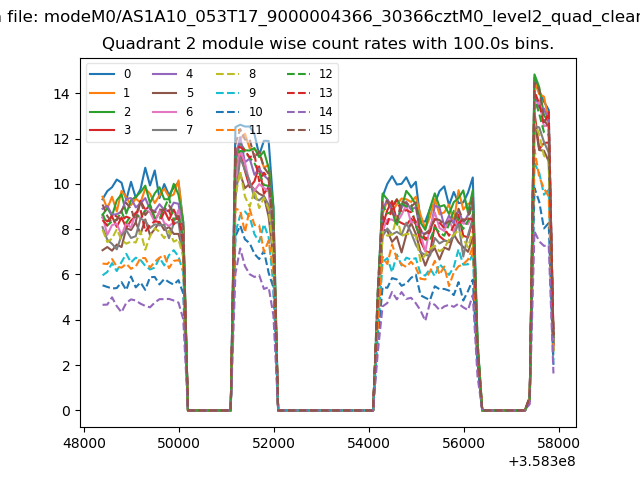
| Module-wise count rates for Quadrant B Data is divided into 100 sec bins |
 |
 |
| Module-wise count rates for Quadrant C Data is divided into 100 sec bins |
 |
 |
| Module-wise count rates for Quadrant D Data is divided into 100 sec bins |
 |
 |
| Parameter | Plot |
|---|---|
| CZT HV Monitor | 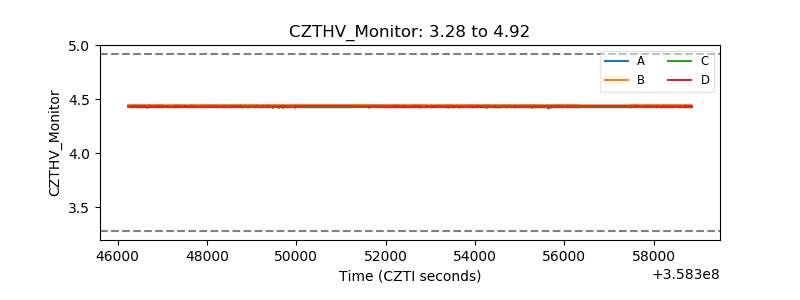 |
| D_VDD | 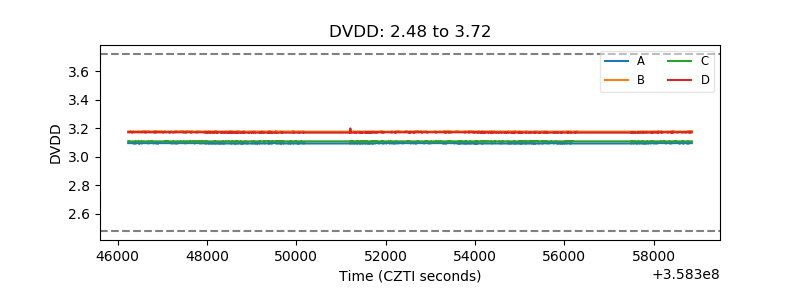 |
| Temperature 1 | 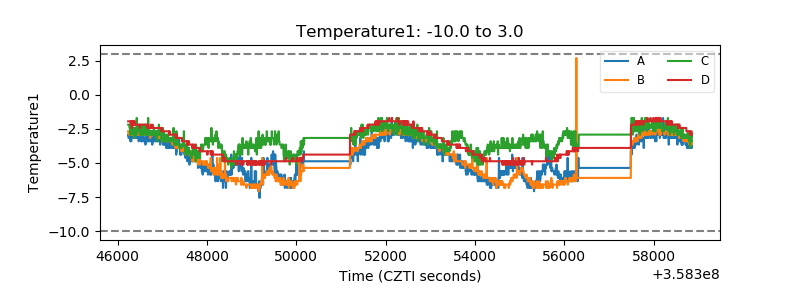 |
| Veto HV Monitor | 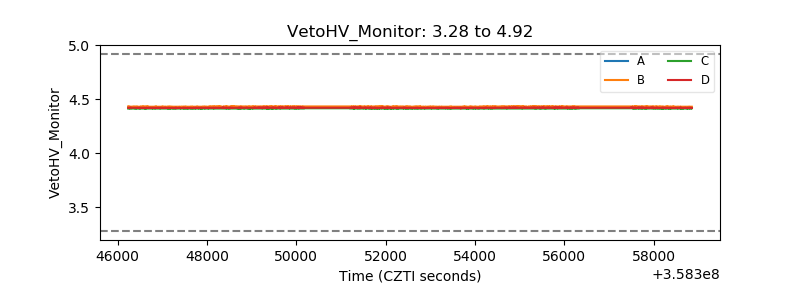 |
| Veto LLD | 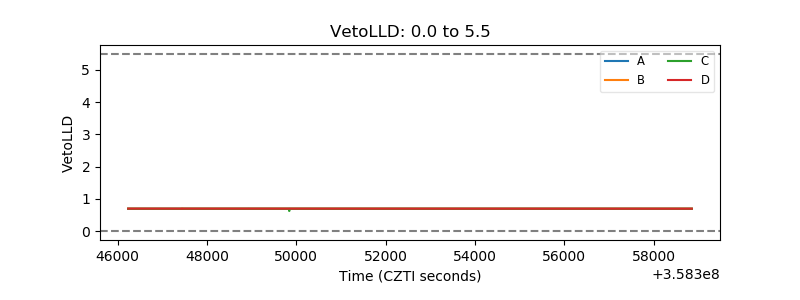 |
| Alpha Counter | 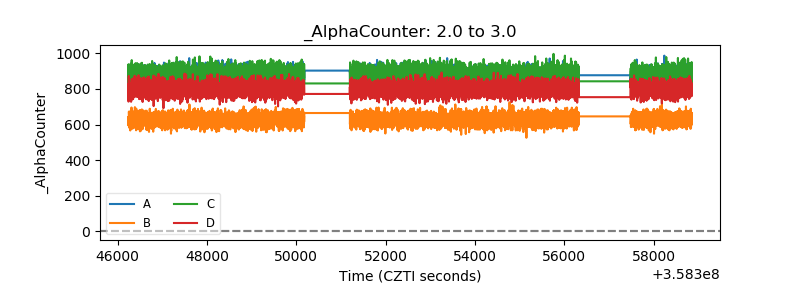 |
| _CPM_Rate | 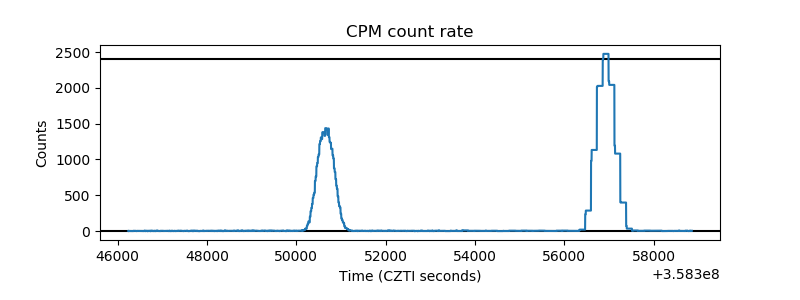 |
| CZT Counter | 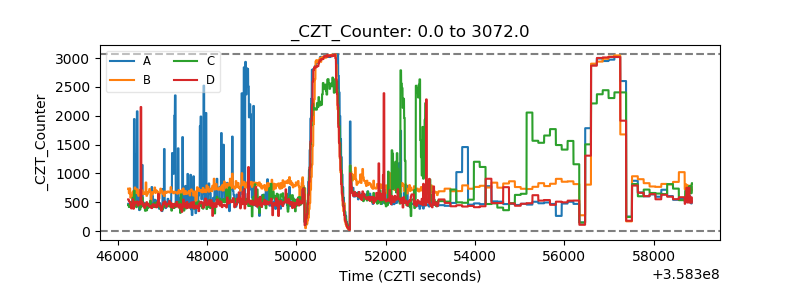 |
| +2.5 Volts monitor | 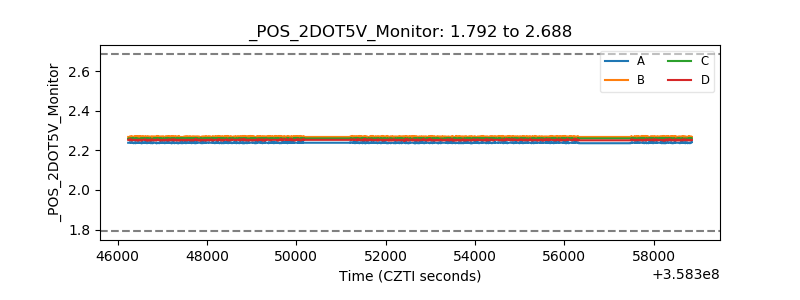 |
| +5 Volts monitor |  |
| _ROLL_ROT |  |
| _Roll_DEC |  |
| _Roll_RA | 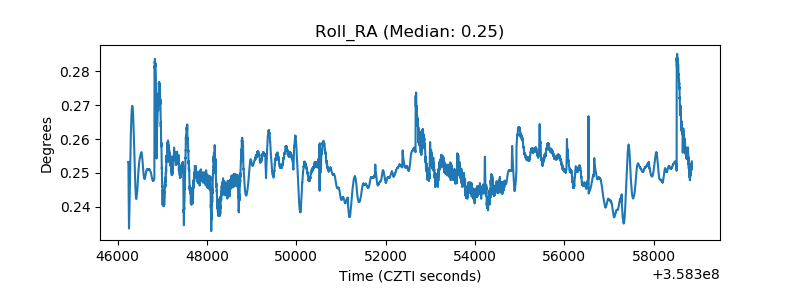 |
| Veto Counter | 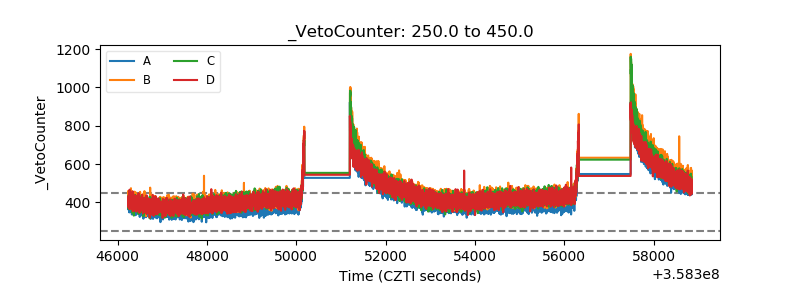 |