| Param | Original file | Final file |
|---|---|---|
| Filename | modeM0/AS1A10_053T17_9000004366_30369cztM0_level2.evt | modeM0/AS1A10_053T17_9000004366_30369cztM0_level2_quad_clean.evt |
| Size (bytes) | 579,628,800 | 75,415,680 |
| Size | 552.8 MB | 71.9 MB |
| Events in quadrant A | 3,613,784 | 475,499 |
| Events in quadrant B | 5,204,877 | 479,636 |
| Events in quadrant C | 4,788,879 | 445,564 |
| Events in quadrant D | 3,530,036 | 452,614 |
| Mode M0 | |||
|---|---|---|---|
| Quadrant | BADHDUFLAG | Total packets | Discarded packets |
| A | 0 | 14493 | 2 |
| B | 0 | 19134 | 3 |
| C | 0 | 18648 | 2 |
| D | 0 | 14365 | 2 |
| Mode M9 | |||
|---|---|---|---|
| Quadrant | BADHDUFLAG | Total packets | Discarded packets |
| A | 0 | 17 | 0 |
| B | 0 | 18 | 0 |
| C | 0 | 18 | 0 |
| D | 0 | 18 | 0 |
| Mode SS | |||
|---|---|---|---|
| Quadrant | BADHDUFLAG | Total packets | Discarded packets |
| A | 0 | 126 | 0 |
| B | 0 | 126 | 0 |
| C | 0 | 126 | 0 |
| D | 0 | 126 | 0 |
| Quadrant | Total seconds | Saturated seconds | Saturation percentage |
|---|---|---|---|
| A | 6160 | 147 | 2.386364% |
| B | 6159 | 143 | 2.321805% |
| C | 6159 | 290 | 4.708557% |
| D | 6159 | 57 | 0.925475% |
Noise dominated data is calculated using 1-second bins in cleaned event files. If a bin has >2000 counts, and if more than 50% of those come from <1% of pixels, then it is considered to be noise-dominated and hence unusable.
| Quadrant | # 1 sec bins | Bins with >0 counts | Bins with >2000 counts | High rate bins dominated by noise | Noise dominated (total time) | Noise dominated (detector-on time) | Marked lightcurve |
|---|---|---|---|---|---|---|---|
| A | 7500 | 6160 | 48 | 48 | 0.64% | 0.78% | 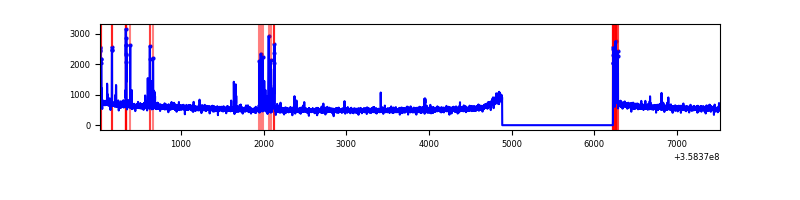 |
| B | 7499 | 6159 | 0 | 0 | 0.00% | 0.00% | 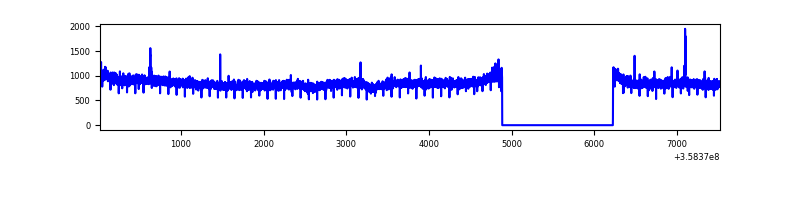 |
| C | 7499 | 6160 | 39 | 39 | 0.52% | 0.63% | 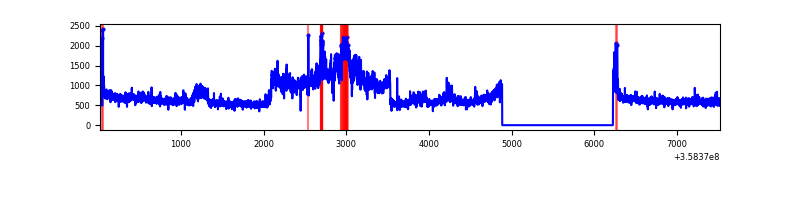 |
| D | 7499 | 6160 | 22 | 22 | 0.29% | 0.36% | 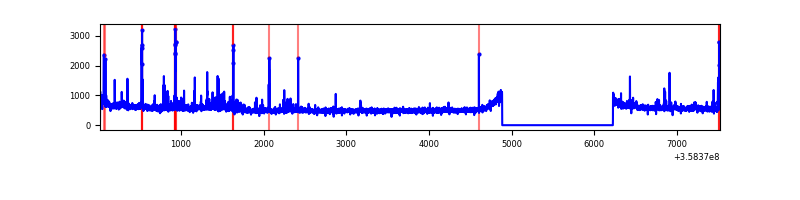 |
Top three noisy pixels from each quadrant. If the there are fewer than three noisy pixels in the level2.evt file, extra rows are filled as -1
| Pixel properties | Quadrant properties | ||||||
|---|---|---|---|---|---|---|---|
| Quadrant | DetID | PixID | Counts | Sigma | Mean | Median | Sigma |
| A | 0 | 13 | 195742 | 1140.04 | 877 | 865 | 170.9 |
| A | 8 | 192 | 20668 | 115.85 | 877 | 865 | 170.9 |
| A | 13 | 254 | 11949 | 64.84 | 877 | 865 | 170.9 |
| B | 6 | 159 | 1754882 | 10893.62 | 875 | 860 | 161.0 |
| B | 12 | 111 | 18695 | 110.77 | 875 | 860 | 161.0 |
| B | 11 | 111 | 17453 | 103.05 | 875 | 860 | 161.0 |
| C | 3 | 233 | 1350699 | 7073.76 | 834 | 843 | 190.8 |
| C | 14 | 238 | 139324 | 725.69 | 834 | 843 | 190.8 |
| C | 0 | 10 | 33273 | 169.95 | 834 | 843 | 190.8 |
| D | 8 | 195 | 133742 | 642.85 | 842 | 826 | 206.8 |
| D | 2 | 250 | 65439 | 312.5 | 842 | 826 | 206.8 |
| D | 1 | 52 | 57713 | 275.13 | 842 | 826 | 206.8 |
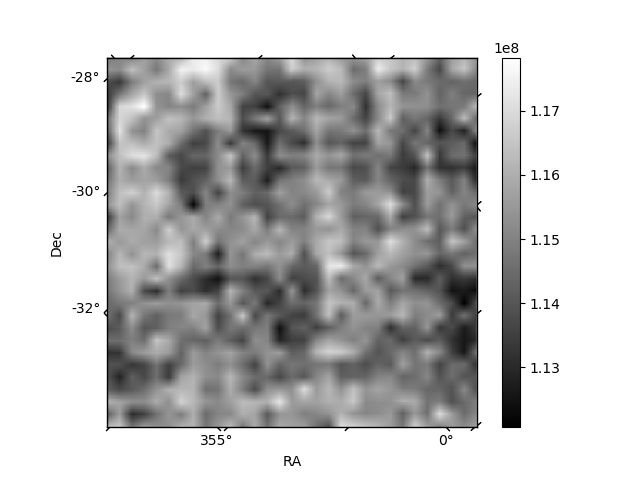
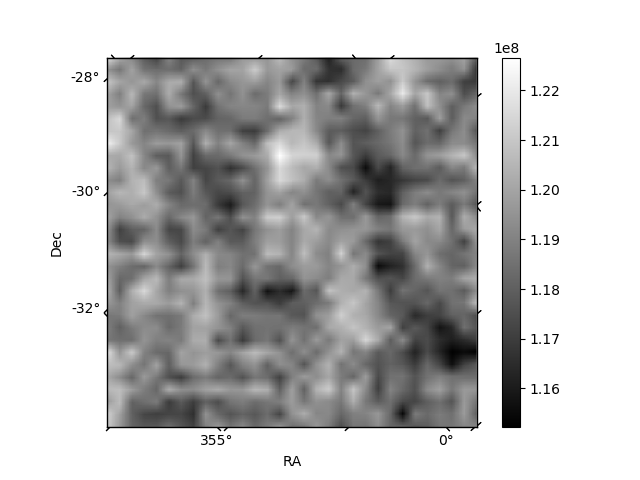
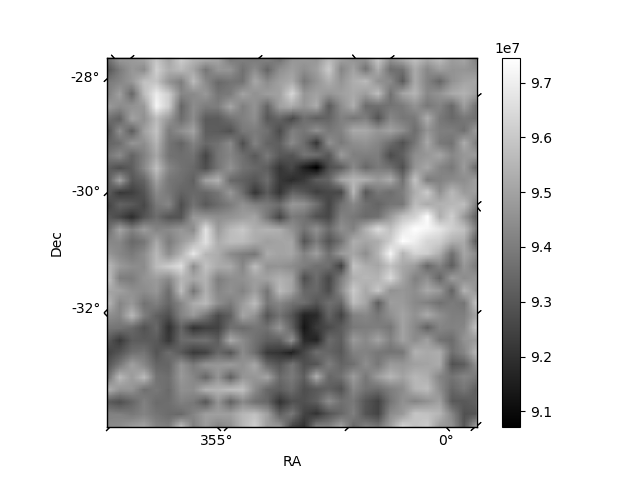
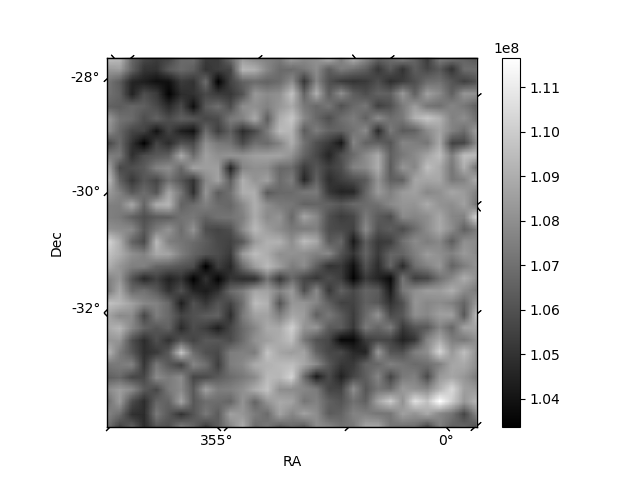
Histogram calculated using DETX and DETY for each event in the final _common_clean file
| Quadrant A | 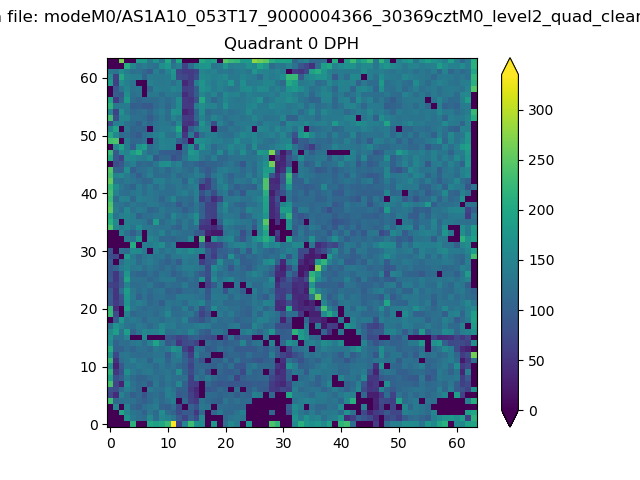 |
 |
Quadrant B |
|---|---|---|---|
| Quadrant D |  |
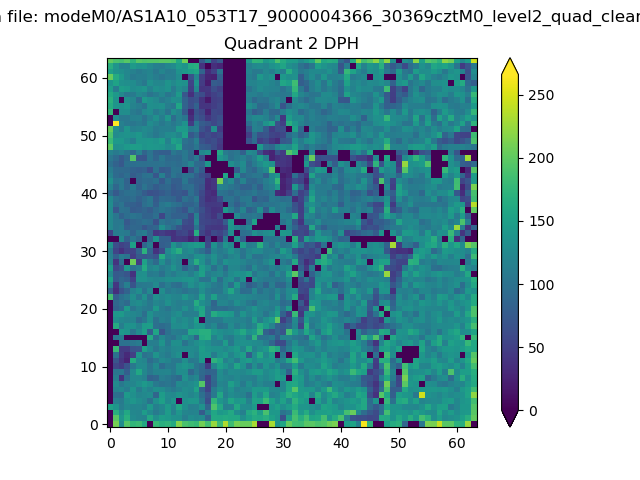 |
Quadrant C |
| Plot type | Count rate plots | Images |
|---|---|---|
| Comparison with Poisson distribution Blue bars denote a histogram of data divided into 1 sec bins. Red curve is a Poisson curve with rate = median count rate of data. |
 |
 |
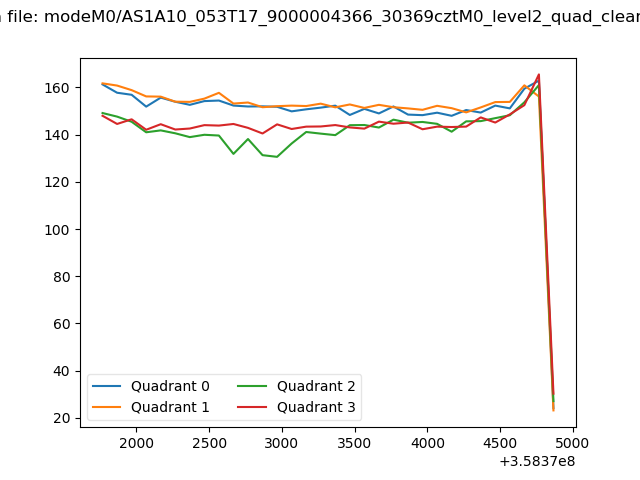
| Quadrant-wise count rates Data is divided into 100 sec bins |
 |
|
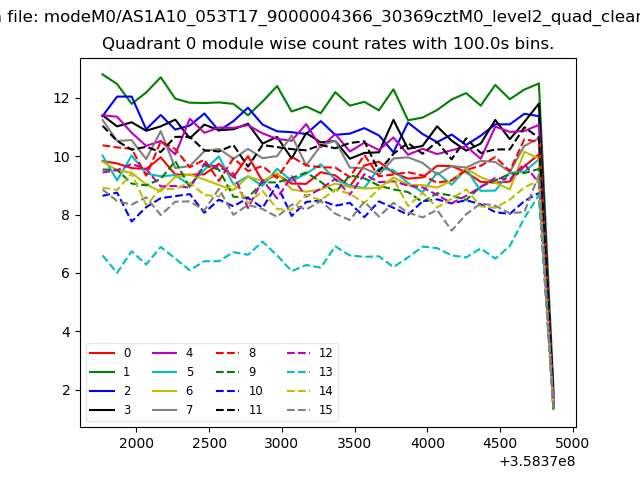
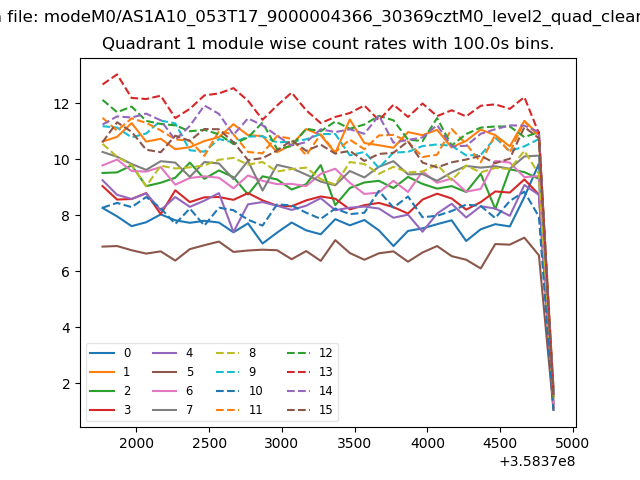
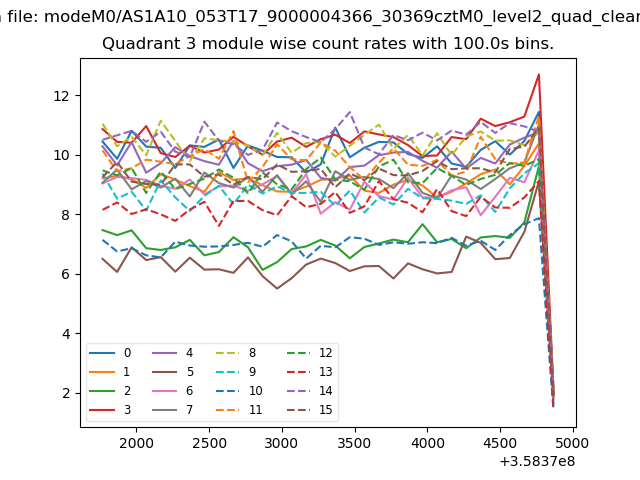
| Module-wise count rates for Quadrant A Data is divided into 100 sec bins |
 |
 |
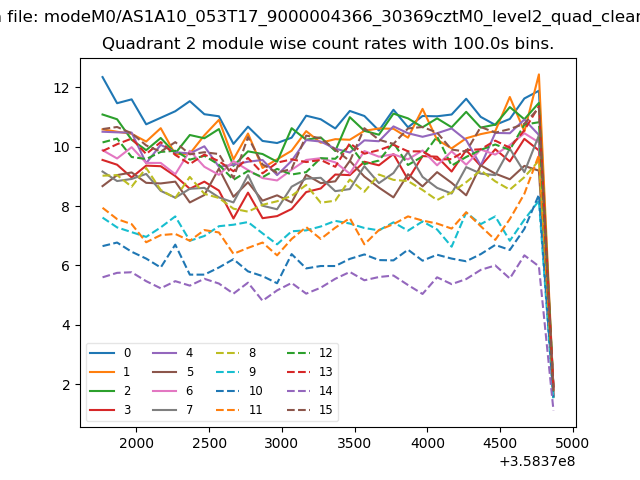
| Module-wise count rates for Quadrant B Data is divided into 100 sec bins |
 |
 |
| Module-wise count rates for Quadrant C Data is divided into 100 sec bins |
 |
 |
| Module-wise count rates for Quadrant D Data is divided into 100 sec bins |
 |
 |
| Parameter | Plot |
|---|---|
| CZT HV Monitor | 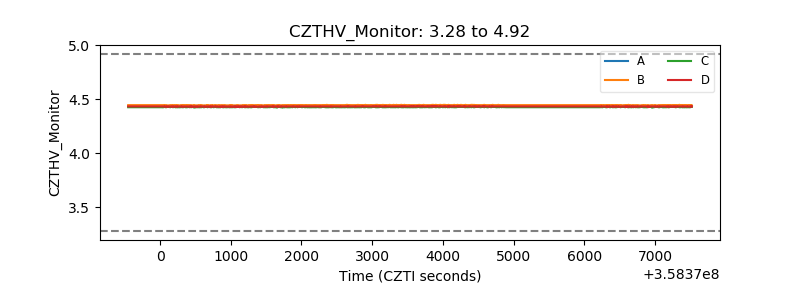 |
| D_VDD |  |
| Temperature 1 | 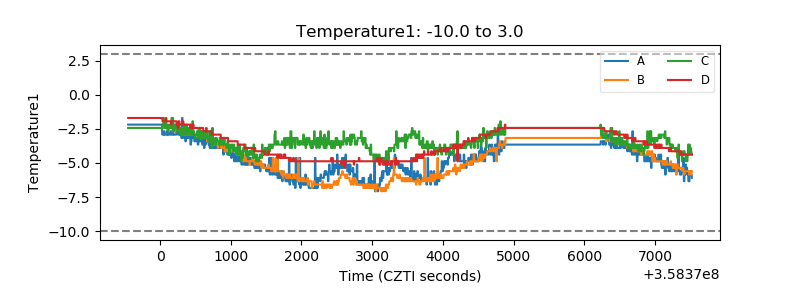 |
| Veto HV Monitor | 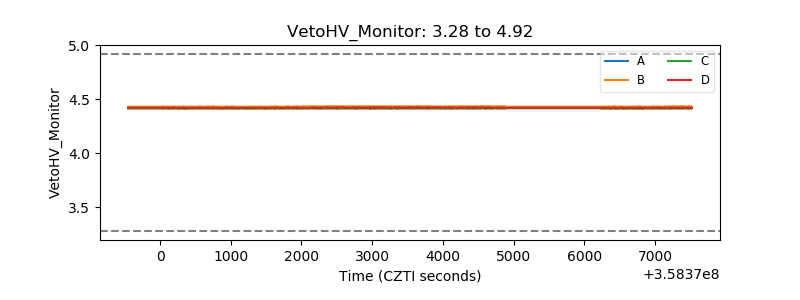 |
| Veto LLD | 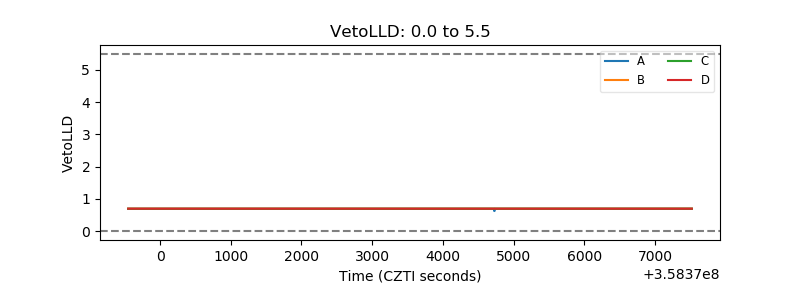 |
| Alpha Counter | 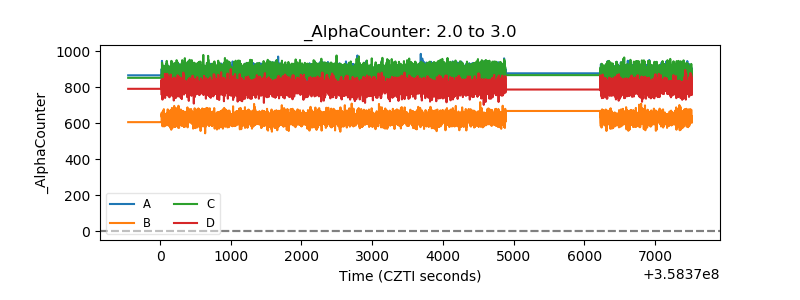 |
| _CPM_Rate | 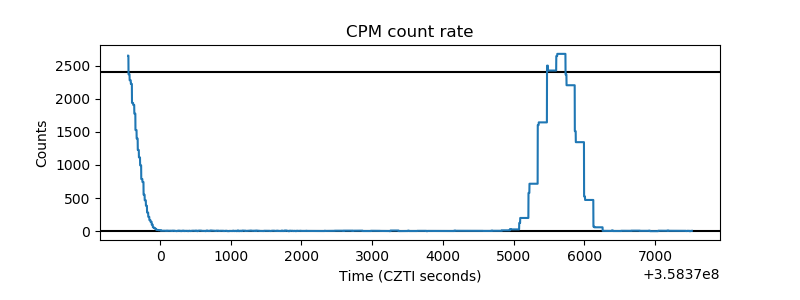 |
| CZT Counter |  |
| +2.5 Volts monitor |  |
| +5 Volts monitor |  |
| _ROLL_ROT | 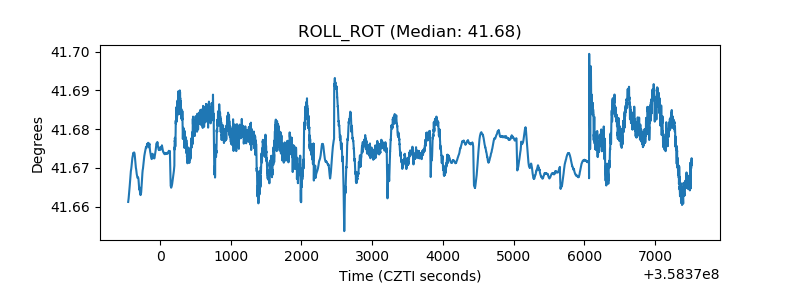 |
| _Roll_DEC | 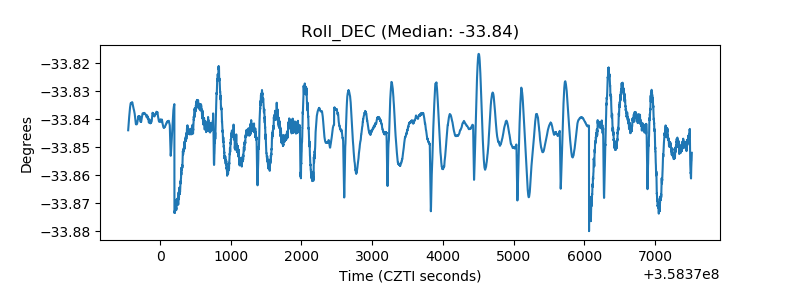 |
| _Roll_RA |  |
| Veto Counter | 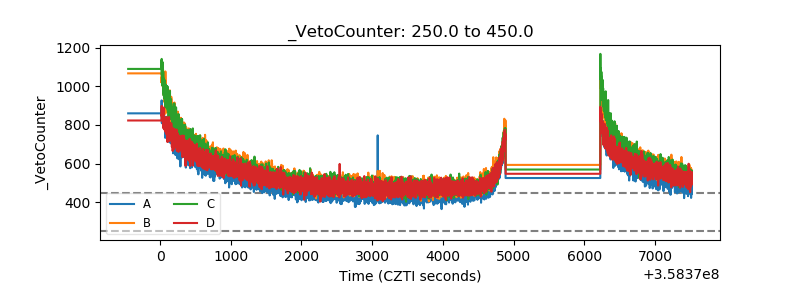 |