| Param | Original file | Final file |
|---|---|---|
| Filename | modeM0/AS1A10_053T17_9000004366_30371cztM0_level2.evt | modeM0/AS1A10_053T17_9000004366_30371cztM0_level2_quad_clean.evt |
| Size (bytes) | 568,595,520 | 96,756,480 |
| Size | 542.3 MB | 92.3 MB |
| Events in quadrant A | 3,498,353 | 627,918 |
| Events in quadrant B | 5,328,801 | 630,392 |
| Events in quadrant C | 4,182,594 | 602,660 |
| Events in quadrant D | 3,757,712 | 603,431 |
| Mode M0 | |||
|---|---|---|---|
| Quadrant | BADHDUFLAG | Total packets | Discarded packets |
| A | 0 | 14426 | 2 |
| B | 0 | 20212 | 2 |
| C | 0 | 16803 | 2 |
| D | 0 | 15362 | 2 |
| Mode M9 | |||
|---|---|---|---|
| Quadrant | BADHDUFLAG | Total packets | Discarded packets |
| A | 0 | 11 | 0 |
| B | 0 | 12 | 0 |
| C | 0 | 12 | 0 |
| D | 0 | 12 | 0 |
| Mode SS | |||
|---|---|---|---|
| Quadrant | BADHDUFLAG | Total packets | Discarded packets |
| A | 0 | 134 | 0 |
| B | 0 | 134 | 0 |
| C | 0 | 134 | 0 |
| D | 0 | 134 | 0 |
| Quadrant | Total seconds | Saturated seconds | Saturation percentage |
|---|---|---|---|
| A | 6687 | 91 | 1.360849% |
| B | 6687 | 136 | 2.033797% |
| C | 6687 | 193 | 2.886197% |
| D | 6687 | 164 | 2.452520% |
Noise dominated data is calculated using 1-second bins in cleaned event files. If a bin has >2000 counts, and if more than 50% of those come from <1% of pixels, then it is considered to be noise-dominated and hence unusable.
| Quadrant | # 1 sec bins | Bins with >0 counts | Bins with >2000 counts | High rate bins dominated by noise | Noise dominated (total time) | Noise dominated (detector-on time) | Marked lightcurve |
|---|---|---|---|---|---|---|---|
| A | 7672 | 6687 | 19 | 19 | 0.25% | 0.28% | 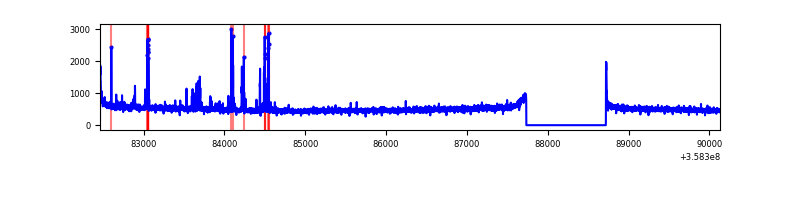 |
| B | 7672 | 6687 | 2 | 2 | 0.03% | 0.03% | 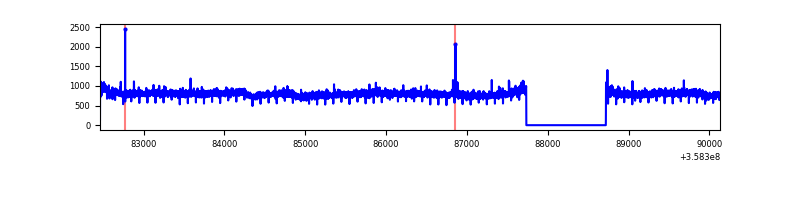 |
| C | 7672 | 6687 | 3 | 3 | 0.04% | 0.04% | 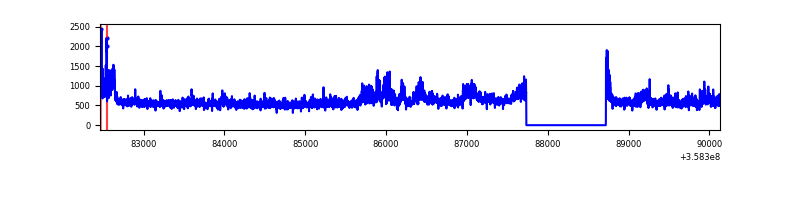 |
| D | 7672 | 6687 | 107 | 107 | 1.39% | 1.60% | 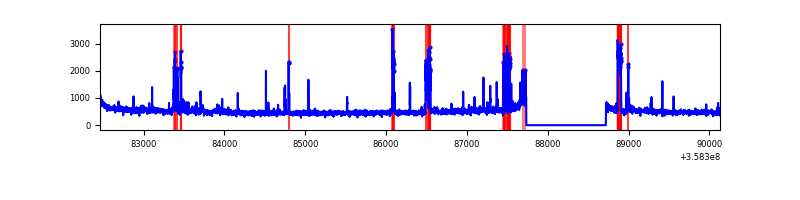 |
Top three noisy pixels from each quadrant. If the there are fewer than three noisy pixels in the level2.evt file, extra rows are filled as -1
| Pixel properties | Quadrant properties | ||||||
|---|---|---|---|---|---|---|---|
| Quadrant | DetID | PixID | Counts | Sigma | Mean | Median | Sigma |
| A | 0 | 13 | 150526 | 874.12 | 860 | 845 | 171.2 |
| A | 8 | 192 | 24565 | 138.52 | 860 | 845 | 171.2 |
| A | 13 | 254 | 12582 | 68.54 | 860 | 845 | 171.2 |
| B | 6 | 159 | 1949156 | 11894.47 | 856 | 835 | 163.8 |
| B | 12 | 111 | 19896 | 116.37 | 856 | 835 | 163.8 |
| B | 11 | 111 | 18517 | 107.95 | 856 | 835 | 163.8 |
| C | 3 | 233 | 781078 | 4059.72 | 828 | 834 | 192.2 |
| C | 14 | 238 | 136375 | 705.24 | 828 | 834 | 192.2 |
| C | 0 | 10 | 21926 | 109.74 | 828 | 834 | 192.2 |
| D | 13 | 168 | 326485 | 1639.8 | 832 | 815 | 198.6 |
| D | 8 | 195 | 142902 | 715.43 | 832 | 815 | 198.6 |
| D | 2 | 250 | 59722 | 296.61 | 832 | 815 | 198.6 |
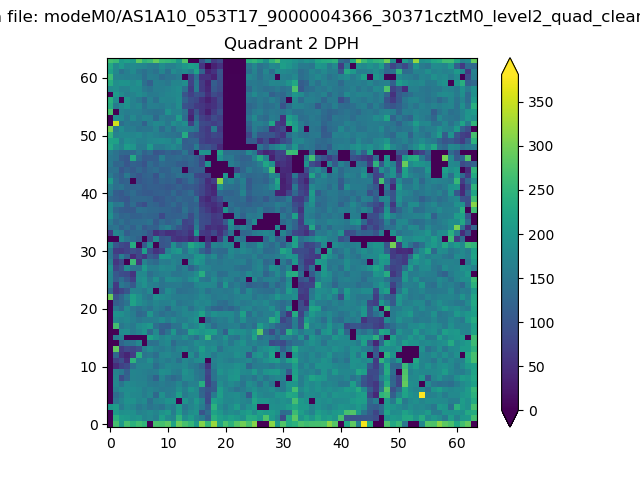
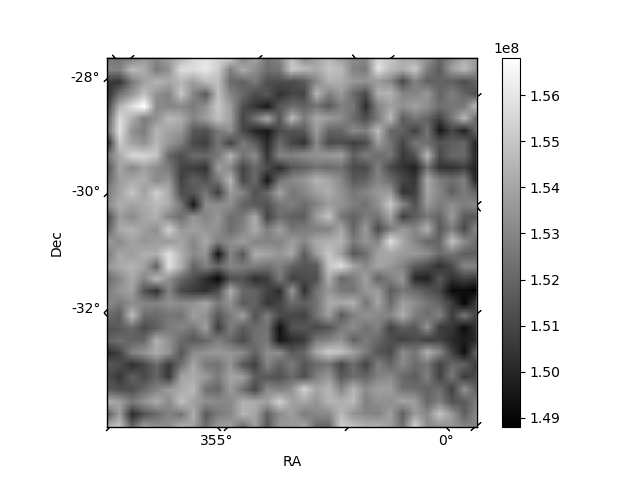
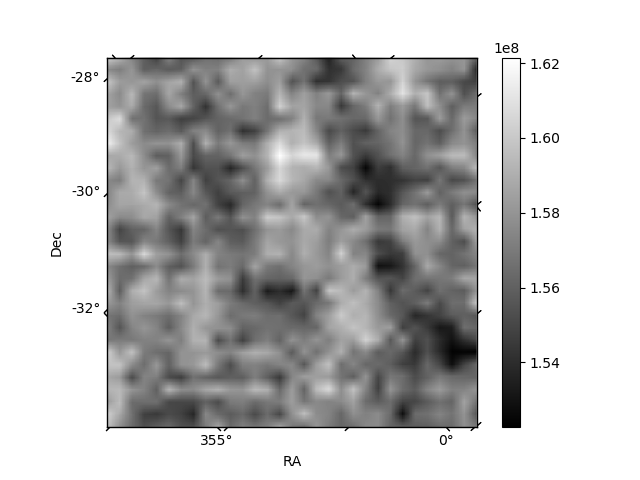
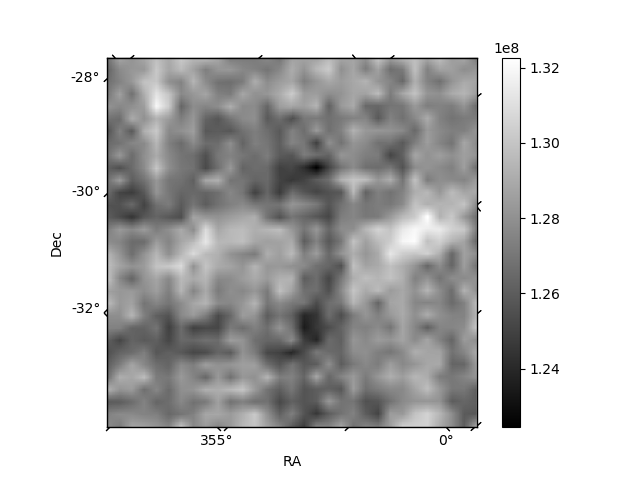
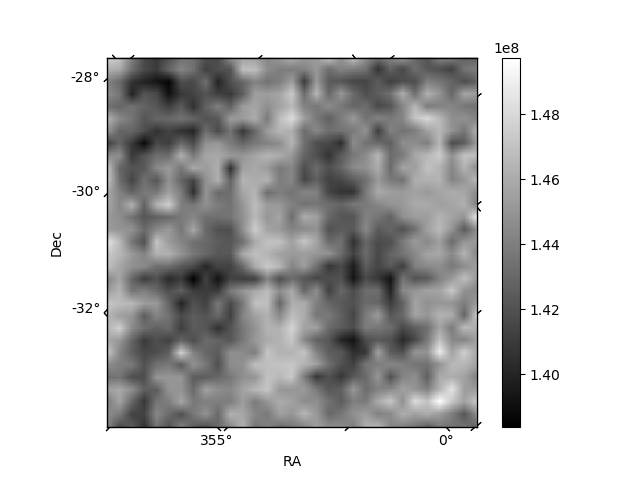
Histogram calculated using DETX and DETY for each event in the final _common_clean file
| Quadrant A | 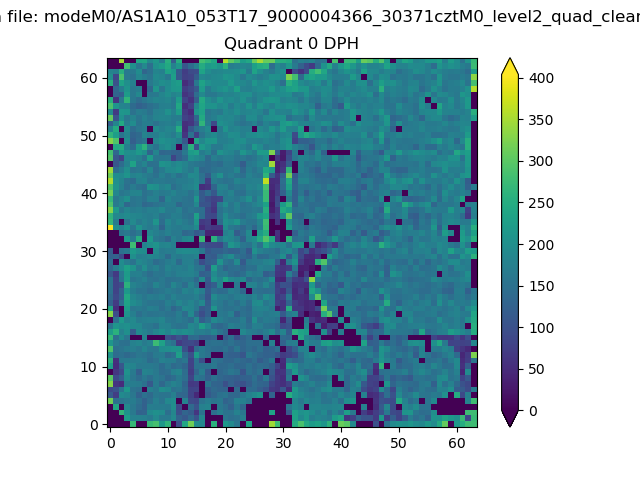 |
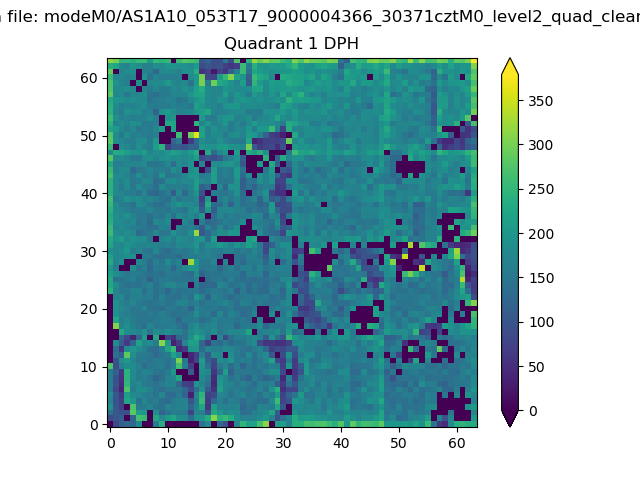 |
Quadrant B |
|---|---|---|---|
| Quadrant D | 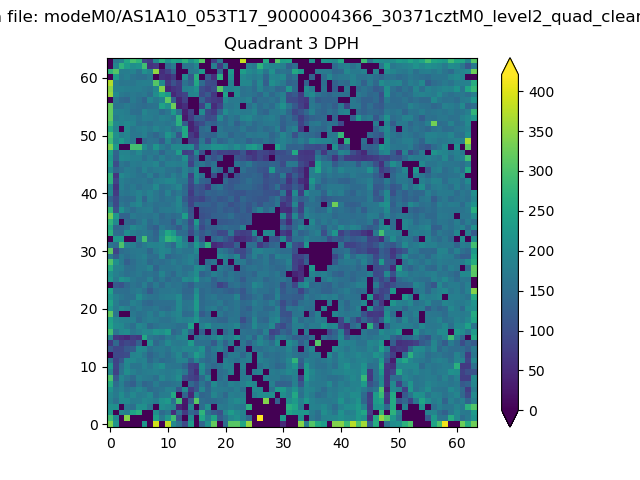 |
 |
Quadrant C |
| Plot type | Count rate plots | Images |
|---|---|---|
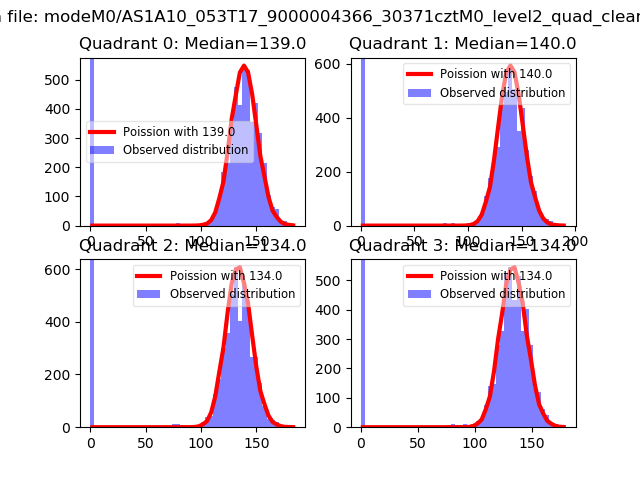
| Comparison with Poisson distribution Blue bars denote a histogram of data divided into 1 sec bins. Red curve is a Poisson curve with rate = median count rate of data. |
 |
 |
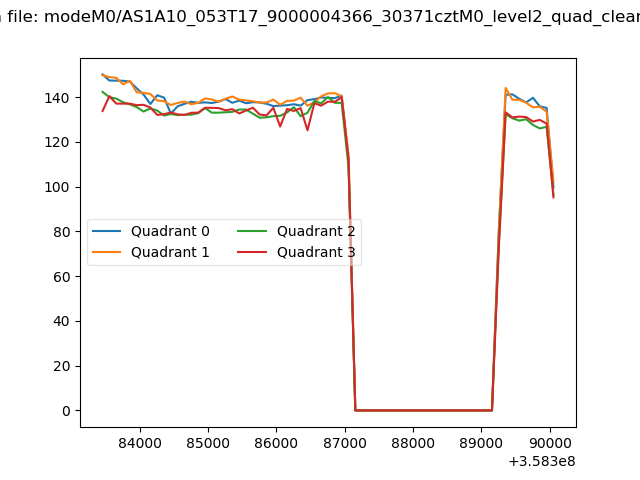
| Quadrant-wise count rates Data is divided into 100 sec bins |
 |
|
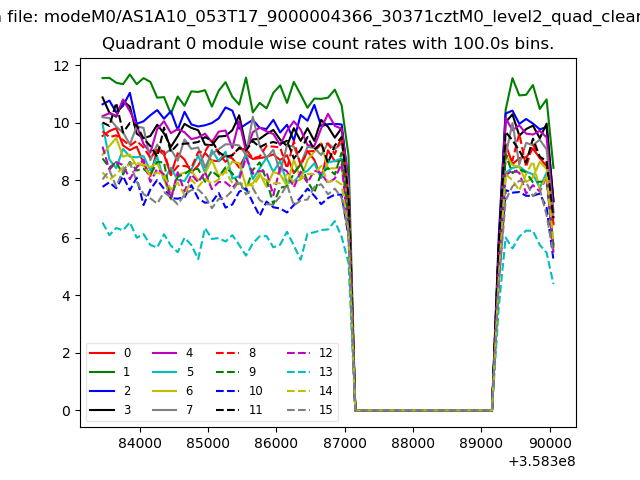
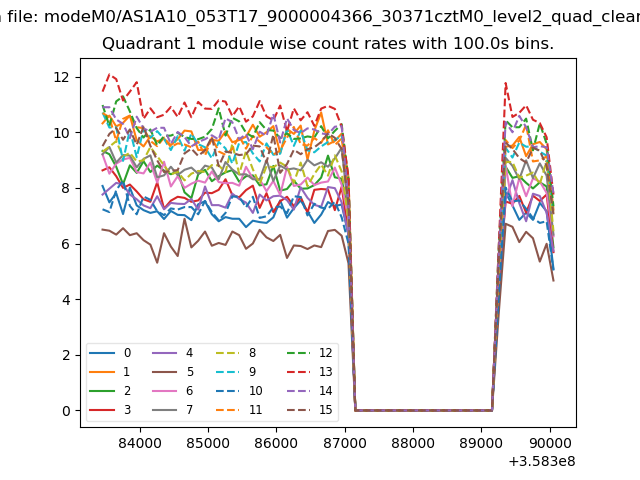
| Module-wise count rates for Quadrant A Data is divided into 100 sec bins |
 |
 |
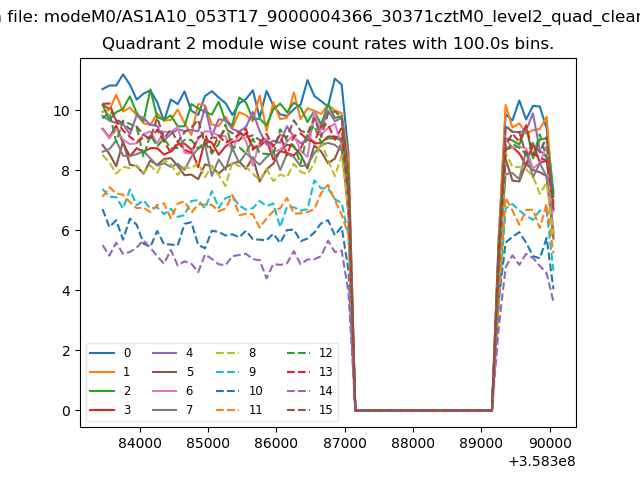
| Module-wise count rates for Quadrant B Data is divided into 100 sec bins |
 |
 |
| Module-wise count rates for Quadrant C Data is divided into 100 sec bins |
 |
 |
| Module-wise count rates for Quadrant D Data is divided into 100 sec bins |
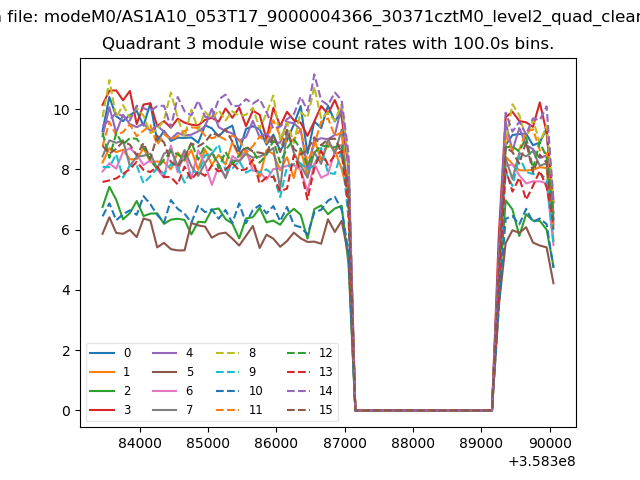 |
 |
| Parameter | Plot |
|---|---|
| CZT HV Monitor | 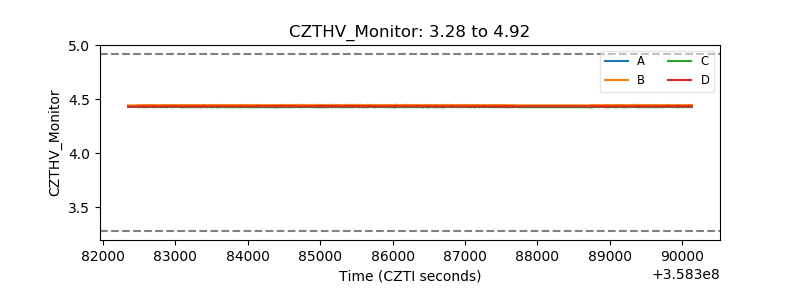 |
| D_VDD | 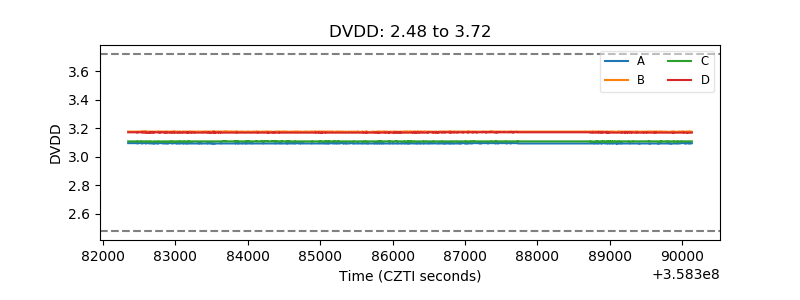 |
| Temperature 1 | 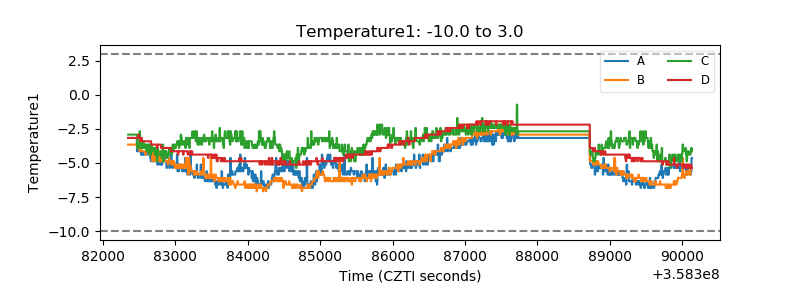 |
| Veto HV Monitor | 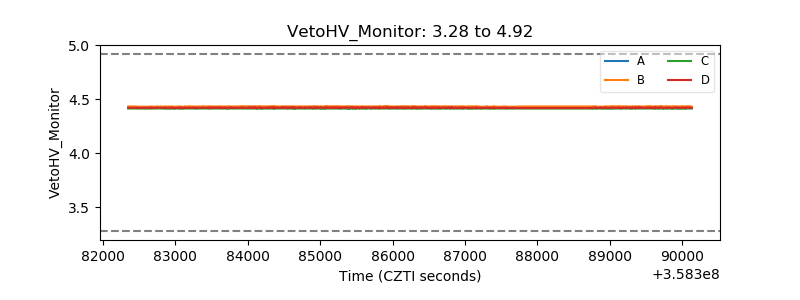 |
| Veto LLD | 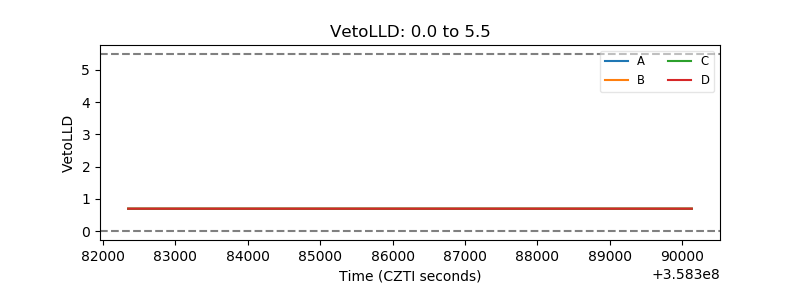 |
| Alpha Counter | 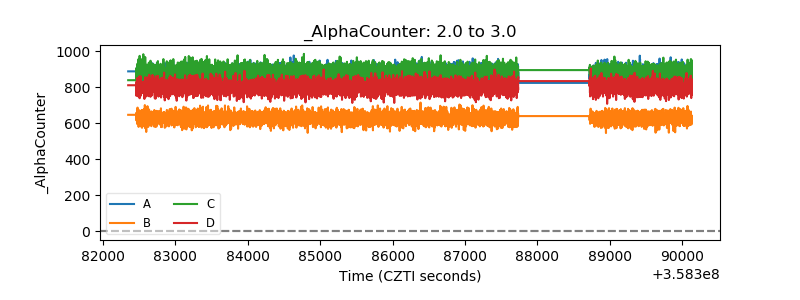 |
| _CPM_Rate | 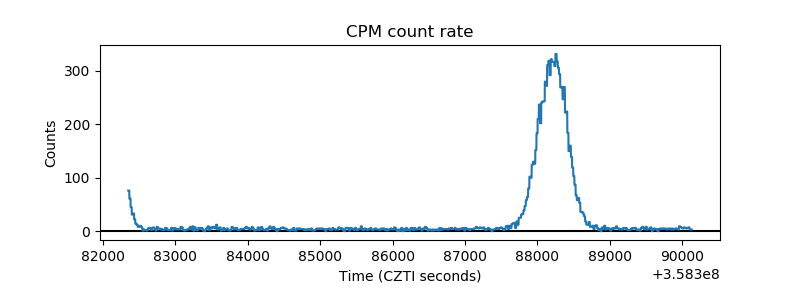 |
| CZT Counter | 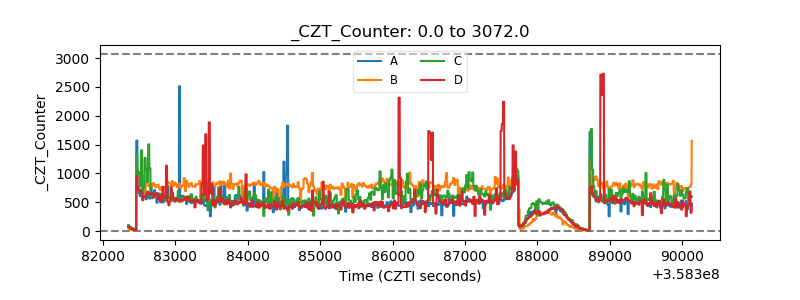 |
| +2.5 Volts monitor |  |
| +5 Volts monitor |  |
| _ROLL_ROT | 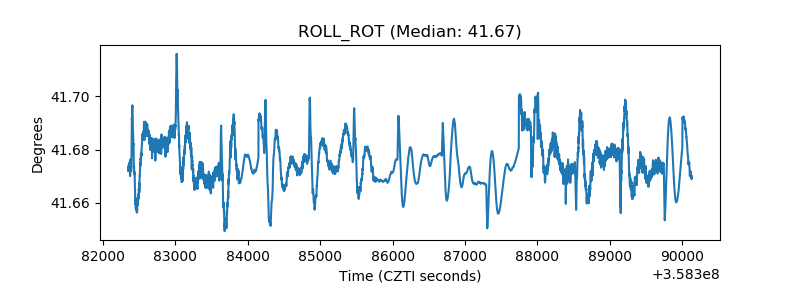 |
| _Roll_DEC | 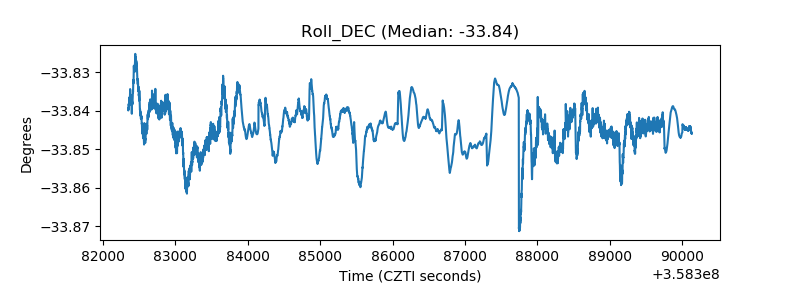 |
| _Roll_RA | 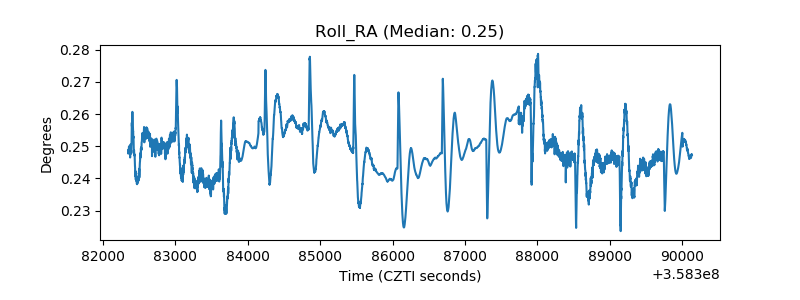 |
| Veto Counter | 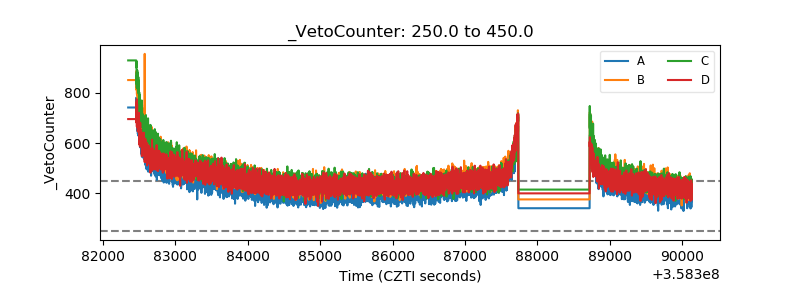 |