| Param | Original file | Final file |
|---|---|---|
| Filename | modeM0/AS1A10_053T17_9000004366_30377cztM0_level2.evt | modeM0/AS1A10_053T17_9000004366_30377cztM0_level2_quad_clean.evt |
| Size (bytes) | 148,728,960 | 25,312,320 |
| Size | 141.8 MB | 24.1 MB |
| Events in quadrant A | 892,924 | 164,271 |
| Events in quadrant B | 1,403,200 | 163,038 |
| Events in quadrant C | 1,103,998 | 154,082 |
| Events in quadrant D | 980,706 | 154,069 |
| Mode M0 | |||
|---|---|---|---|
| Quadrant | BADHDUFLAG | Total packets | Discarded packets |
| A | 0 | 3719 | 1 |
| B | 0 | 5354 | 1 |
| C | 0 | 4476 | 1 |
| D | 0 | 4016 | 1 |
| Mode M9 | |||
|---|---|---|---|
| Quadrant | BADHDUFLAG | Total packets | Discarded packets |
| A | 0 | 8 | 0 |
| B | 0 | 9 | 0 |
| C | 0 | 9 | 0 |
| D | 0 | 9 | 0 |
| Mode SS | |||
|---|---|---|---|
| Quadrant | BADHDUFLAG | Total packets | Discarded packets |
| A | 0 | 36 | 0 |
| B | 0 | 36 | 0 |
| C | 0 | 36 | 0 |
| D | 0 | 36 | 0 |
| Quadrant | Total seconds | Saturated seconds | Saturation percentage |
|---|---|---|---|
| A | 1779 | 13 | 0.730748% |
| B | 1779 | 23 | 1.292861% |
| C | 1779 | 41 | 2.304666% |
| D | 1779 | 46 | 2.585722% |
Noise dominated data is calculated using 1-second bins in cleaned event files. If a bin has >2000 counts, and if more than 50% of those come from <1% of pixels, then it is considered to be noise-dominated and hence unusable.
| Quadrant | # 1 sec bins | Bins with >0 counts | Bins with >2000 counts | High rate bins dominated by noise | Noise dominated (total time) | Noise dominated (detector-on time) | Marked lightcurve |
|---|---|---|---|---|---|---|---|
| A | 1779 | 1779 | 0 | 0 | 0.00% | 0.00% | 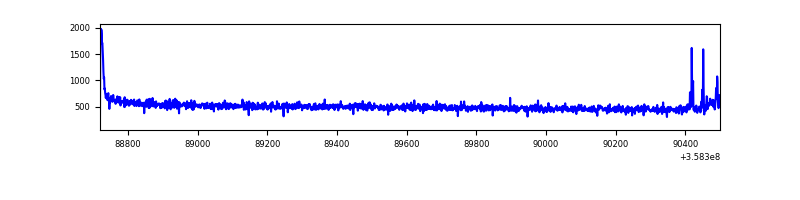 |
| B | 1779 | 1779 | 0 | 0 | 0.00% | 0.00% | 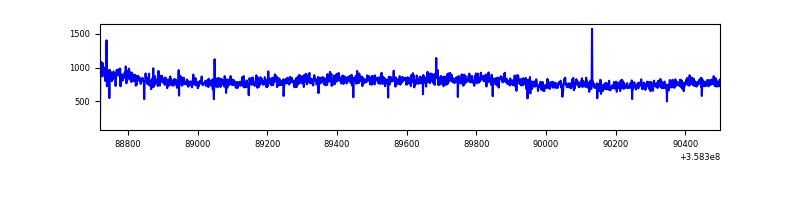 |
| C | 1779 | 1779 | 0 | 0 | 0.00% | 0.00% | 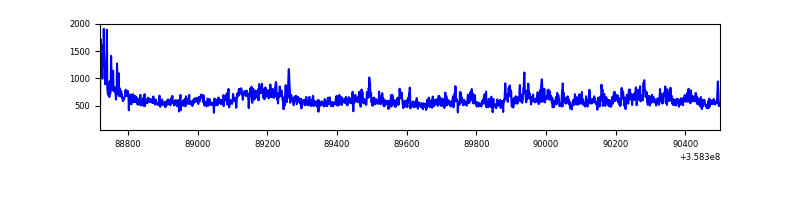 |
| D | 1779 | 1779 | 40 | 40 | 2.25% | 2.25% |  |
Top three noisy pixels from each quadrant. If the there are fewer than three noisy pixels in the level2.evt file, extra rows are filled as -1
| Pixel properties | Quadrant properties | ||||||
|---|---|---|---|---|---|---|---|
| Quadrant | DetID | PixID | Counts | Sigma | Mean | Median | Sigma |
| A | 0 | 13 | 14393 | 305.29 | 224 | 220 | 46.4 |
| A | 8 | 192 | 13409 | 284.09 | 224 | 220 | 46.4 |
| A | 13 | 254 | 3606 | 72.93 | 224 | 220 | 46.4 |
| B | 6 | 159 | 511143 | 11230.63 | 226 | 220 | 45.5 |
| B | 12 | 111 | 5567 | 117.53 | 226 | 220 | 45.5 |
| B | 11 | 111 | 4991 | 104.87 | 226 | 220 | 45.5 |
| C | 3 | 233 | 203888 | 3865.88 | 218 | 219 | 52.7 |
| C | 14 | 238 | 35039 | 660.93 | 218 | 219 | 52.7 |
| C | 0 | 10 | 9694 | 179.85 | 218 | 219 | 52.7 |
| D | 13 | 168 | 103289 | 1941.03 | 215 | 210 | 53.1 |
| D | 8 | 195 | 36417 | 681.8 | 215 | 210 | 53.1 |
| D | 1 | 52 | 10117 | 186.55 | 215 | 210 | 53.1 |
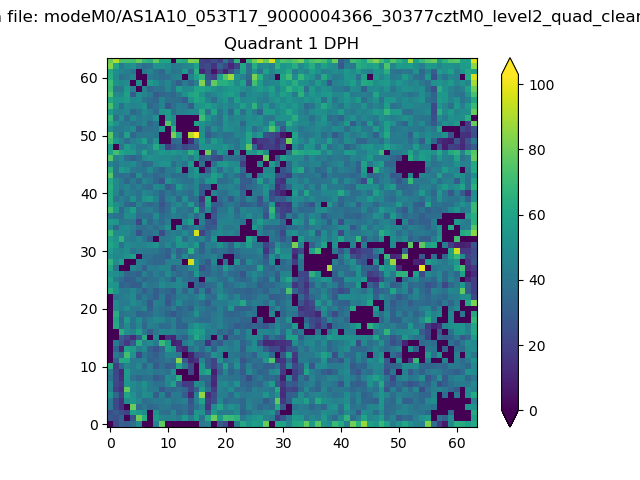
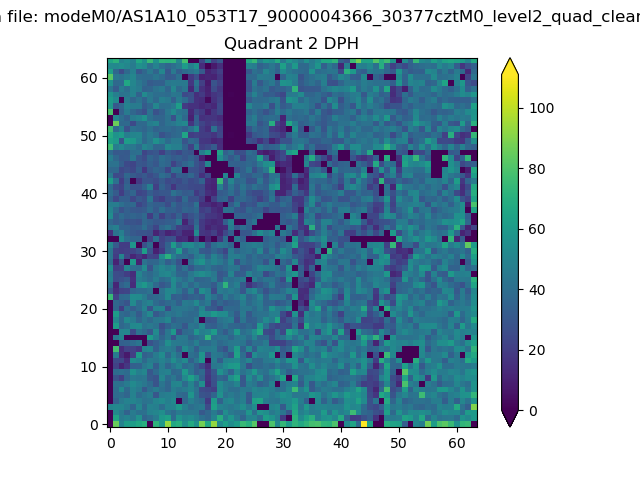
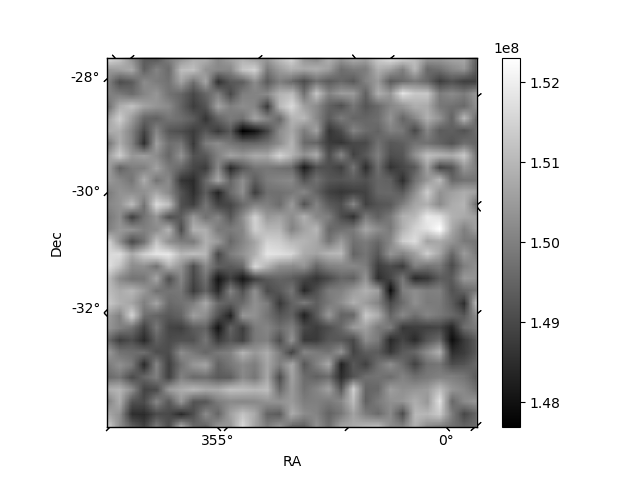
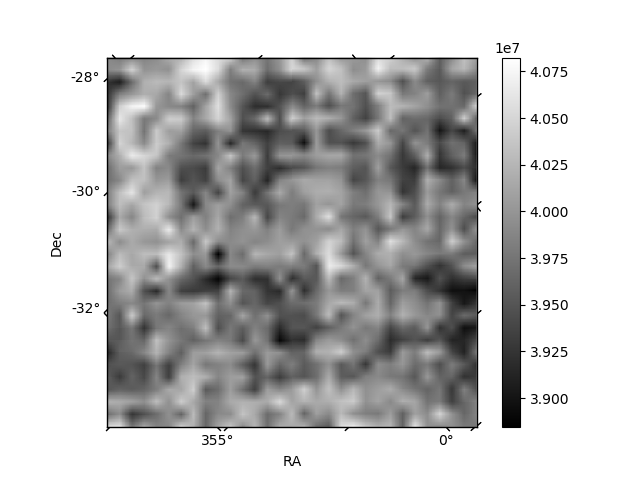
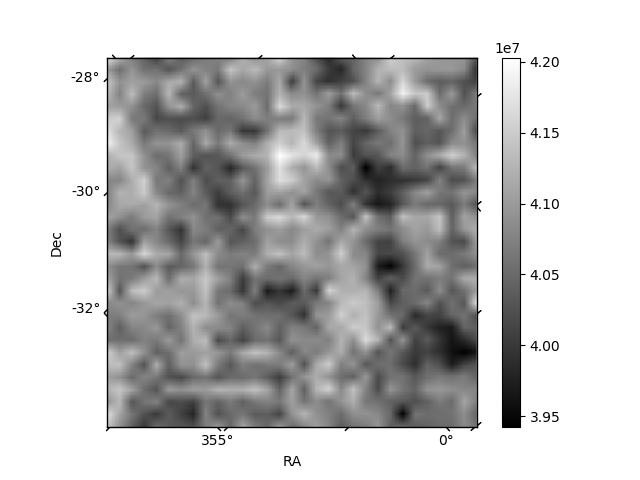
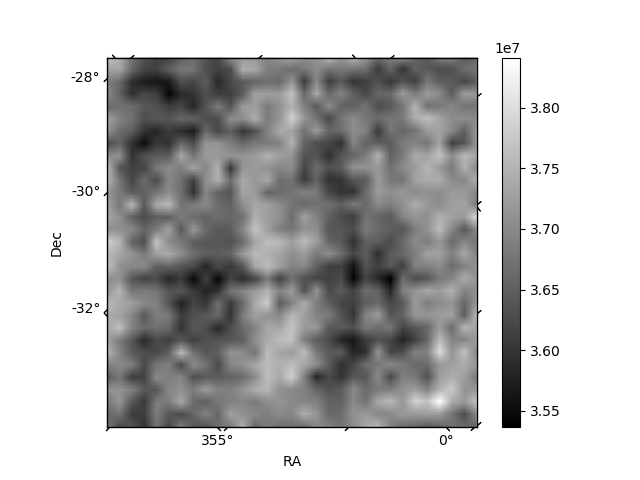
Histogram calculated using DETX and DETY for each event in the final _common_clean file
| Quadrant A | 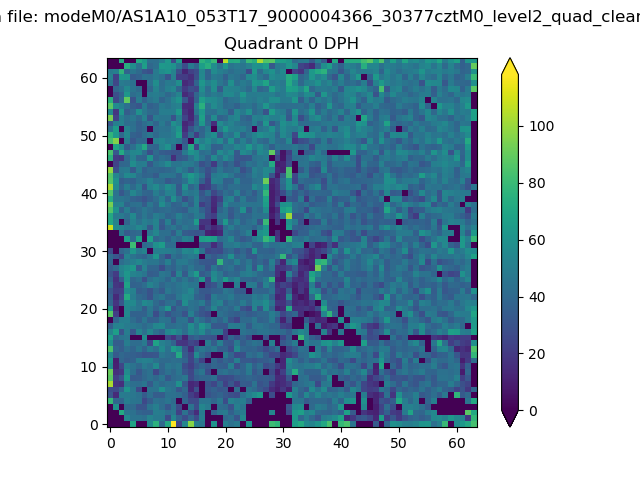 |
 |
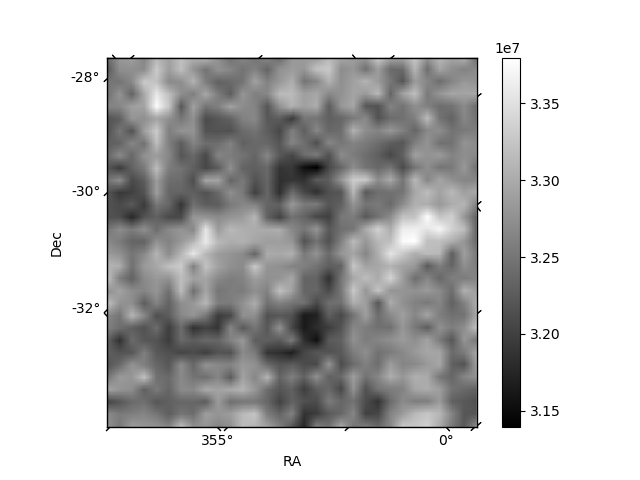
Quadrant B |
|---|---|---|---|
| Quadrant D | 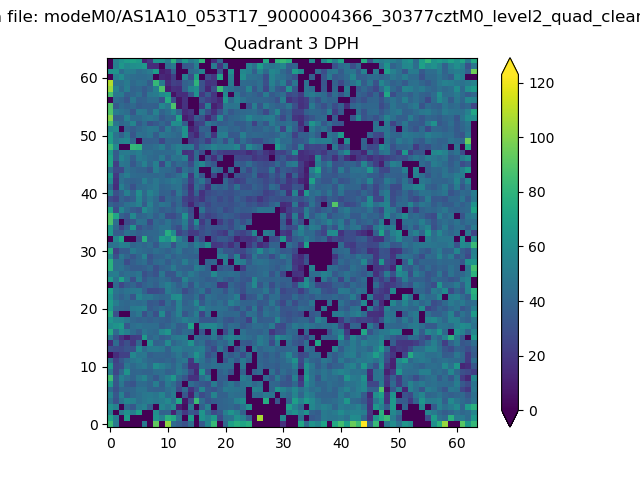 |
 |
Quadrant C |
| Plot type | Count rate plots | Images |
|---|---|---|
| Comparison with Poisson distribution Blue bars denote a histogram of data divided into 1 sec bins. Red curve is a Poisson curve with rate = median count rate of data. |
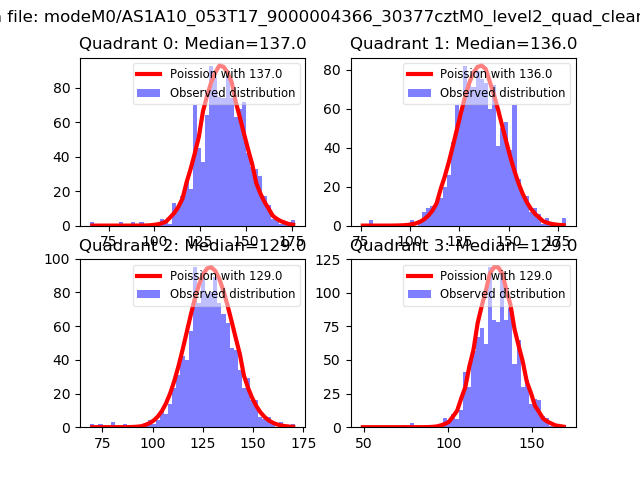 |
 |
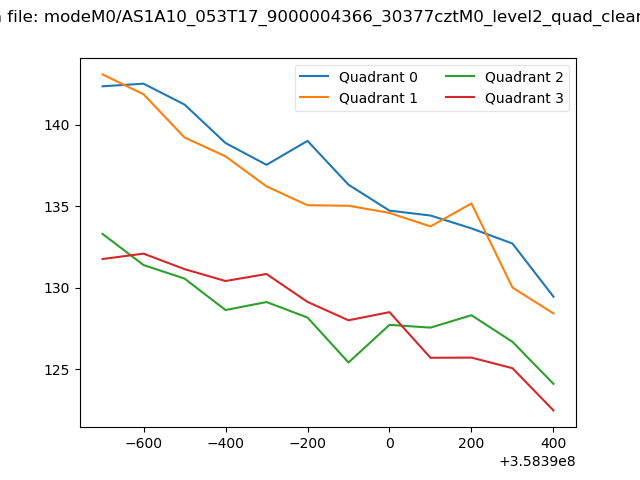
| Quadrant-wise count rates Data is divided into 100 sec bins |
 |
|
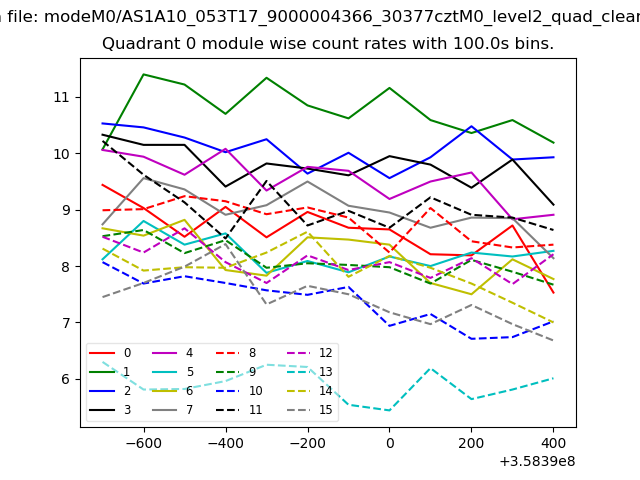
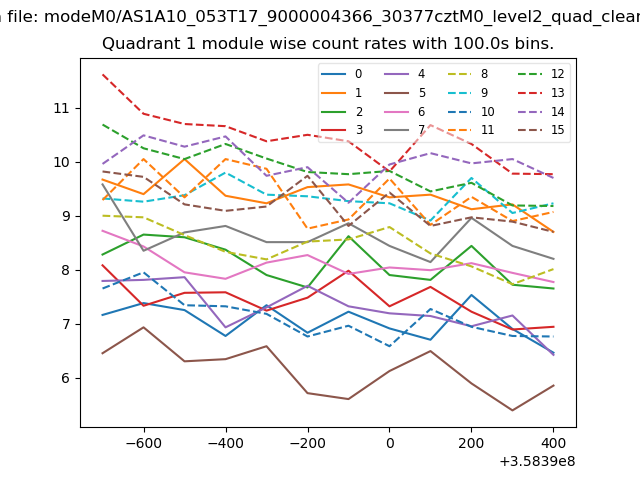
| Module-wise count rates for Quadrant A Data is divided into 100 sec bins |
 |
 |
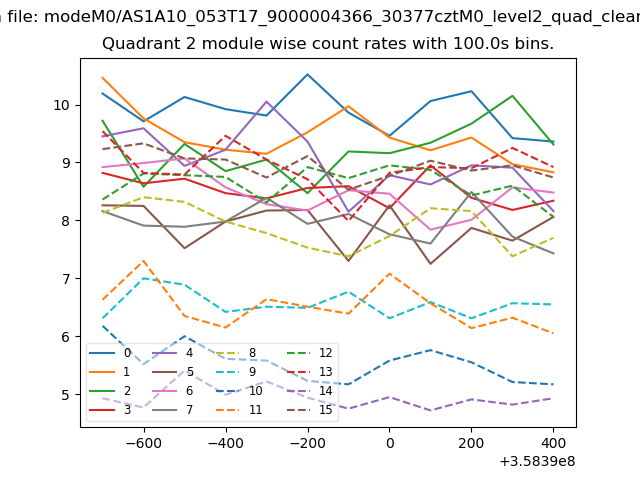
| Module-wise count rates for Quadrant B Data is divided into 100 sec bins |
 |
 |
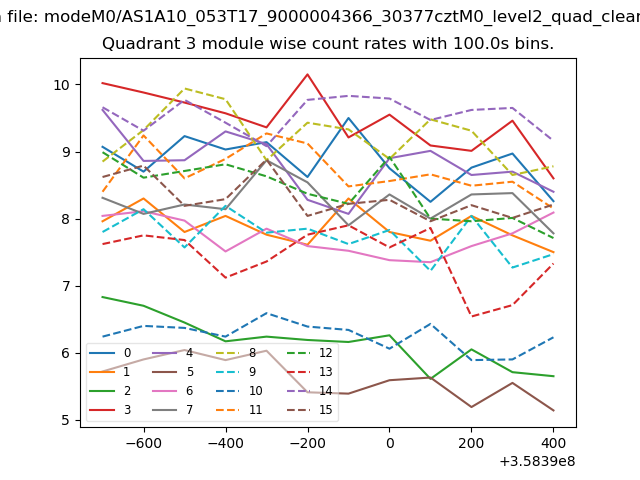
| Module-wise count rates for Quadrant C Data is divided into 100 sec bins |
 |
 |
| Module-wise count rates for Quadrant D Data is divided into 100 sec bins |
 |
 |
| Parameter | Plot |
|---|---|
| CZT HV Monitor | 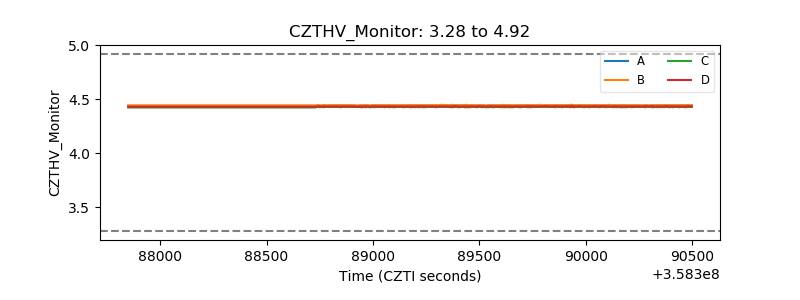 |
| D_VDD | 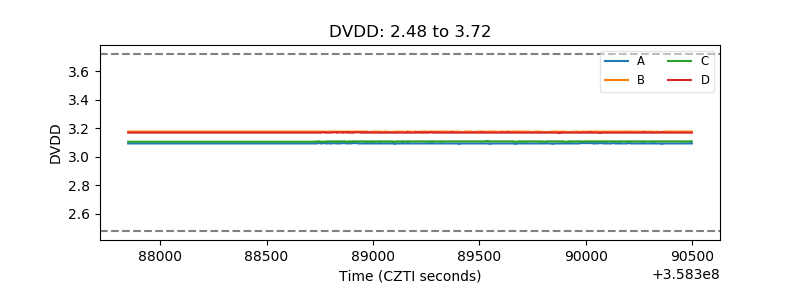 |
| Temperature 1 | 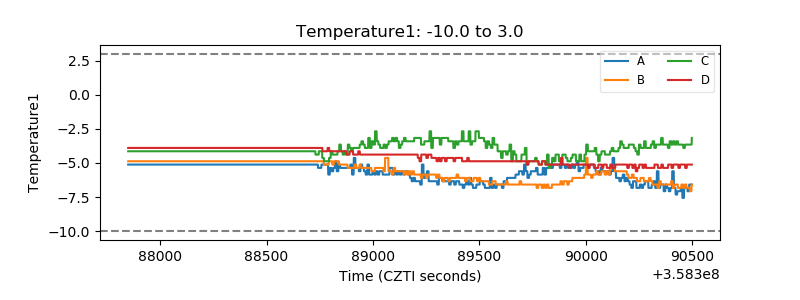 |
| Veto HV Monitor |  |
| Veto LLD | 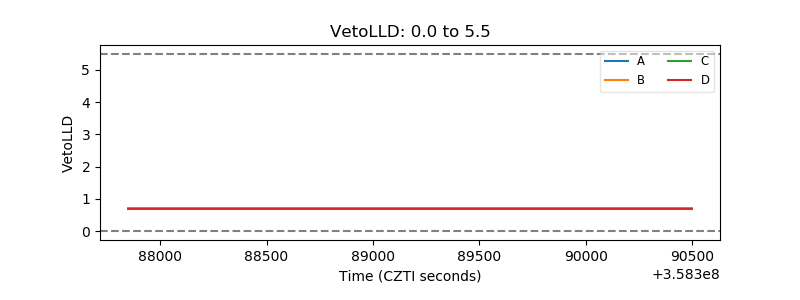 |
| Alpha Counter | 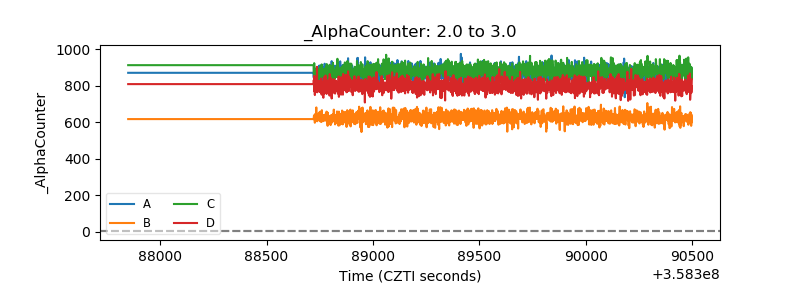 |
| _CPM_Rate | 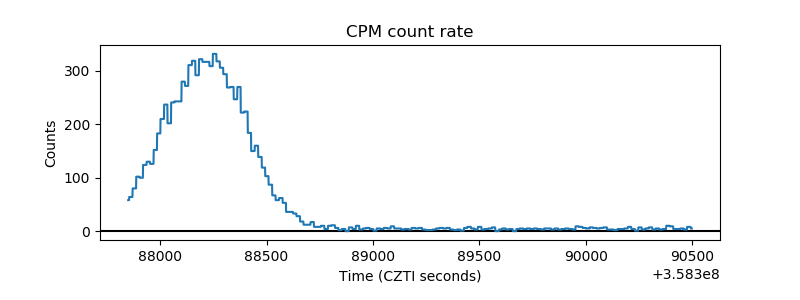 |
| CZT Counter | 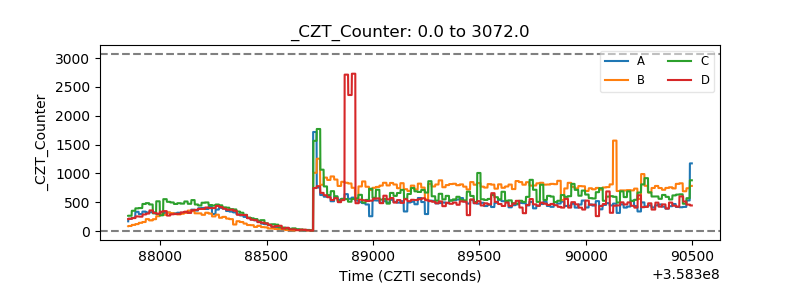 |
| +2.5 Volts monitor | 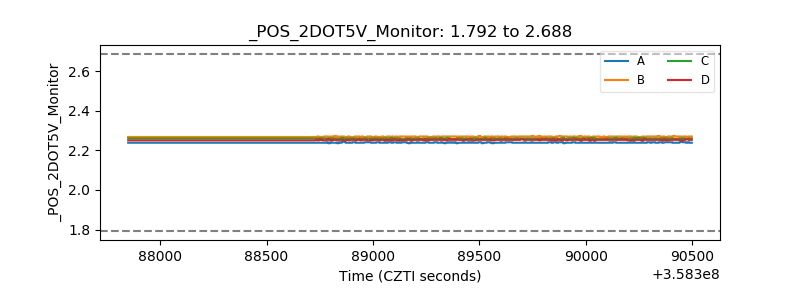 |
| +5 Volts monitor | 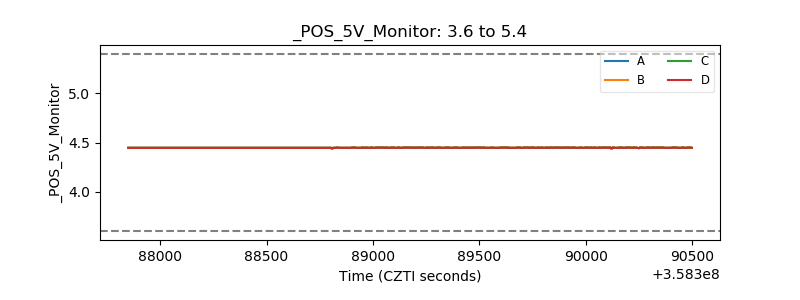 |
| _ROLL_ROT |  |
| _Roll_DEC |  |
| _Roll_RA | 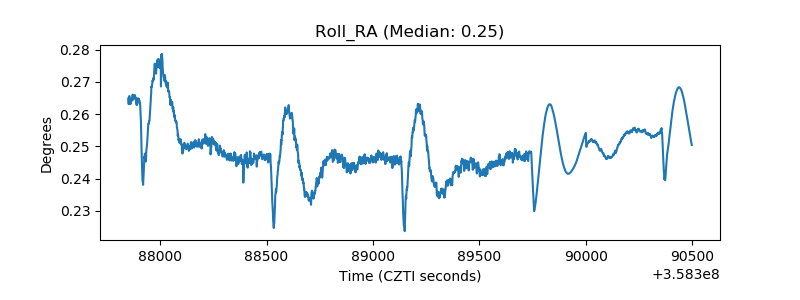 |
| Veto Counter | 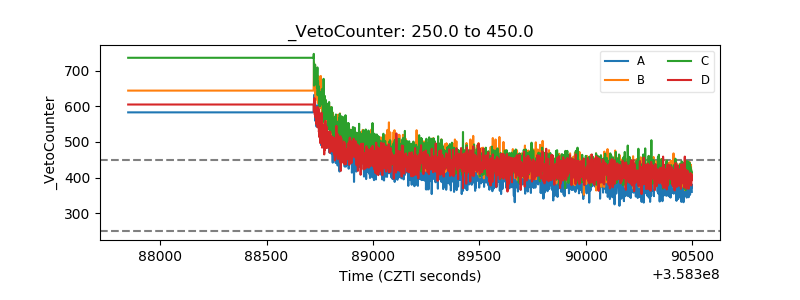 |