| Param | Original file | Final file |
|---|---|---|
| Filename | modeM0/AS1T04_003T01_9000004368cztM0_level2.fits | modeM0/AS1T04_003T01_9000004368cztM0_level2_quad_clean.evt |
| Size (bytes) | 347,627,520 | 345,404,160 |
| Size | 331.5 MB | 329.4 MB |
| Events in quadrant A | 2,123,282 | 2,083,761 |
| Events in quadrant B | 2,010,562 | 2,074,754 |
| Events in quadrant C | 2,067,392 | 1,979,913 |
| Events in quadrant D | 1,829,398 | 1,825,318 |
| Mode M0 | |||
|---|---|---|---|
| Quadrant | BADHDUFLAG | Total packets | Discarded packets |
| A | 0 | 75250 | 0 |
| B | 0 | 110240 | 0 |
| C | 0 | 80160 | 0 |
| D | 0 | 89626 | 0 |
| Mode SS | |||
|---|---|---|---|
| Quadrant | BADHDUFLAG | Total packets | Discarded packets |
| A | 0 | 740 | 0 |
| B | 0 | 740 | 0 |
| C | 0 | 740 | 0 |
| D | 0 | 740 | 0 |
| Mode M9 | |||
|---|---|---|---|
| Quadrant | BADHDUFLAG | Total packets | Discarded packets |
| A | 0 | 28 | 0 |
| B | 0 | 28 | 0 |
| C | 0 | 28 | 0 |
| D | 0 | 28 | 0 |
| Quadrant | Total seconds | Saturated seconds | Saturation percentage |
|---|---|---|---|
| A | 36354 | 639 | 1.757716% |
| B | 36354 | 962 | 2.646201% |
| C | 36354 | 1020 | 2.805744% |
| D | 36354 | 806 | 2.217088% |
Noise dominated data is calculated using 1-second bins in cleaned event files. If a bin has >2000 counts, and if more than 50% of those come from <1% of pixels, then it is considered to be noise-dominated and hence unusable.
| Quadrant | # 1 sec bins | Bins with >0 counts | Bins with >2000 counts | High rate bins dominated by noise | Noise dominated (total time) | Noise dominated (detector-on time) | Marked lightcurve |
|---|---|---|---|---|---|---|---|
| A | 39049 | 36347 | 0 | 0 | 0.00% | 0.00% |  |
| B | 39049 | 36345 | 0 | 0 | 0.00% | 0.00% |  |
| C | 39049 | 36344 | 0 | 0 | 0.00% | 0.00% |  |
| D | 39049 | 36345 | 0 | 0 | 0.00% | 0.00% |  |
Top three noisy pixels from each quadrant. If the there are fewer than three noisy pixels in the level2.evt file, extra rows are filled as -1
| Pixel properties | Quadrant properties | ||||||
|---|---|---|---|---|---|---|---|
| Quadrant | DetID | PixID | Counts | Sigma | Mean | Median | Sigma |
| A | 0 | 29 | 1826 | 9.57 | 554 | 520 | 136.5 |
| A | 7 | 110 | 1735 | 8.9 | 554 | 520 | 136.5 |
| A | 9 | 19 | 1628 | 8.12 | 554 | 520 | 136.5 |
| B | 2 | 9 | 1643 | 10.87 | 530 | 505 | 104.7 |
| B | 2 | 8 | 1427 | 8.81 | 530 | 505 | 104.7 |
| B | 3 | 17 | 1378 | 8.34 | 530 | 505 | 104.7 |
| C | 3 | 202 | 1564 | 7.54 | 546 | 510 | 139.8 |
| C | 3 | 203 | 1483 | 6.96 | 546 | 510 | 139.8 |
| C | 12 | 241 | 1475 | 6.9 | 546 | 510 | 139.8 |
| D | 15 | 46 | 1353 | 6.23 | 521 | 474 | 141.1 |
| D | 3 | 14 | 1347 | 6.19 | 521 | 474 | 141.1 |
| D | 10 | 189 | 1330 | 6.07 | 521 | 474 | 141.1 |
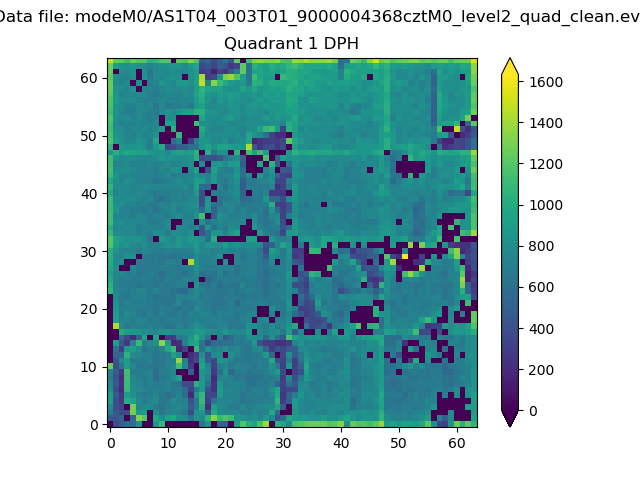
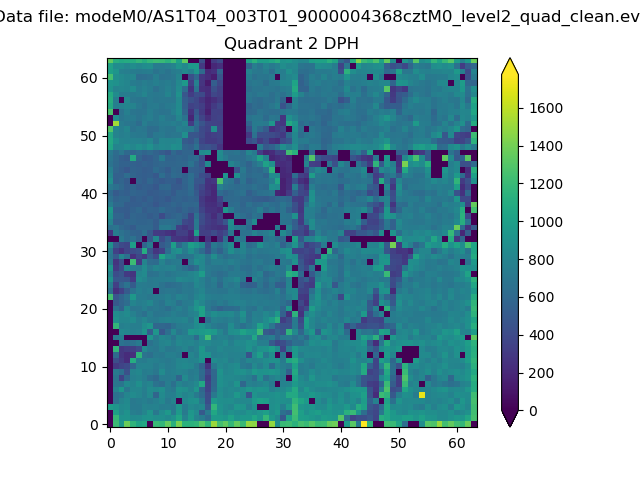
Histogram calculated using DETX and DETY for each event in the final _common_clean file
| Quadrant A |  |
 |
Quadrant B |
|---|---|---|---|
| Quadrant D |  |
 |
Quadrant C |
| Plot type | Count rate plots | Images |
|---|---|---|
| Comparison with Poisson distribution Blue bars denote a histogram of data divided into 1 sec bins. Red curve is a Poisson curve with rate = median count rate of data. |
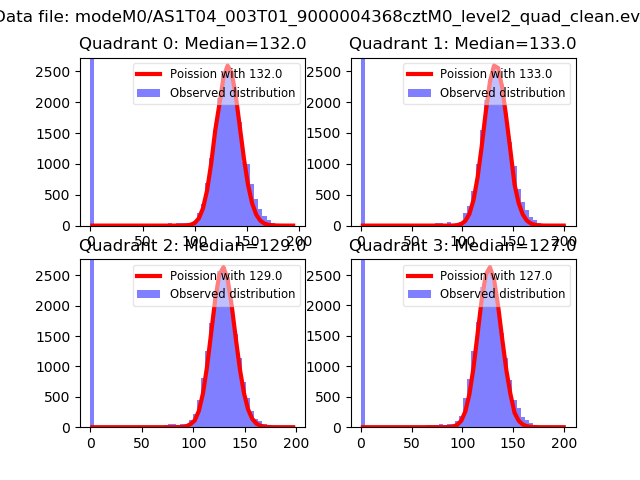 |
 |
| Quadrant-wise count rates Data is divided into 100 sec bins |
 |
|
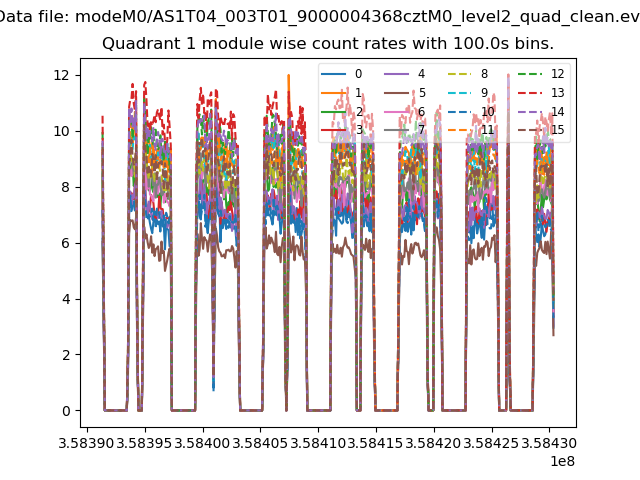
| Module-wise count rates for Quadrant A Data is divided into 100 sec bins |
 |
 |
| Module-wise count rates for Quadrant B Data is divided into 100 sec bins |
 |
 |
| Module-wise count rates for Quadrant C Data is divided into 100 sec bins |
 |
 |
| Module-wise count rates for Quadrant D Data is divided into 100 sec bins |
 |
 |
| Parameter | Plot |
|---|---|
| CZT HV Monitor |  |
| D_VDD |  |
| Temperature 1 |  |
| Veto HV Monitor |  |
| Veto LLD |  |
| Alpha Counter | 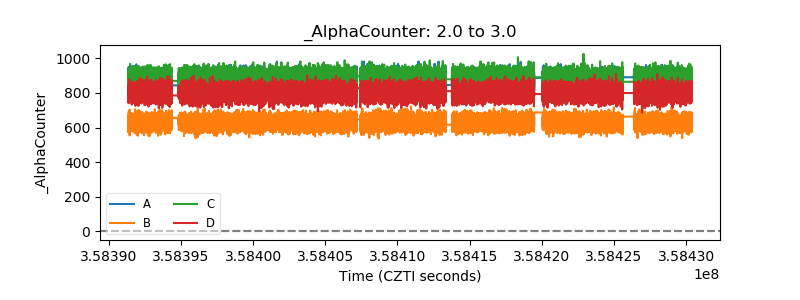 |
| _CPM_Rate |  |
| CZT Counter |  |
| +2.5 Volts monitor |  |
| +5 Volts monitor |  |
| _ROLL_ROT |  |
| _Roll_DEC |  |
| _Roll_RA | 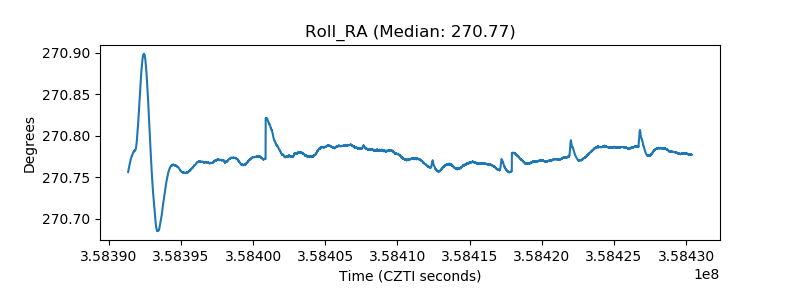 |
| Veto Counter |  |