| Param | Original file | Final file |
|---|---|---|
| Filename | modeM0/AS1T04_003T01_9000004368_30377cztM0_level2.evt | modeM0/AS1T04_003T01_9000004368_30377cztM0_level2_quad_clean.evt |
| Size (bytes) | 2,208,556,800 | 343,313,280 |
| Size | 2.1 GB | 327.4 MB |
| Events in quadrant A | 13,115,694 | 2,172,755 |
| Events in quadrant B | 20,560,625 | 2,184,317 |
| Events in quadrant C | 14,859,995 | 2,106,399 |
| Events in quadrant D | 16,533,820 | 2,079,776 |
| Mode M0 | |||
|---|---|---|---|
| Quadrant | BADHDUFLAG | Total packets | Discarded packets |
| A | 0 | 56101 | 5 |
| B | 0 | 81736 | 5 |
| C | 0 | 60655 | 5 |
| D | 0 | 66908 | 5 |
| Mode SS | |||
|---|---|---|---|
| Quadrant | BADHDUFLAG | Total packets | Discarded packets |
| A | 0 | 550 | 0 |
| B | 0 | 550 | 0 |
| C | 0 | 550 | 0 |
| D | 0 | 550 | 0 |
| Mode M9 | |||
|---|---|---|---|
| Quadrant | BADHDUFLAG | Total packets | Discarded packets |
| A | 0 | 20 | 0 |
| B | 0 | 20 | 0 |
| C | 0 | 20 | 0 |
| D | 0 | 20 | 0 |
| Quadrant | Total seconds | Saturated seconds | Saturation percentage |
|---|---|---|---|
| A | 26972 | 553 | 2.050274% |
| B | 26972 | 810 | 3.003114% |
| C | 26971 | 871 | 3.229395% |
| D | 26971 | 625 | 2.317304% |
Noise dominated data is calculated using 1-second bins in cleaned event files. If a bin has >2000 counts, and if more than 50% of those come from <1% of pixels, then it is considered to be noise-dominated and hence unusable.
| Quadrant | # 1 sec bins | Bins with >0 counts | Bins with >2000 counts | High rate bins dominated by noise | Noise dominated (total time) | Noise dominated (detector-on time) | Marked lightcurve |
|---|---|---|---|---|---|---|---|
| A | 28902 | 26974 | 13 | 13 | 0.04% | 0.05% | 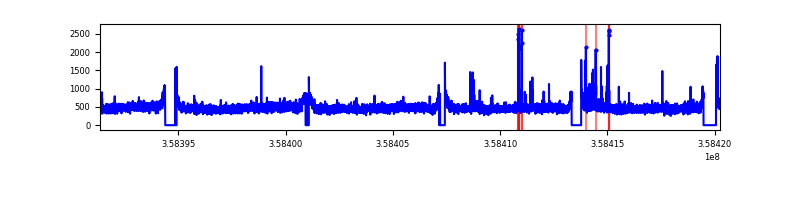 |
| B | 28902 | 26972 | 7 | 7 | 0.02% | 0.03% | 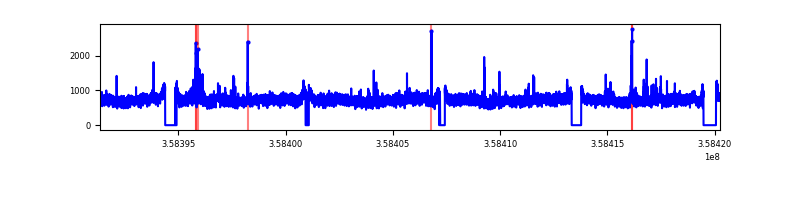 |
| C | 28901 | 26971 | 7 | 7 | 0.02% | 0.03% | 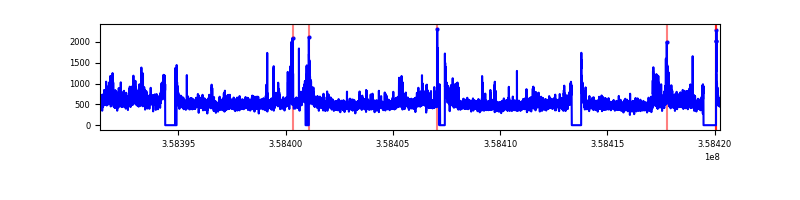 |
| D | 28901 | 26975 | 187 | 187 | 0.65% | 0.69% | 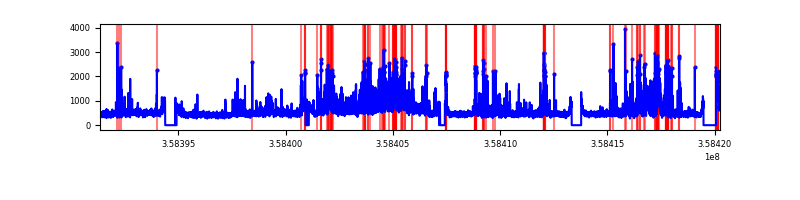 |
Top three noisy pixels from each quadrant. If the there are fewer than three noisy pixels in the level2.evt file, extra rows are filled as -1
| Pixel properties | Quadrant properties | ||||||
|---|---|---|---|---|---|---|---|
| Quadrant | DetID | PixID | Counts | Sigma | Mean | Median | Sigma |
| A | 12 | 96 | 142266 | 207.51 | 3326 | 3244 | 670.0 |
| A | 0 | 13 | 80255 | 114.95 | 3326 | 3244 | 670.0 |
| A | 13 | 254 | 53185 | 74.54 | 3326 | 3244 | 670.0 |
| B | 6 | 159 | 7388420 | 11851.99 | 3284 | 3194 | 623.1 |
| B | 12 | 111 | 80067 | 123.37 | 3284 | 3194 | 623.1 |
| B | 11 | 111 | 73414 | 112.69 | 3284 | 3194 | 623.1 |
| C | 3 | 233 | 1667397 | 2202.34 | 3207 | 3229 | 755.6 |
| C | 14 | 238 | 542837 | 714.11 | 3207 | 3229 | 755.6 |
| C | 2 | 114 | 63181 | 79.34 | 3207 | 3229 | 755.6 |
| D | 8 | 195 | 2358393 | 2849.2 | 3221 | 3160 | 826.6 |
| D | 13 | 104 | 901854 | 1087.18 | 3221 | 3160 | 826.6 |
| D | 7 | 238 | 442885 | 531.95 | 3221 | 3160 | 826.6 |
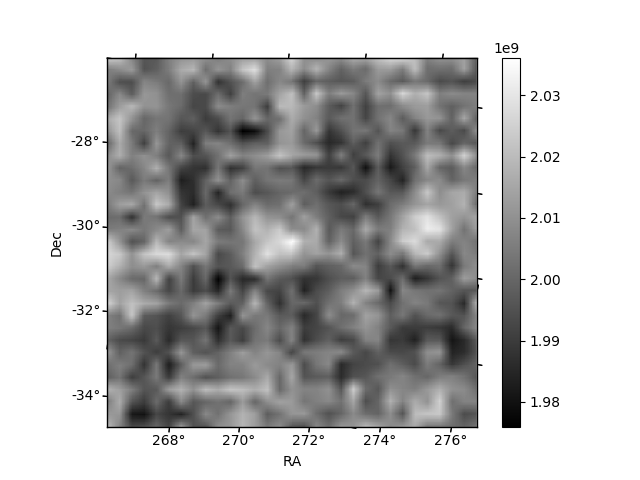
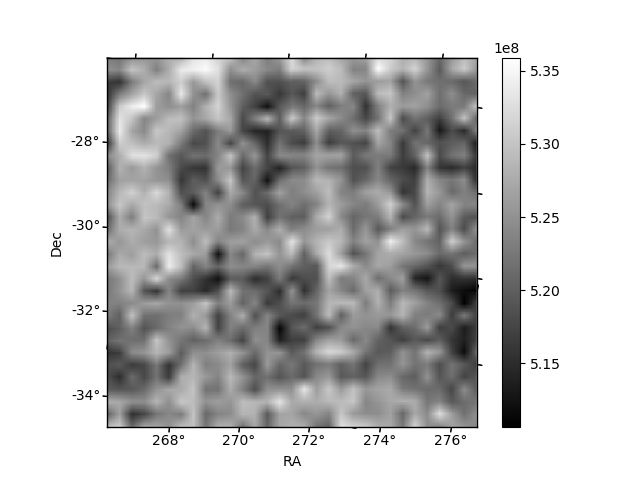
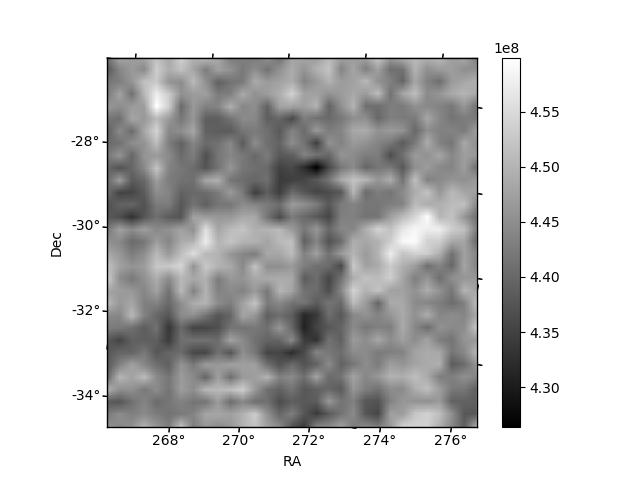
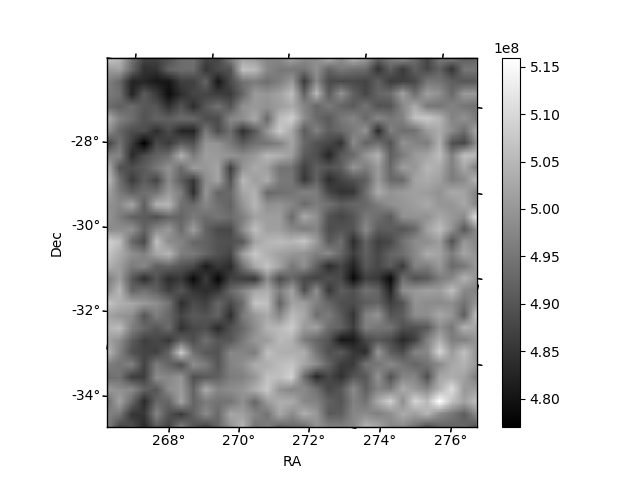
Histogram calculated using DETX and DETY for each event in the final _common_clean file
| Quadrant A | 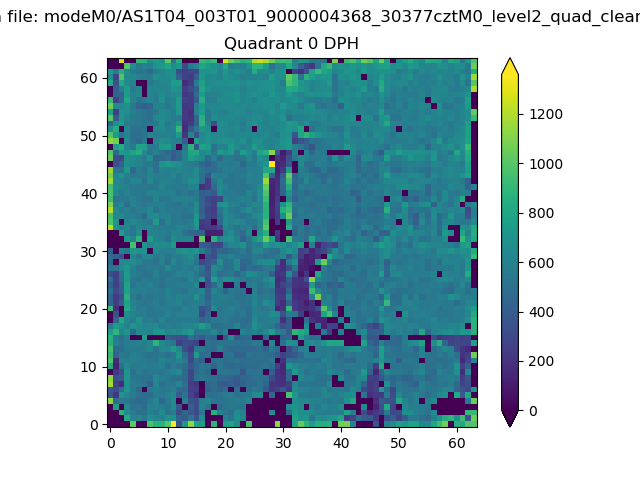 |
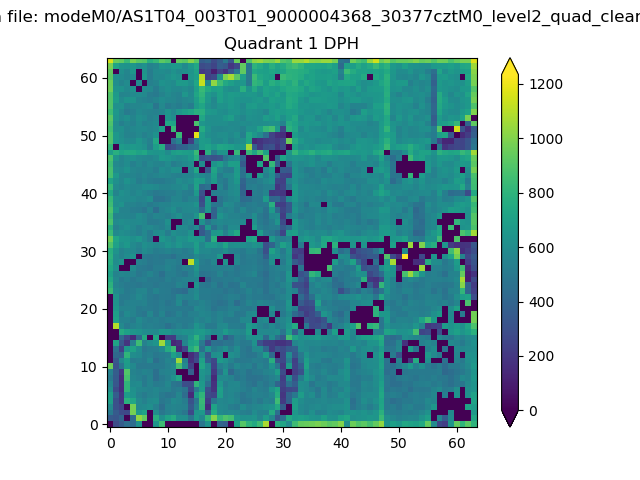 |
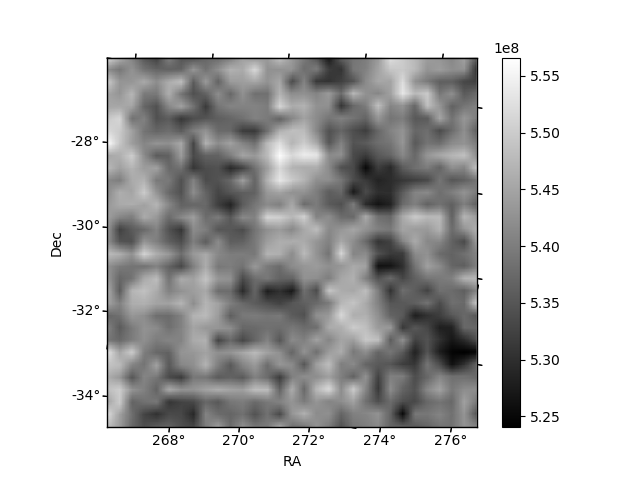
Quadrant B |
|---|---|---|---|
| Quadrant D | 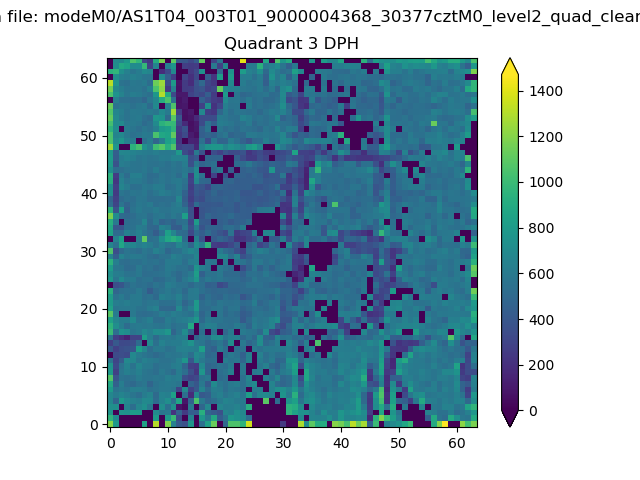 |
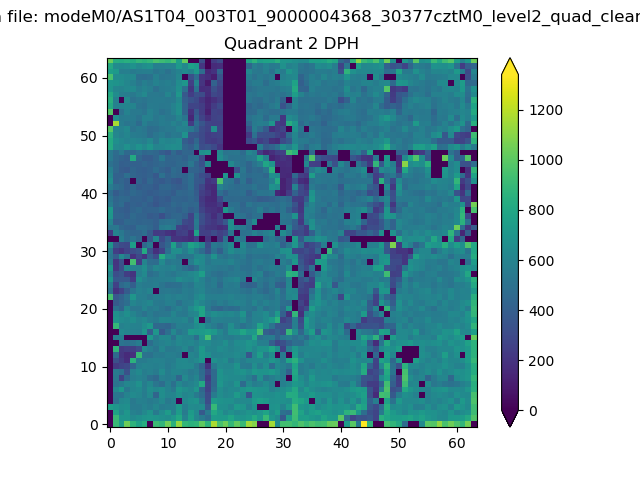 |
Quadrant C |
| Plot type | Count rate plots | Images |
|---|---|---|
| Comparison with Poisson distribution Blue bars denote a histogram of data divided into 1 sec bins. Red curve is a Poisson curve with rate = median count rate of data. |
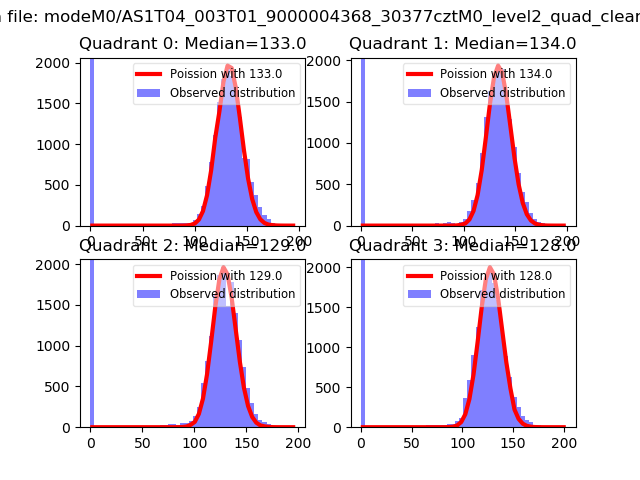 |
 |
| Quadrant-wise count rates Data is divided into 100 sec bins |
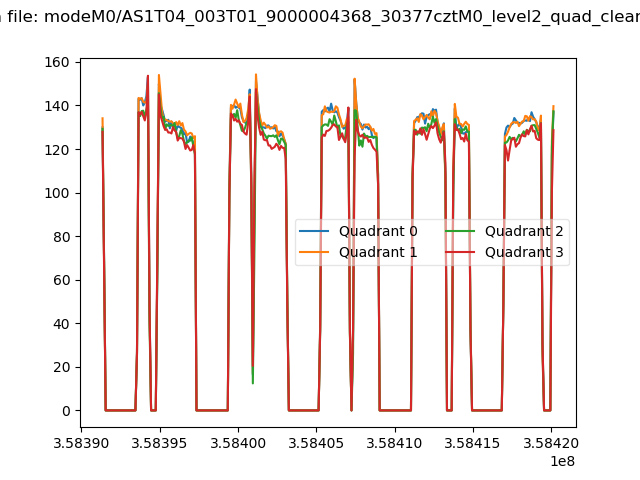 |
|
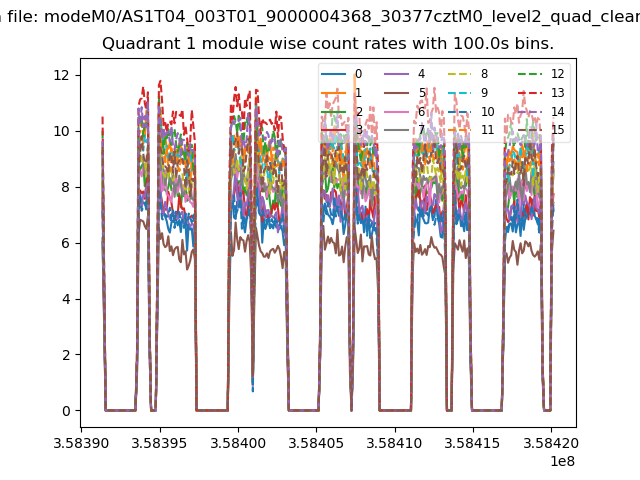
| Module-wise count rates for Quadrant A Data is divided into 100 sec bins |
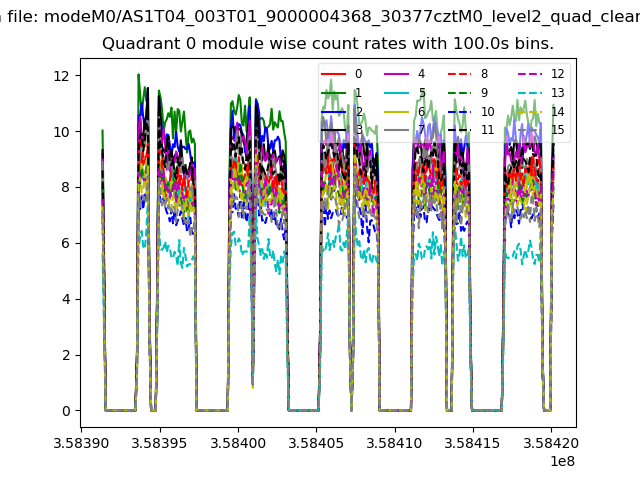 |
 |
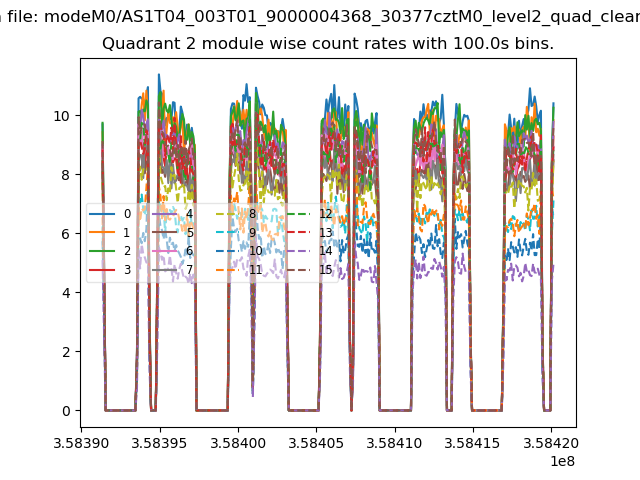
| Module-wise count rates for Quadrant B Data is divided into 100 sec bins |
 |
 |
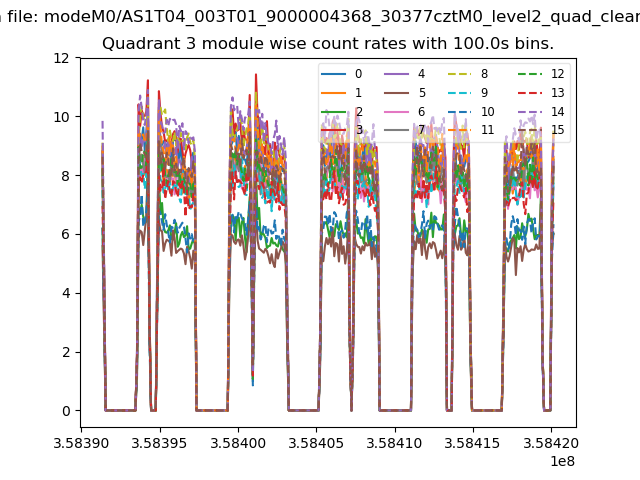
| Module-wise count rates for Quadrant C Data is divided into 100 sec bins |
 |
 |
| Module-wise count rates for Quadrant D Data is divided into 100 sec bins |
 |
 |
| Parameter | Plot |
|---|---|
| CZT HV Monitor | 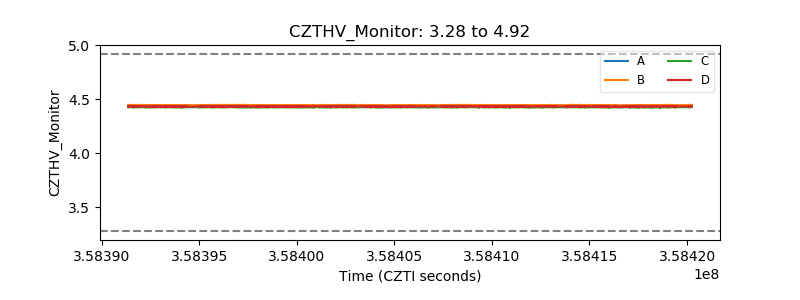 |
| D_VDD | 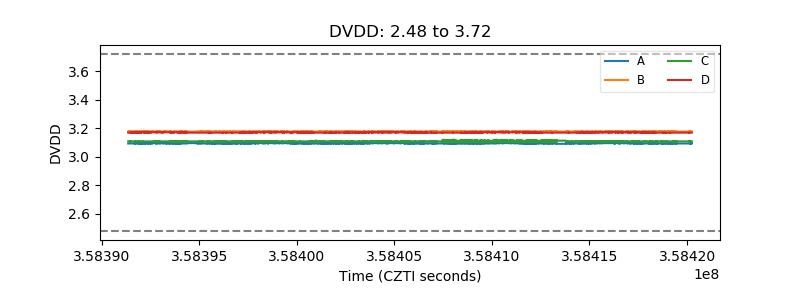 |
| Temperature 1 | 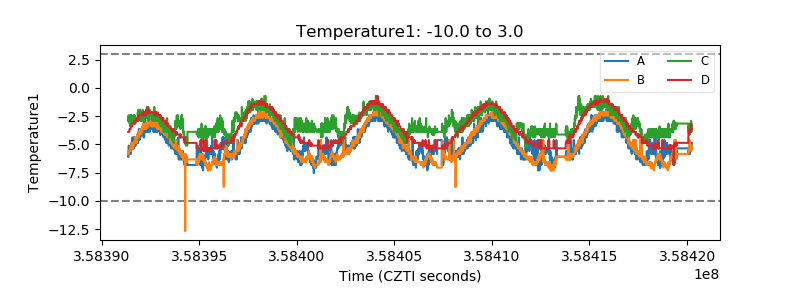 |
| Veto HV Monitor |  |
| Veto LLD | 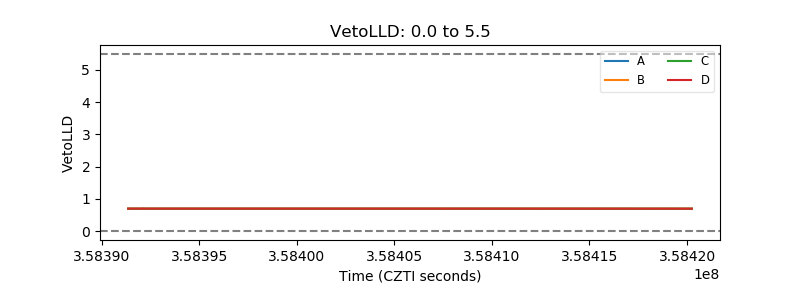 |
| Alpha Counter | 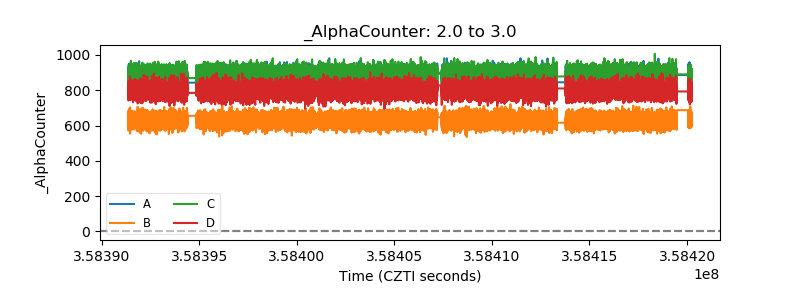 |
| _CPM_Rate | 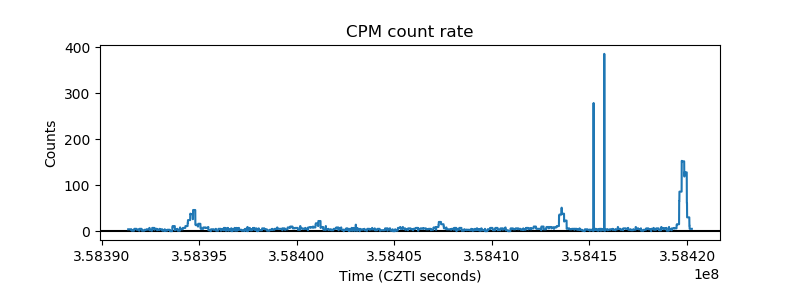 |
| CZT Counter | 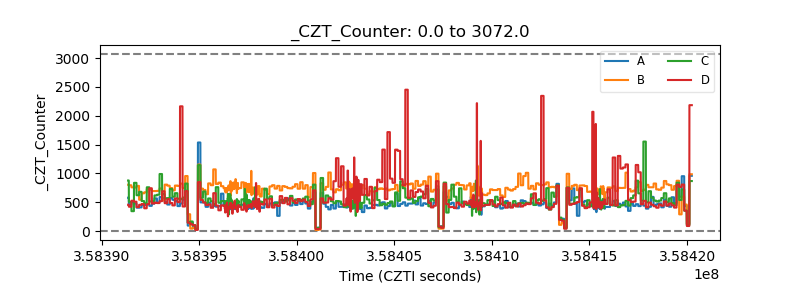 |
| +2.5 Volts monitor | 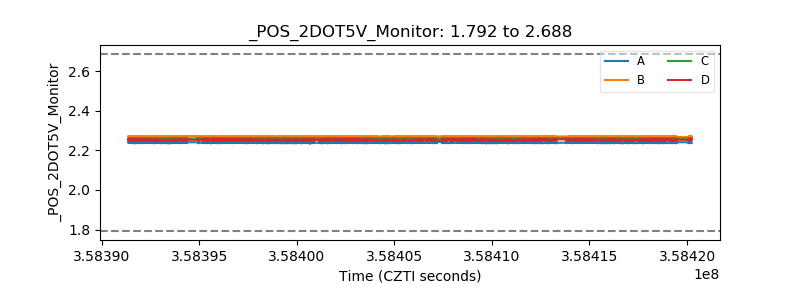 |
| +5 Volts monitor |  |
| _ROLL_ROT | 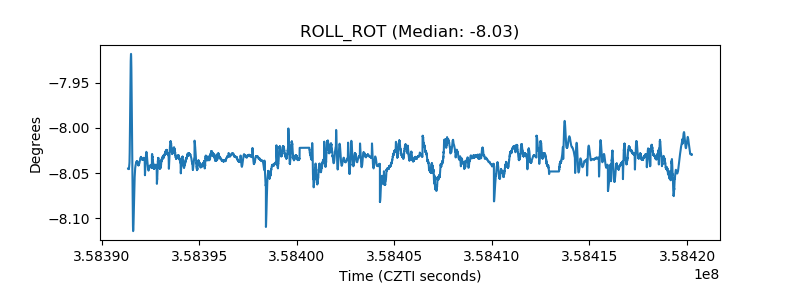 |
| _Roll_DEC | 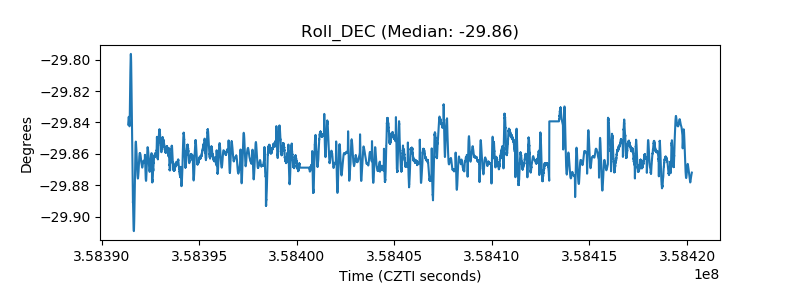 |
| _Roll_RA | 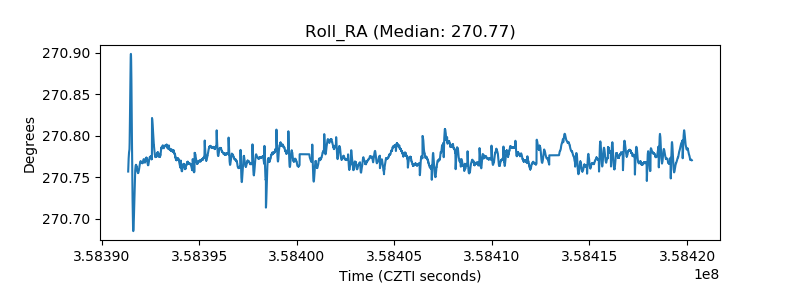 |
| Veto Counter | 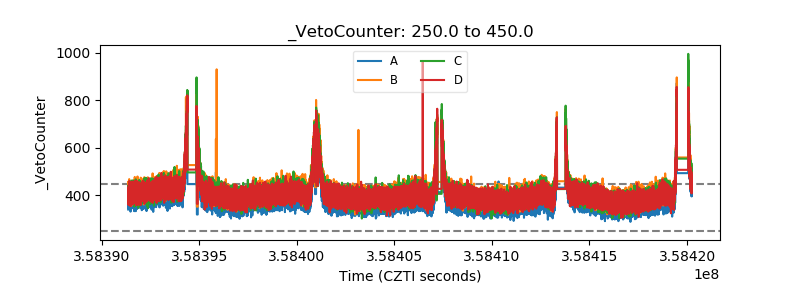 |