| Param | Original file | Final file |
|---|---|---|
| Filename | modeM0/AS1T04_003T01_9000004368_30378cztM0_level2.evt | modeM0/AS1T04_003T01_9000004368_30378cztM0_level2_quad_clean.evt |
| Size (bytes) | 744,442,560 | 109,249,920 |
| Size | 710.0 MB | 104.2 MB |
| Events in quadrant A | 4,434,490 | 672,014 |
| Events in quadrant B | 7,164,089 | 676,478 |
| Events in quadrant C | 4,696,623 | 657,137 |
| Events in quadrant D | 5,613,990 | 650,284 |
| Mode M0 | |||
|---|---|---|---|
| Quadrant | BADHDUFLAG | Total packets | Discarded packets |
| A | 0 | 19215 | 1 |
| B | 0 | 28594 | 1 |
| C | 0 | 19567 | 1 |
| D | 0 | 22824 | 1 |
| Mode SS | |||
|---|---|---|---|
| Quadrant | BADHDUFLAG | Total packets | Discarded packets |
| A | 0 | 190 | 0 |
| B | 0 | 190 | 0 |
| C | 0 | 190 | 0 |
| D | 0 | 190 | 0 |
| Mode M9 | |||
|---|---|---|---|
| Quadrant | BADHDUFLAG | Total packets | Discarded packets |
| A | 0 | 8 | 0 |
| B | 0 | 8 | 0 |
| C | 0 | 8 | 0 |
| D | 0 | 8 | 0 |
| Quadrant | Total seconds | Saturated seconds | Saturation percentage |
|---|---|---|---|
| A | 9410 | 87 | 0.924548% |
| B | 9410 | 152 | 1.615303% |
| C | 9410 | 149 | 1.583422% |
| D | 9411 | 181 | 1.923281% |
Noise dominated data is calculated using 1-second bins in cleaned event files. If a bin has >2000 counts, and if more than 50% of those come from <1% of pixels, then it is considered to be noise-dominated and hence unusable.
| Quadrant | # 1 sec bins | Bins with >0 counts | Bins with >2000 counts | High rate bins dominated by noise | Noise dominated (total time) | Noise dominated (detector-on time) | Marked lightcurve |
|---|---|---|---|---|---|---|---|
| A | 10175 | 9410 | 0 | 0 | 0.00% | 0.00% | 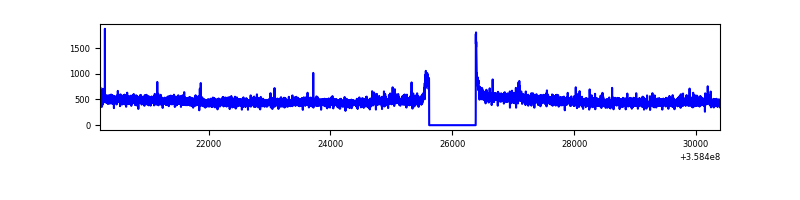 |
| B | 10175 | 9410 | 22 | 22 | 0.22% | 0.23% | 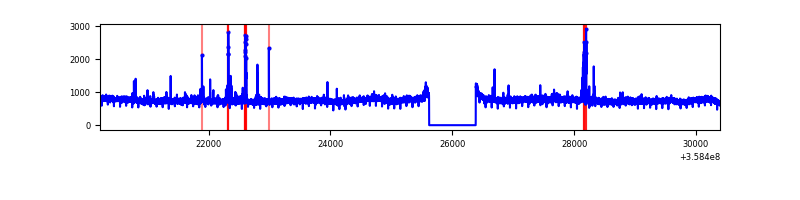 |
| C | 10175 | 9410 | 1 | 1 | 0.01% | 0.01% |  |
| D | 10176 | 9411 | 111 | 111 | 1.09% | 1.18% | 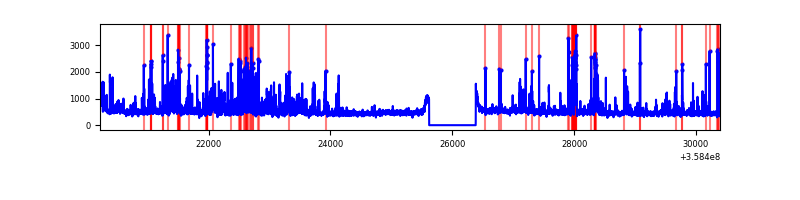 |
Top three noisy pixels from each quadrant. If the there are fewer than three noisy pixels in the level2.evt file, extra rows are filled as -1
| Pixel properties | Quadrant properties | ||||||
|---|---|---|---|---|---|---|---|
| Quadrant | DetID | PixID | Counts | Sigma | Mean | Median | Sigma |
| A | 14 | 239 | 20970 | 86.22 | 1138 | 1111 | 230.3 |
| A | 13 | 254 | 18196 | 74.18 | 1138 | 1111 | 230.3 |
| A | 3 | 137 | 11736 | 46.13 | 1138 | 1111 | 230.3 |
| B | 6 | 159 | 2577650 | 11951.34 | 1123 | 1095 | 215.6 |
| B | 6 | 36 | 45924 | 207.94 | 1123 | 1095 | 215.6 |
| B | 15 | 32 | 43821 | 198.18 | 1123 | 1095 | 215.6 |
| C | 3 | 233 | 216941 | 845.77 | 1091 | 1097 | 255.2 |
| C | 14 | 238 | 186212 | 725.36 | 1091 | 1097 | 255.2 |
| C | 2 | 114 | 22273 | 82.98 | 1091 | 1097 | 255.2 |
| D | 13 | 104 | 619205 | 2355.81 | 1099 | 1076 | 262.4 |
| D | 2 | 250 | 304506 | 1156.43 | 1099 | 1076 | 262.4 |
| D | 8 | 195 | 159692 | 604.52 | 1099 | 1076 | 262.4 |
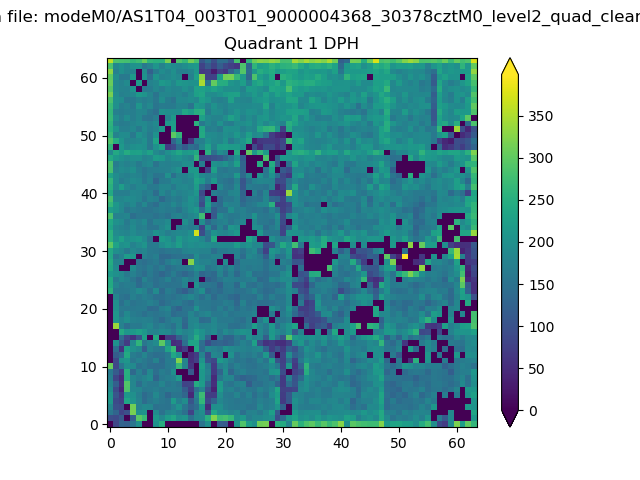
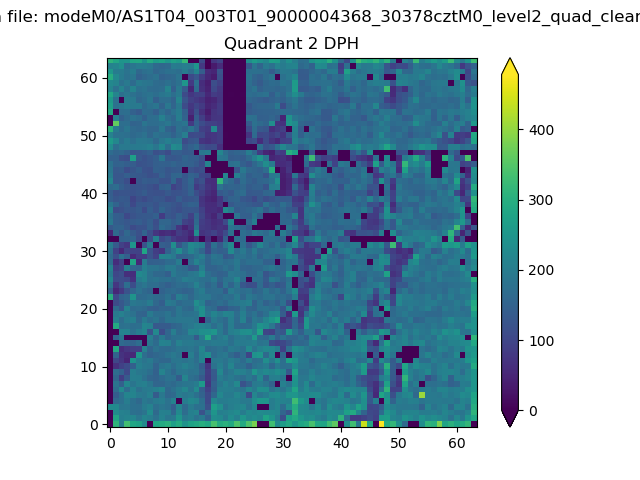
Histogram calculated using DETX and DETY for each event in the final _common_clean file
| Quadrant A | 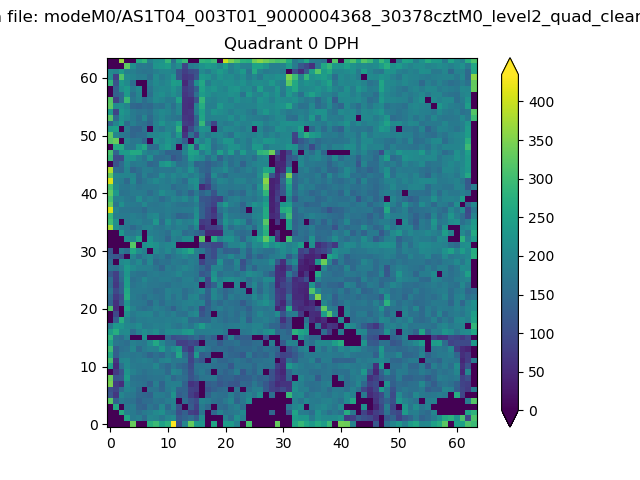 |
 |
Quadrant B |
|---|---|---|---|
| Quadrant D | 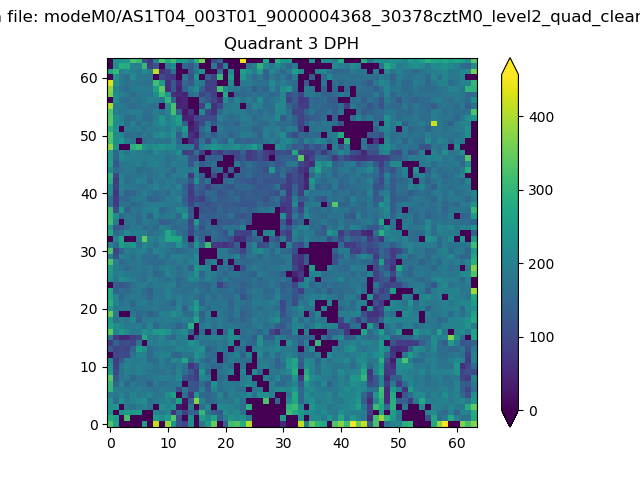 |
 |
Quadrant C |
| Plot type | Count rate plots | Images |
|---|---|---|
| Comparison with Poisson distribution Blue bars denote a histogram of data divided into 1 sec bins. Red curve is a Poisson curve with rate = median count rate of data. |
 |
 |
| Quadrant-wise count rates Data is divided into 100 sec bins |
 |
|
| Module-wise count rates for Quadrant A Data is divided into 100 sec bins |
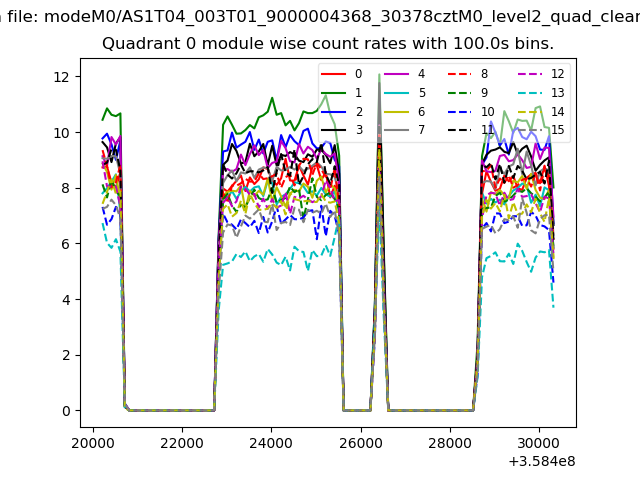 |
 |
| Module-wise count rates for Quadrant B Data is divided into 100 sec bins |
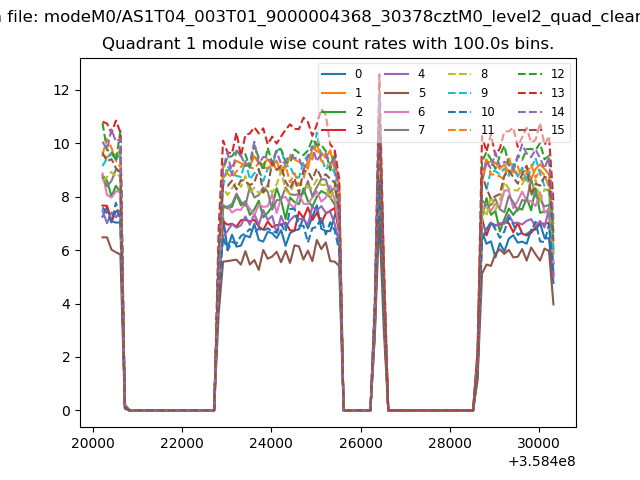 |
 |
| Module-wise count rates for Quadrant C Data is divided into 100 sec bins |
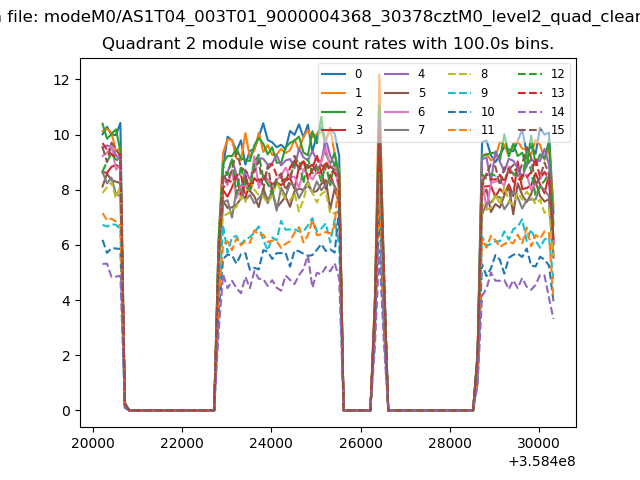 |
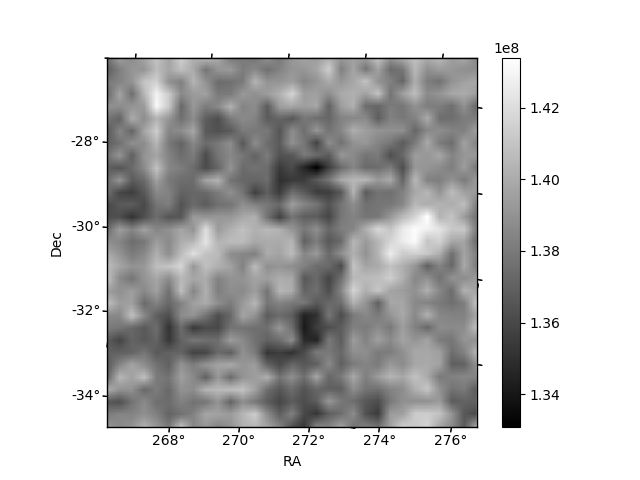 |
| Module-wise count rates for Quadrant D Data is divided into 100 sec bins |
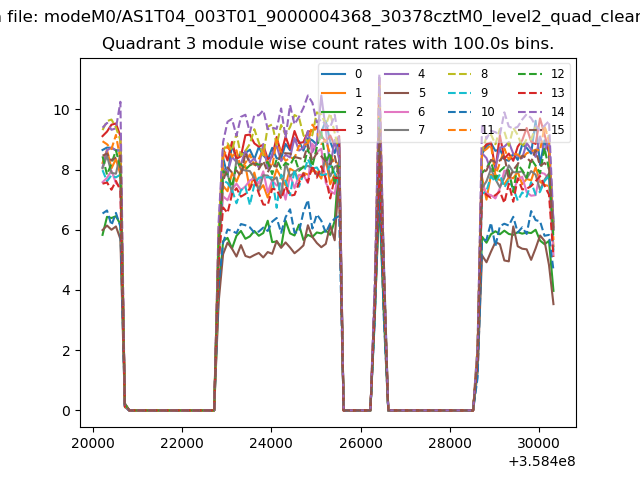 |
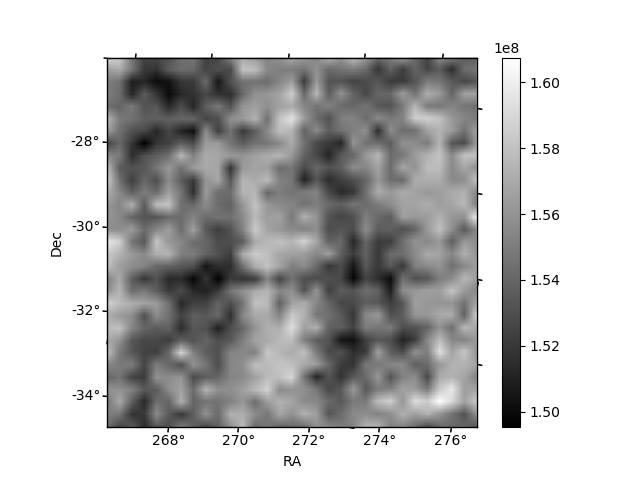 |
| Parameter | Plot |
|---|---|
| CZT HV Monitor | 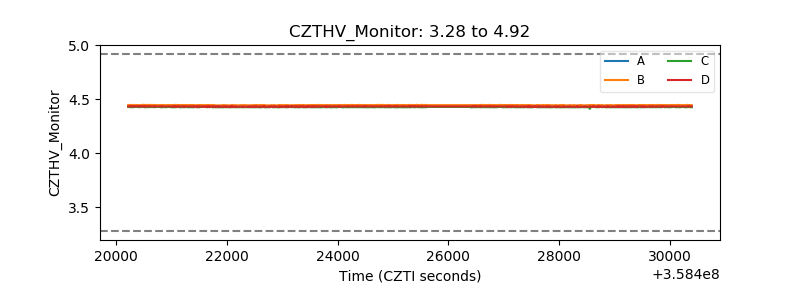 |
| D_VDD |  |
| Temperature 1 | 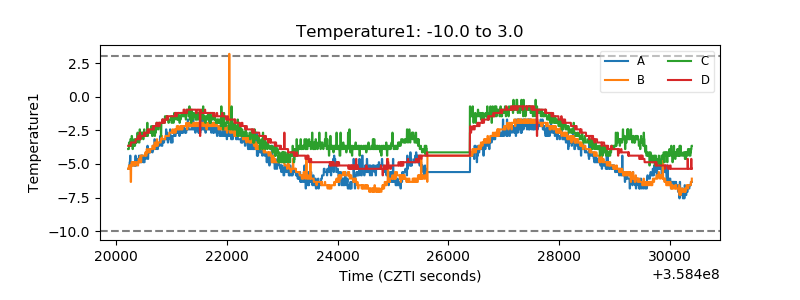 |
| Veto HV Monitor | 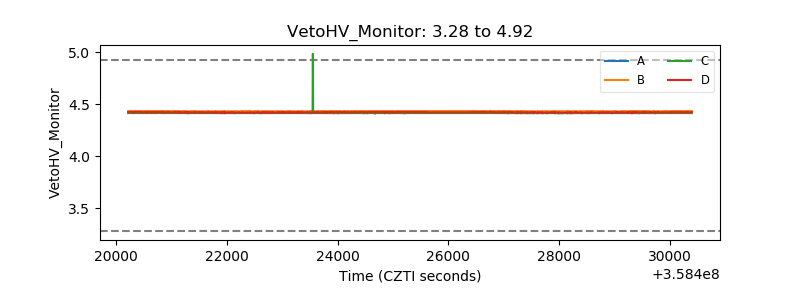 |
| Veto LLD | 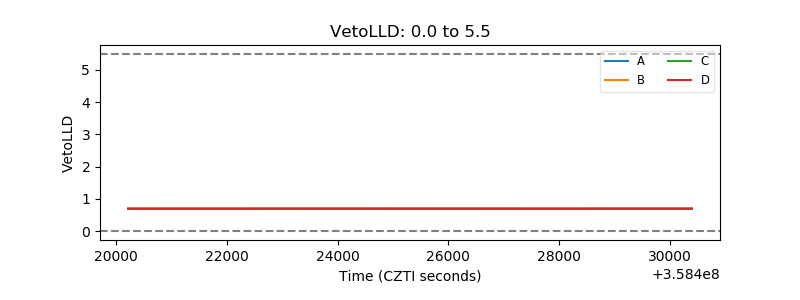 |
| Alpha Counter |  |
| _CPM_Rate |  |
| CZT Counter | 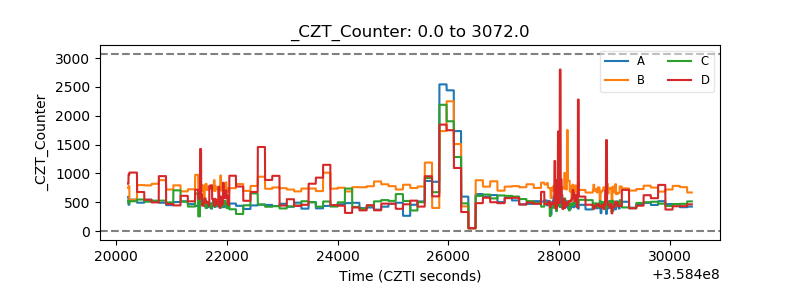 |
| +2.5 Volts monitor |  |
| +5 Volts monitor |  |
| _ROLL_ROT | 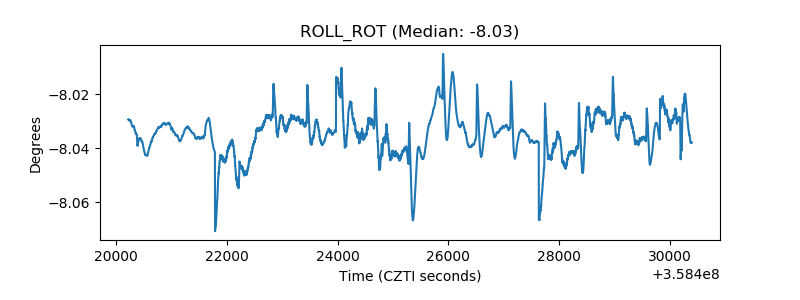 |
| _Roll_DEC | 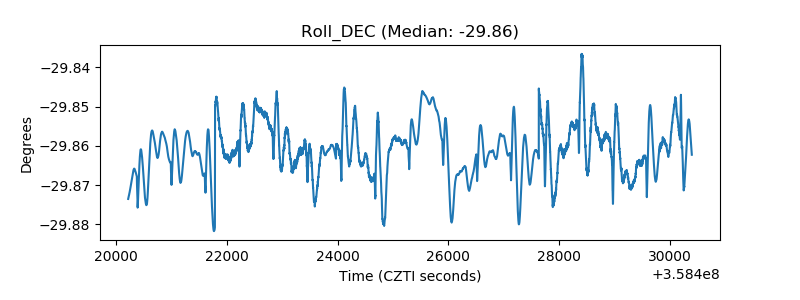 |
| _Roll_RA | 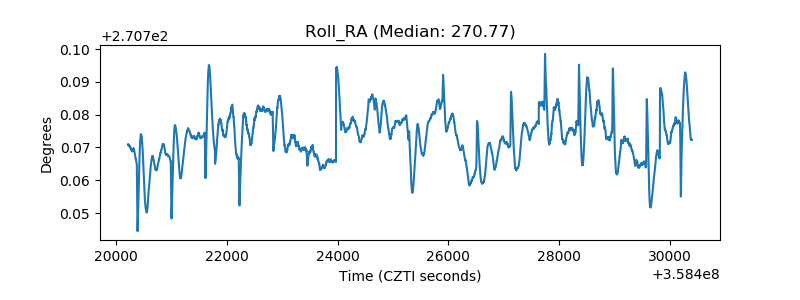 |
| Veto Counter | 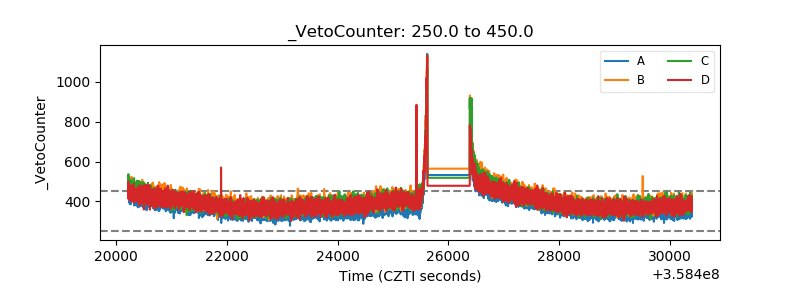 |