| Param | Original file | Final file |
|---|---|---|
| Filename | modeM0/AS1T04_006T01_9000004370_30380cztM0_level2.evt | modeM0/AS1T04_006T01_9000004370_30380cztM0_level2_quad_clean.evt |
| Size (bytes) | 606,467,520 | 72,823,680 |
| Size | 578.4 MB | 69.5 MB |
| Events in quadrant A | 4,927,130 | 439,452 |
| Events in quadrant B | 5,292,993 | 448,041 |
| Events in quadrant C | 3,449,835 | 433,474 |
| Events in quadrant D | 4,256,174 | 429,515 |
| Mode M9 | |||
|---|---|---|---|
| Quadrant | BADHDUFLAG | Total packets | Discarded packets |
| A | 0 | 16 | 0 |
| B | 0 | 17 | 0 |
| C | 0 | 17 | 0 |
| D | 0 | 17 | 0 |
| Mode M0 | |||
|---|---|---|---|
| Quadrant | BADHDUFLAG | Total packets | Discarded packets |
| A | 0 | 18955 | 2 |
| B | 0 | 20295 | 2 |
| C | 0 | 14167 | 2 |
| D | 0 | 16949 | 2 |
| Mode SS | |||
|---|---|---|---|
| Quadrant | BADHDUFLAG | Total packets | Discarded packets |
| A | 0 | 132 | 0 |
| B | 0 | 132 | 0 |
| C | 0 | 132 | 0 |
| D | 0 | 132 | 0 |
| Quadrant | Total seconds | Saturated seconds | Saturation percentage |
|---|---|---|---|
| A | 6518 | 512 | 7.855170% |
| B | 6517 | 139 | 2.132883% |
| C | 6517 | 120 | 1.841338% |
| D | 6517 | 173 | 2.654596% |
Noise dominated data is calculated using 1-second bins in cleaned event files. If a bin has >2000 counts, and if more than 50% of those come from <1% of pixels, then it is considered to be noise-dominated and hence unusable.
| Quadrant | # 1 sec bins | Bins with >0 counts | Bins with >2000 counts | High rate bins dominated by noise | Noise dominated (total time) | Noise dominated (detector-on time) | Marked lightcurve |
|---|---|---|---|---|---|---|---|
| A | 7623 | 6518 | 410 | 410 | 5.38% | 6.29% | 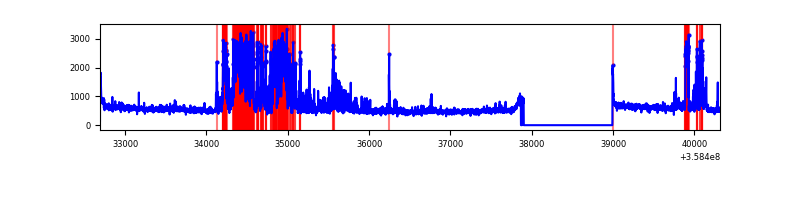 |
| B | 7622 | 6517 | 5 | 5 | 0.07% | 0.08% | 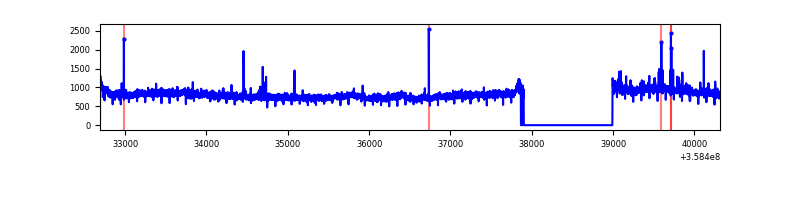 |
| C | 7622 | 6517 | 0 | 0 | 0.00% | 0.00% | 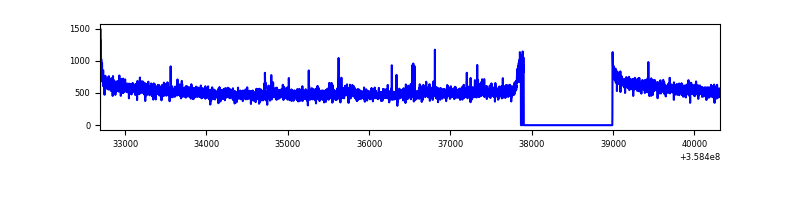 |
| D | 7622 | 6517 | 114 | 114 | 1.50% | 1.75% | 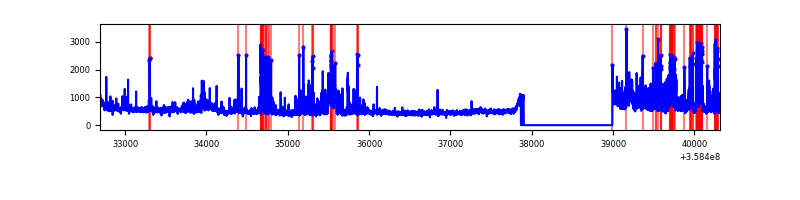 |
Top three noisy pixels from each quadrant. If the there are fewer than three noisy pixels in the level2.evt file, extra rows are filled as -1
| Pixel properties | Quadrant properties | ||||||
|---|---|---|---|---|---|---|---|
| Quadrant | DetID | PixID | Counts | Sigma | Mean | Median | Sigma |
| A | 14 | 239 | 1669726 | 10089.93 | 835 | 820 | 165.4 |
| A | 8 | 192 | 27346 | 160.37 | 835 | 820 | 165.4 |
| A | 13 | 254 | 13346 | 75.73 | 835 | 820 | 165.4 |
| B | 6 | 159 | 1862666 | 11638.71 | 845 | 827 | 160.0 |
| B | 0 | 190 | 46622 | 286.27 | 845 | 827 | 160.0 |
| B | 5 | 255 | 25996 | 157.34 | 845 | 827 | 160.0 |
| C | 14 | 238 | 142080 | 746.72 | 813 | 819 | 189.2 |
| C | 3 | 233 | 102007 | 534.89 | 813 | 819 | 189.2 |
| C | 14 | 254 | 16475 | 82.76 | 813 | 819 | 189.2 |
| D | 2 | 250 | 359507 | 1863.74 | 816 | 796 | 192.5 |
| D | 13 | 104 | 340607 | 1765.55 | 816 | 796 | 192.5 |
| D | 8 | 195 | 173269 | 896.11 | 816 | 796 | 192.5 |
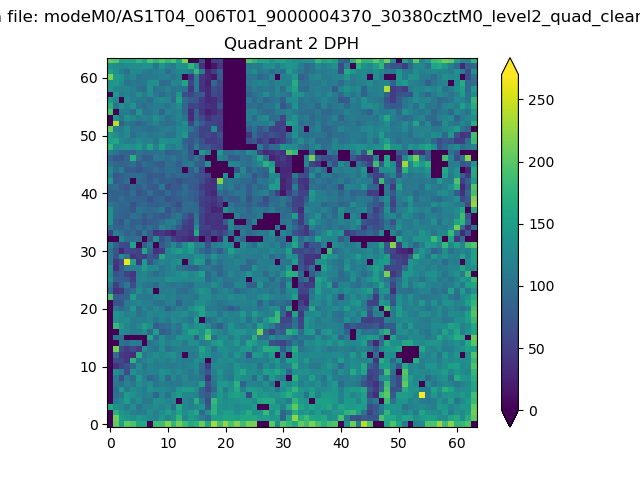
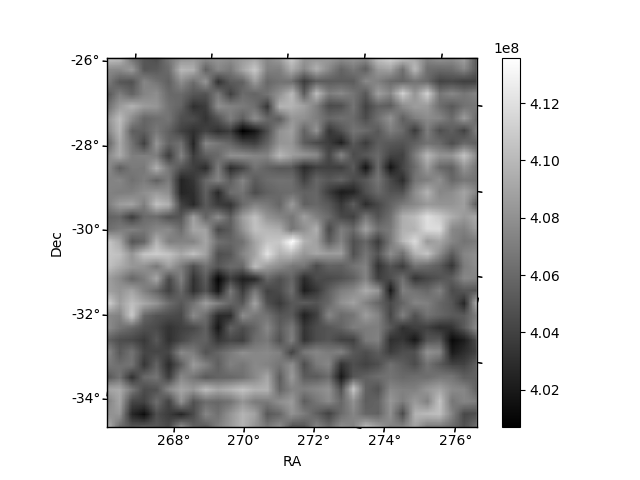
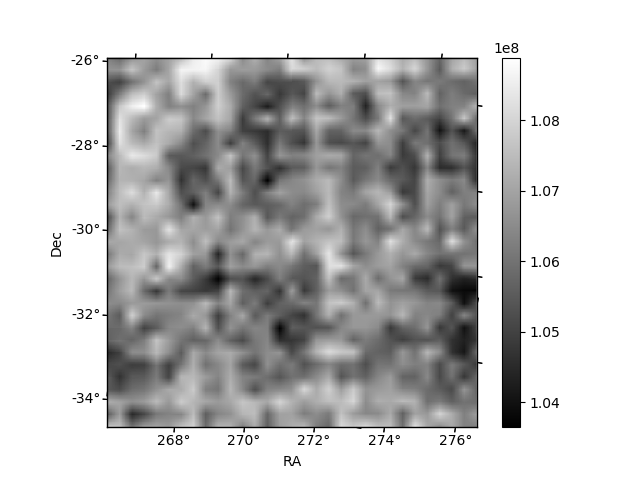
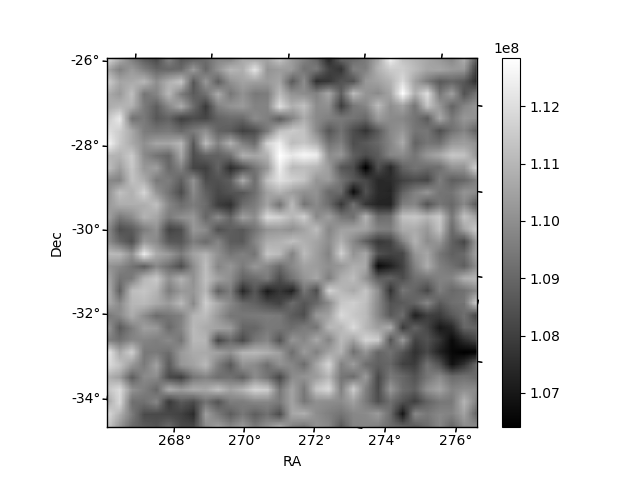
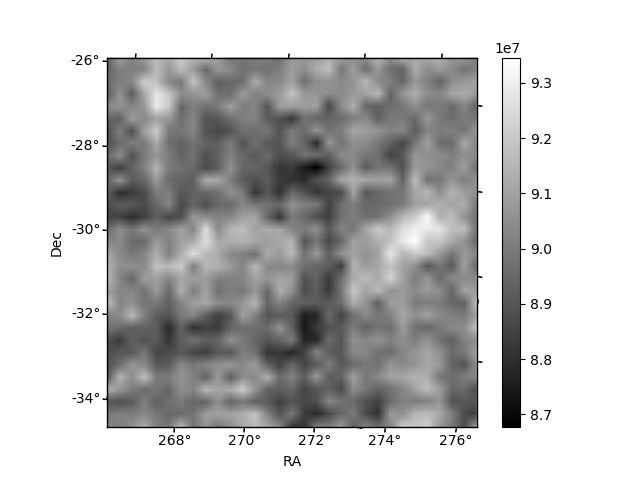
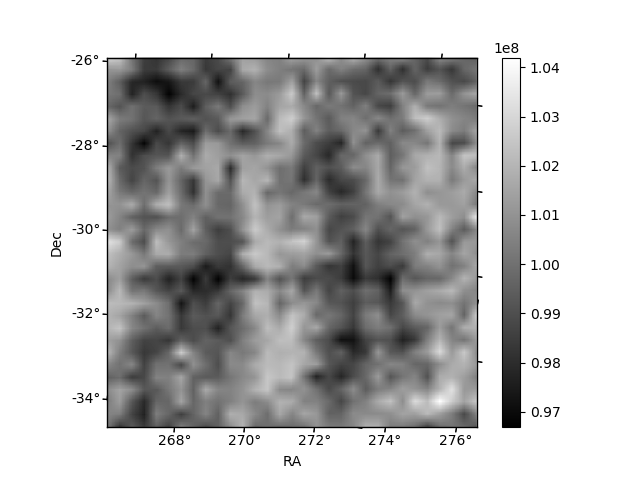
Histogram calculated using DETX and DETY for each event in the final _common_clean file
| Quadrant A | 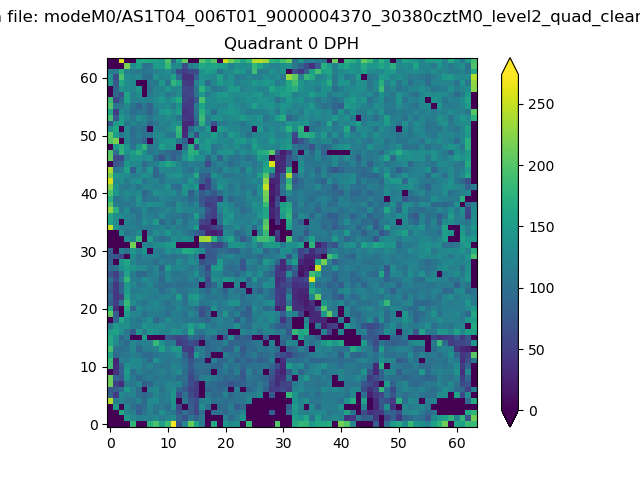 |
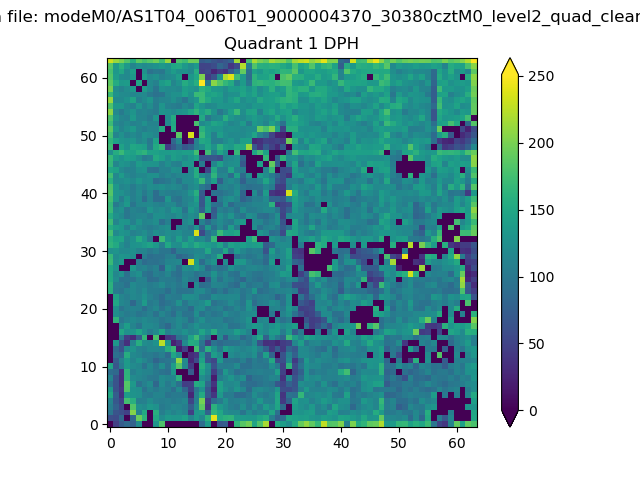 |
Quadrant B |
|---|---|---|---|
| Quadrant D | 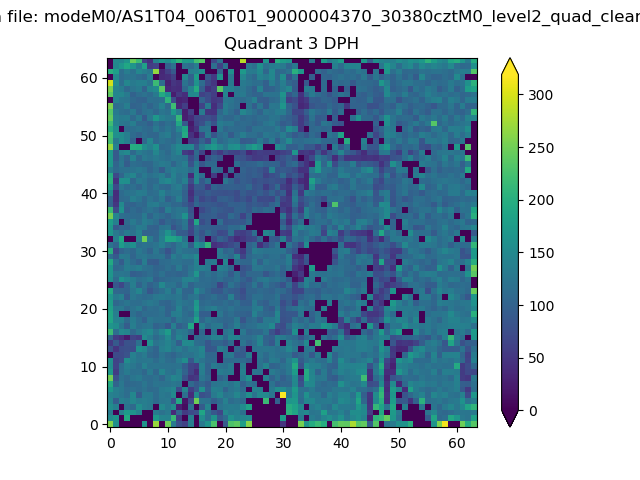 |
 |
Quadrant C |
| Plot type | Count rate plots | Images |
|---|---|---|
| Comparison with Poisson distribution Blue bars denote a histogram of data divided into 1 sec bins. Red curve is a Poisson curve with rate = median count rate of data. |
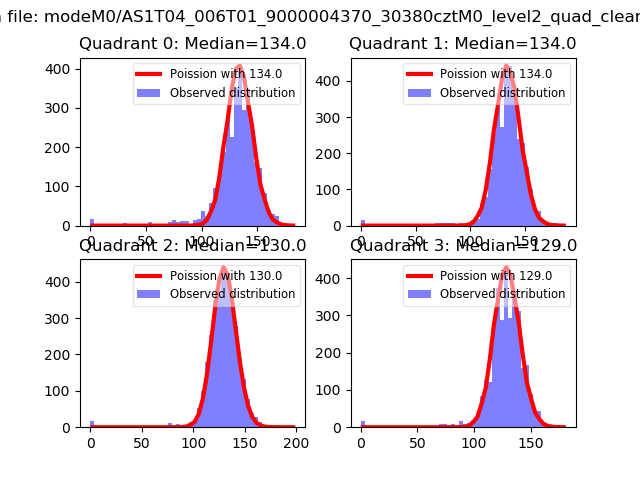 |
 |
| Quadrant-wise count rates Data is divided into 100 sec bins |
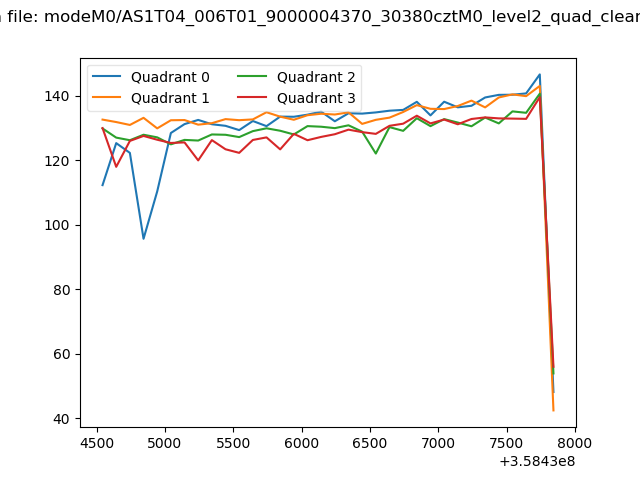 |
|
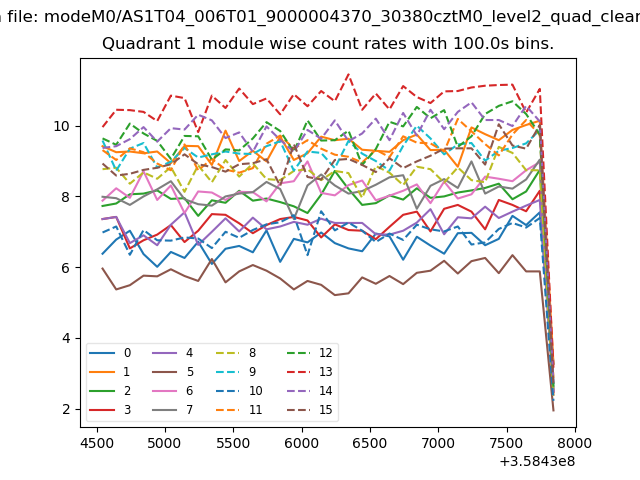
| Module-wise count rates for Quadrant A Data is divided into 100 sec bins |
 |
 |
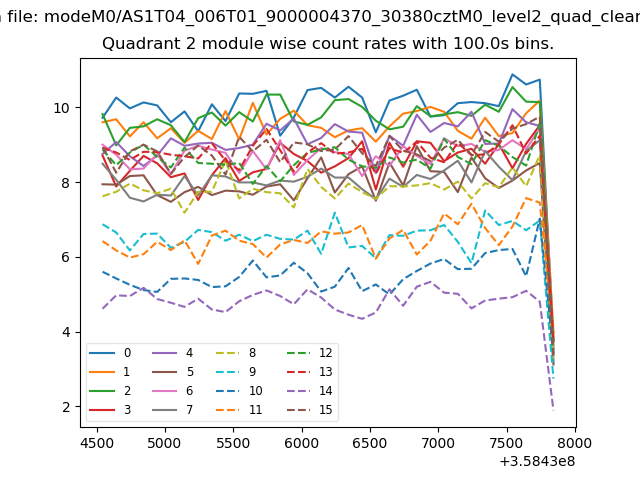
| Module-wise count rates for Quadrant B Data is divided into 100 sec bins |
 |
 |
| Module-wise count rates for Quadrant C Data is divided into 100 sec bins |
 |
 |
| Module-wise count rates for Quadrant D Data is divided into 100 sec bins |
 |
 |
| Parameter | Plot |
|---|---|
| CZT HV Monitor | 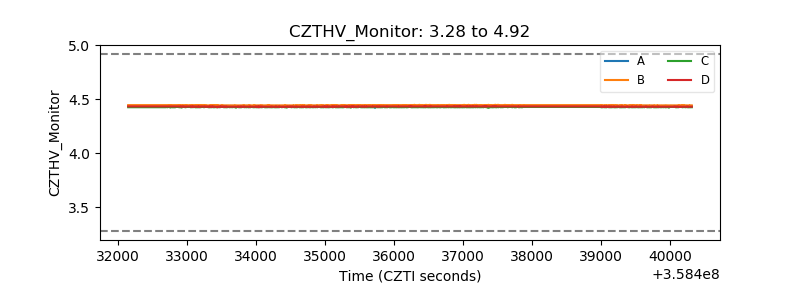 |
| D_VDD | 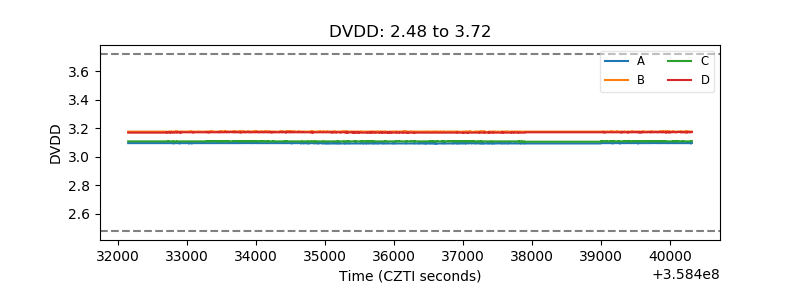 |
| Temperature 1 |  |
| Veto HV Monitor | 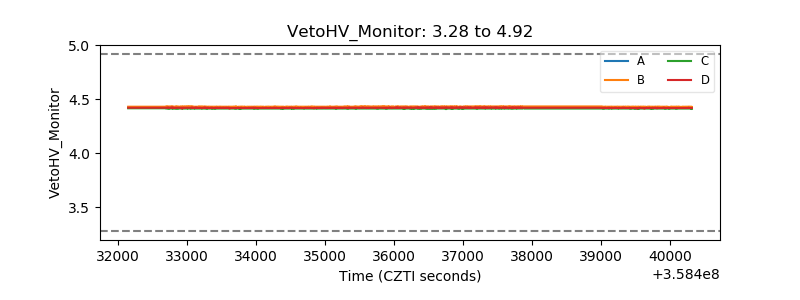 |
| Veto LLD | 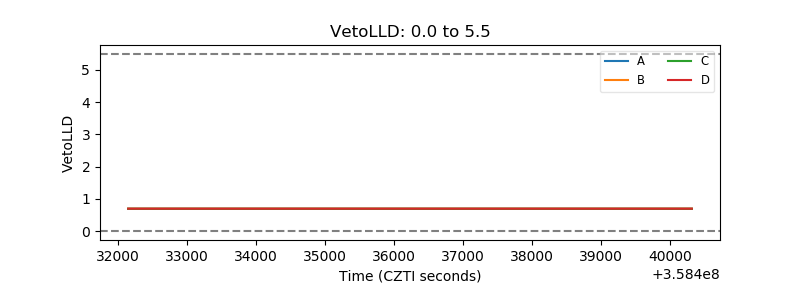 |
| Alpha Counter | 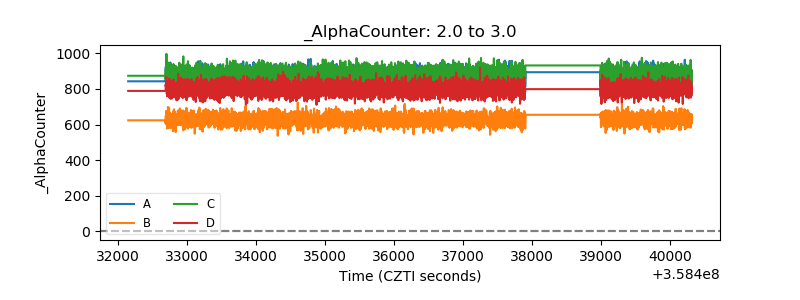 |
| _CPM_Rate | 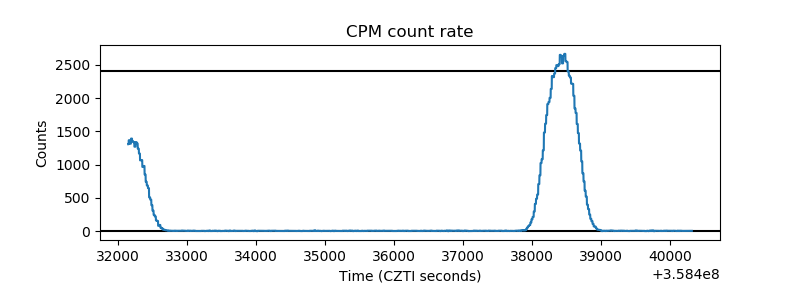 |
| CZT Counter | 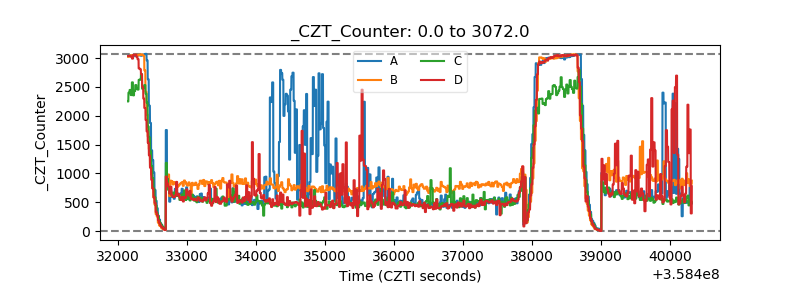 |
| +2.5 Volts monitor |  |
| +5 Volts monitor |  |
| _ROLL_ROT | 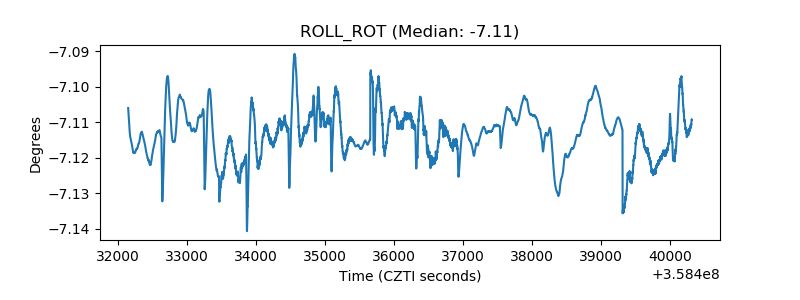 |
| _Roll_DEC |  |
| _Roll_RA | 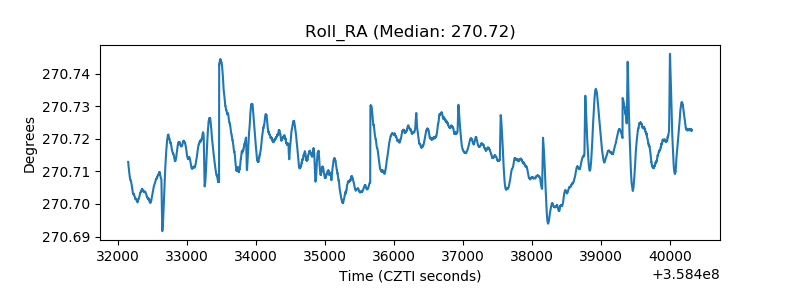 |
| Veto Counter | 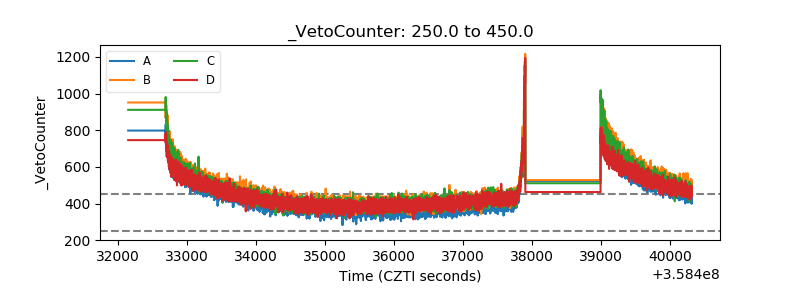 |