| Param | Original file | Final file |
|---|---|---|
| Filename | modeM0/AS1T04_006T01_9000004370_30381cztM0_level2.evt | modeM0/AS1T04_006T01_9000004370_30381cztM0_level2_quad_clean.evt |
| Size (bytes) | 584,095,680 | 88,793,280 |
| Size | 557.0 MB | 84.7 MB |
| Events in quadrant A | 3,672,319 | 575,374 |
| Events in quadrant B | 5,788,507 | 572,744 |
| Events in quadrant C | 3,451,076 | 550,955 |
| Events in quadrant D | 4,344,669 | 543,670 |
| Mode M9 | |||
|---|---|---|---|
| Quadrant | BADHDUFLAG | Total packets | Discarded packets |
| A | 0 | 21 | 0 |
| B | 0 | 22 | 0 |
| C | 0 | 22 | 0 |
| D | 0 | 22 | 0 |
| Mode M0 | |||
|---|---|---|---|
| Quadrant | BADHDUFLAG | Total packets | Discarded packets |
| A | 0 | 15194 | 2 |
| B | 0 | 21587 | 2 |
| C | 0 | 14229 | 2 |
| D | 0 | 17112 | 2 |
| Mode SS | |||
|---|---|---|---|
| Quadrant | BADHDUFLAG | Total packets | Discarded packets |
| A | 0 | 130 | 0 |
| B | 0 | 130 | 0 |
| C | 0 | 130 | 0 |
| D | 0 | 130 | 0 |
| Quadrant | Total seconds | Saturated seconds | Saturation percentage |
|---|---|---|---|
| A | 6395 | 160 | 2.501955% |
| B | 6395 | 362 | 5.660672% |
| C | 6395 | 129 | 2.017201% |
| D | 6395 | 237 | 3.706020% |
Noise dominated data is calculated using 1-second bins in cleaned event files. If a bin has >2000 counts, and if more than 50% of those come from <1% of pixels, then it is considered to be noise-dominated and hence unusable.
| Quadrant | # 1 sec bins | Bins with >0 counts | Bins with >2000 counts | High rate bins dominated by noise | Noise dominated (total time) | Noise dominated (detector-on time) | Marked lightcurve |
|---|---|---|---|---|---|---|---|
| A | 7585 | 6395 | 58 | 58 | 0.76% | 0.91% | 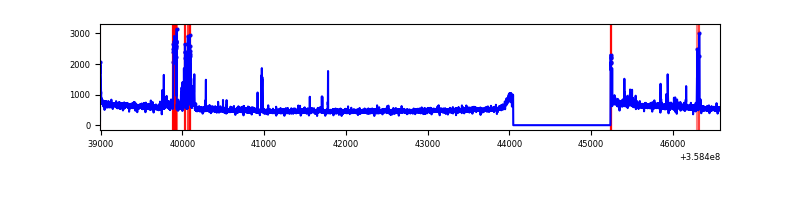 |
| B | 7585 | 6395 | 82 | 82 | 1.08% | 1.28% | 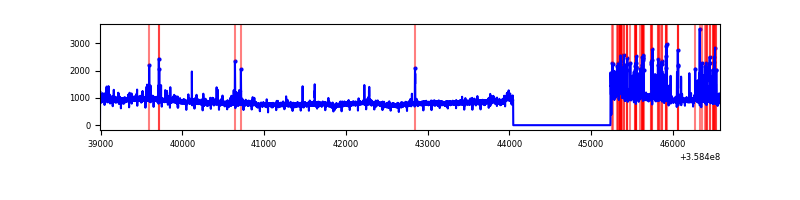 |
| C | 7585 | 6395 | 0 | 0 | 0.00% | 0.00% | 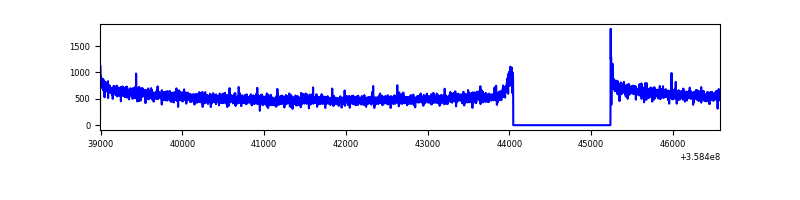 |
| D | 7585 | 6395 | 168 | 168 | 2.21% | 2.63% | 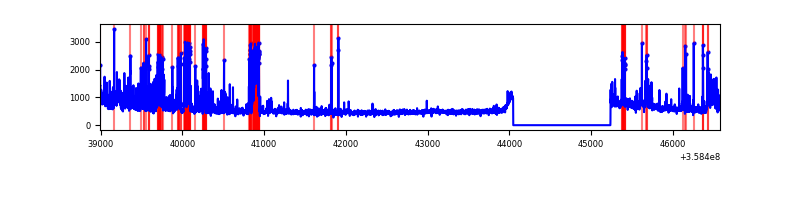 |
Top three noisy pixels from each quadrant. If the there are fewer than three noisy pixels in the level2.evt file, extra rows are filled as -1
| Pixel properties | Quadrant properties | ||||||
|---|---|---|---|---|---|---|---|
| Quadrant | DetID | PixID | Counts | Sigma | Mean | Median | Sigma |
| A | 14 | 239 | 244078 | 1398.16 | 871 | 859 | 174.0 |
| A | 8 | 192 | 27779 | 154.75 | 871 | 859 | 174.0 |
| A | 12 | 96 | 17607 | 96.28 | 871 | 859 | 174.0 |
| B | 6 | 159 | 1902834 | 11765.3 | 856 | 837 | 161.7 |
| B | 5 | 255 | 350597 | 2163.53 | 856 | 837 | 161.7 |
| B | 0 | 190 | 57944 | 353.25 | 856 | 837 | 161.7 |
| C | 14 | 238 | 138408 | 720.72 | 829 | 839 | 190.9 |
| C | 3 | 233 | 56134 | 289.69 | 829 | 839 | 190.9 |
| C | 2 | 114 | 15540 | 77.02 | 829 | 839 | 190.9 |
| D | 13 | 104 | 440204 | 2274.63 | 825 | 808 | 193.2 |
| D | 13 | 138 | 243637 | 1257.06 | 825 | 808 | 193.2 |
| D | 8 | 195 | 175258 | 903.08 | 825 | 808 | 193.2 |
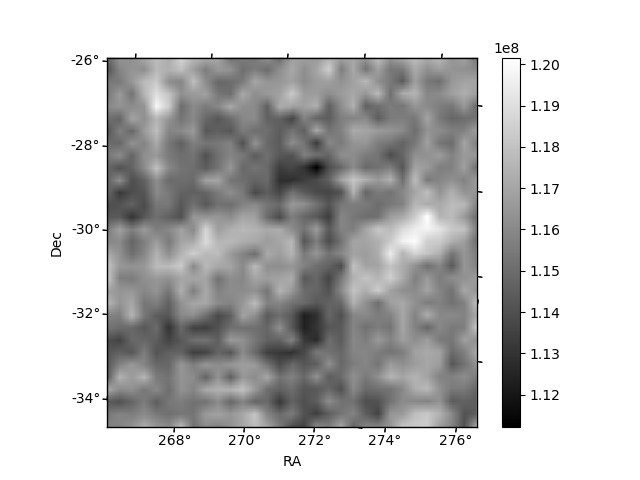
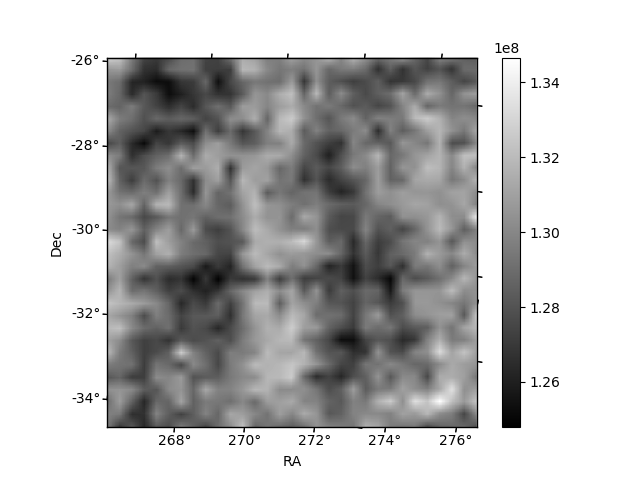
Histogram calculated using DETX and DETY for each event in the final _common_clean file
| Quadrant A |  |
 |
Quadrant B |
|---|---|---|---|
| Quadrant D |  |
 |
Quadrant C |
| Plot type | Count rate plots | Images |
|---|---|---|
| Comparison with Poisson distribution Blue bars denote a histogram of data divided into 1 sec bins. Red curve is a Poisson curve with rate = median count rate of data. |
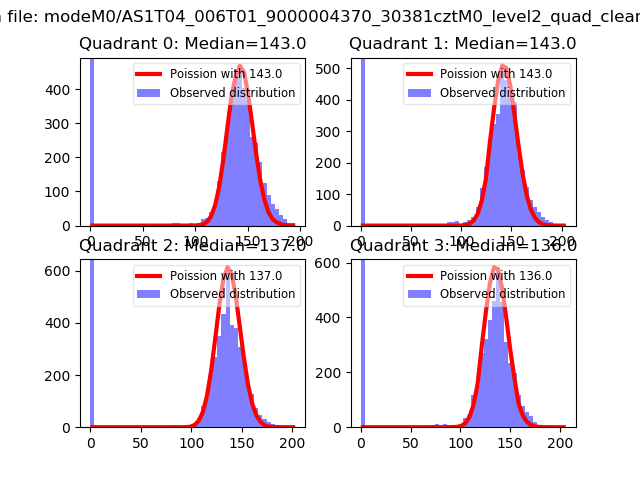 |
 |
| Quadrant-wise count rates Data is divided into 100 sec bins |
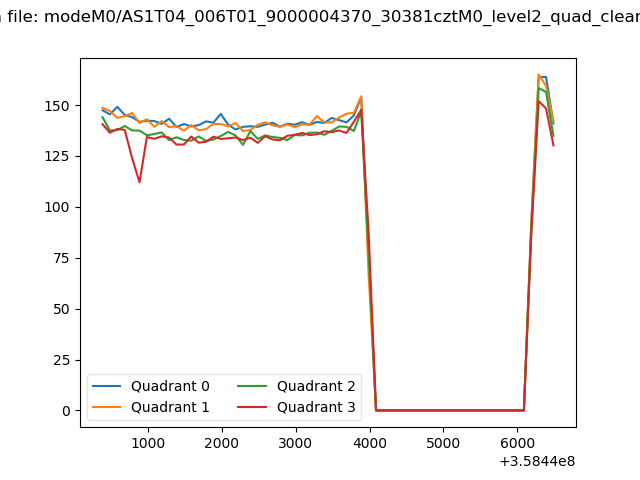 |
|
| Module-wise count rates for Quadrant A Data is divided into 100 sec bins |
 |
 |
| Module-wise count rates for Quadrant B Data is divided into 100 sec bins |
 |
 |
| Module-wise count rates for Quadrant C Data is divided into 100 sec bins |
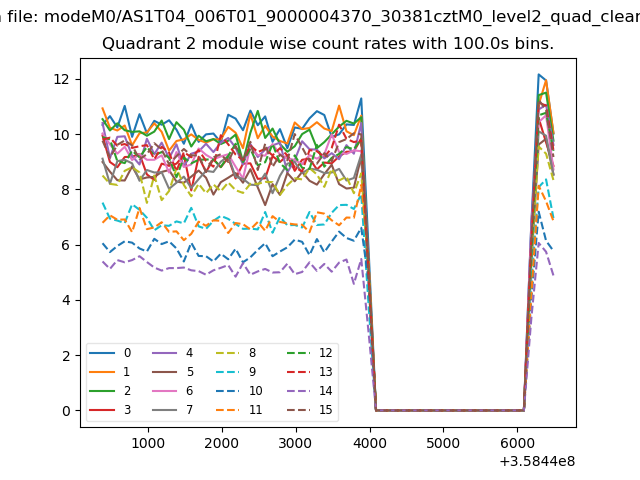 |
 |
| Module-wise count rates for Quadrant D Data is divided into 100 sec bins |
 |
 |
| Parameter | Plot |
|---|---|
| CZT HV Monitor |  |
| D_VDD |  |
| Temperature 1 |  |
| Veto HV Monitor |  |
| Veto LLD |  |
| Alpha Counter | 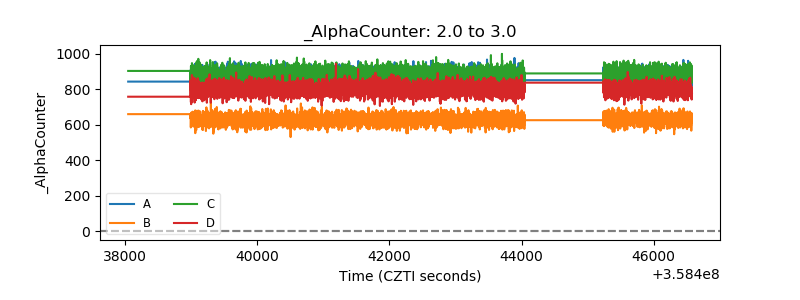 |
| _CPM_Rate | 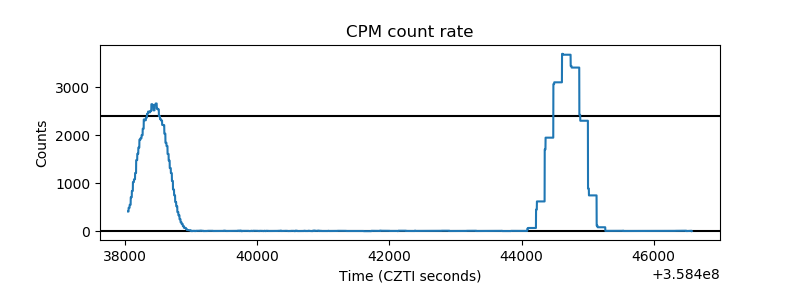 |
| CZT Counter |  |
| +2.5 Volts monitor |  |
| +5 Volts monitor |  |
| _ROLL_ROT |  |
| _Roll_DEC |  |
| _Roll_RA |  |
| Veto Counter |  |