| Param | Original file | Final file |
|---|---|---|
| Filename | modeM0/AS1T04_006T01_9000004370_30383cztM0_level2.evt | modeM0/AS1T04_006T01_9000004370_30383cztM0_level2_quad_clean.evt |
| Size (bytes) | 597,913,920 | 113,397,120 |
| Size | 570.2 MB | 108.1 MB |
| Events in quadrant A | 3,693,419 | 762,010 |
| Events in quadrant B | 5,587,850 | 778,326 |
| Events in quadrant C | 3,587,118 | 739,979 |
| Events in quadrant D | 4,800,779 | 701,672 |
| Mode M9 | |||
|---|---|---|---|
| Quadrant | BADHDUFLAG | Total packets | Discarded packets |
| A | 0 | 26 | 0 |
| B | 0 | 26 | 0 |
| C | 0 | 26 | 0 |
| D | 0 | 26 | 0 |
| Mode M0 | |||
|---|---|---|---|
| Quadrant | BADHDUFLAG | Total packets | Discarded packets |
| A | 0 | 15047 | 2 |
| B | 0 | 20735 | 2 |
| C | 0 | 14659 | 2 |
| D | 0 | 18645 | 4 |
| Mode SS | |||
|---|---|---|---|
| Quadrant | BADHDUFLAG | Total packets | Discarded packets |
| A | 0 | 136 | 0 |
| B | 0 | 136 | 0 |
| C | 0 | 136 | 0 |
| D | 0 | 136 | 0 |
| Quadrant | Total seconds | Saturated seconds | Saturation percentage |
|---|---|---|---|
| A | 6480 | 137 | 2.114198% |
| B | 6480 | 181 | 2.793210% |
| C | 6480 | 114 | 1.759259% |
| D | 6480 | 419 | 6.466049% |
Noise dominated data is calculated using 1-second bins in cleaned event files. If a bin has >2000 counts, and if more than 50% of those come from <1% of pixels, then it is considered to be noise-dominated and hence unusable.
| Quadrant | # 1 sec bins | Bins with >0 counts | Bins with >2000 counts | High rate bins dominated by noise | Noise dominated (total time) | Noise dominated (detector-on time) | Marked lightcurve |
|---|---|---|---|---|---|---|---|
| A | 9145 | 6480 | 35 | 35 | 0.38% | 0.54% |  |
| B | 9145 | 6480 | 4 | 4 | 0.04% | 0.06% |  |
| C | 9145 | 6482 | 3 | 3 | 0.03% | 0.05% | 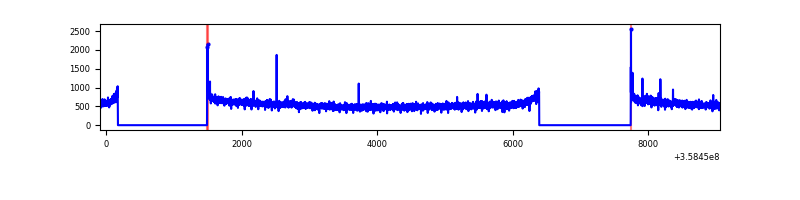 |
| D | 9145 | 6481 | 339 | 339 | 3.71% | 5.23% | 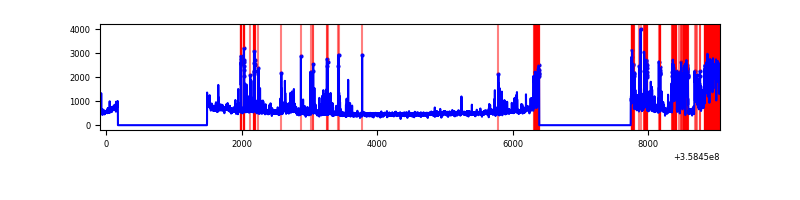 |
Top three noisy pixels from each quadrant. If the there are fewer than three noisy pixels in the level2.evt file, extra rows are filled as -1
| Pixel properties | Quadrant properties | ||||||
|---|---|---|---|---|---|---|---|
| Quadrant | DetID | PixID | Counts | Sigma | Mean | Median | Sigma |
| A | 0 | 13 | 202611 | 1137.16 | 895 | 883 | 177.4 |
| A | 8 | 192 | 26256 | 143.03 | 895 | 883 | 177.4 |
| A | 13 | 254 | 13382 | 70.46 | 895 | 883 | 177.4 |
| B | 6 | 159 | 1907109 | 11371.08 | 899 | 880 | 167.6 |
| B | 0 | 229 | 119138 | 705.44 | 899 | 880 | 167.6 |
| B | 0 | 190 | 20396 | 116.42 | 899 | 880 | 167.6 |
| C | 14 | 238 | 141195 | 694.45 | 866 | 874 | 202.1 |
| C | 3 | 233 | 40809 | 197.64 | 866 | 874 | 202.1 |
| C | 0 | 10 | 17666 | 83.1 | 866 | 874 | 202.1 |
| D | 13 | 104 | 1008041 | 4842.66 | 844 | 827 | 208.0 |
| D | 2 | 250 | 173779 | 831.55 | 844 | 827 | 208.0 |
| D | 8 | 195 | 154597 | 739.32 | 844 | 827 | 208.0 |
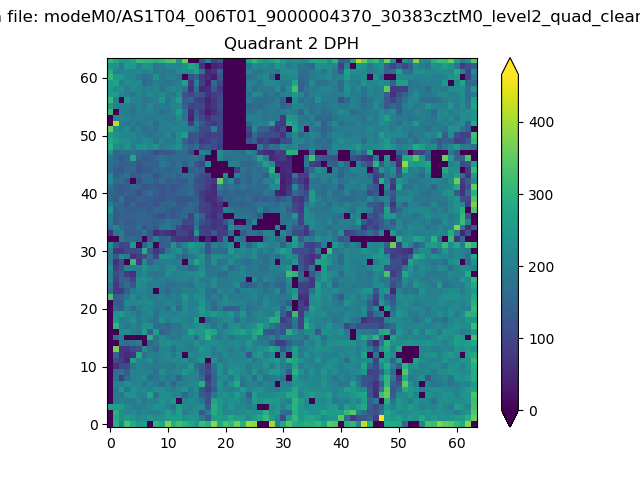
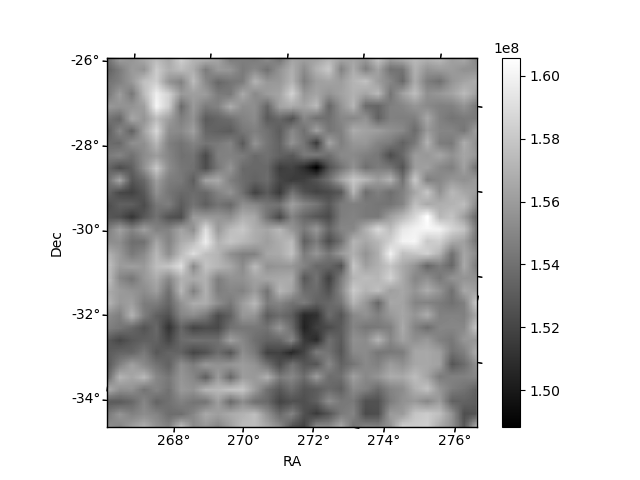
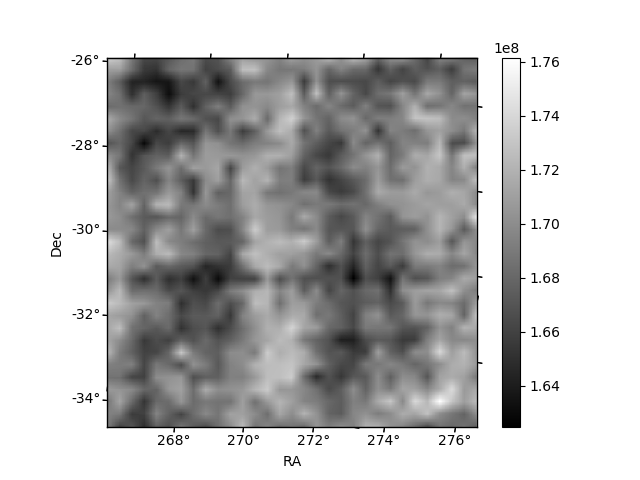
Histogram calculated using DETX and DETY for each event in the final _common_clean file
| Quadrant A | 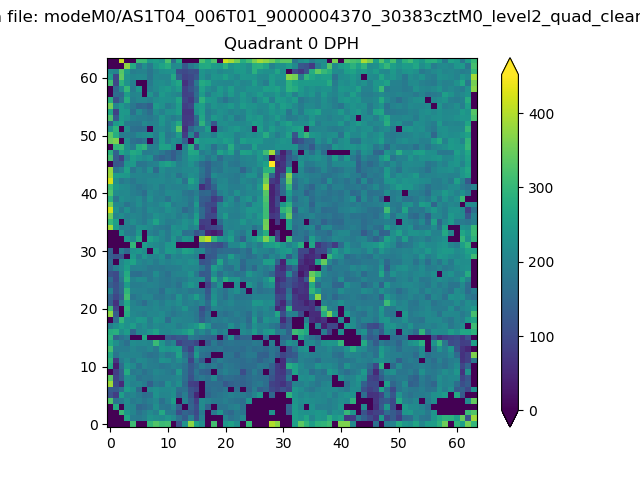 |
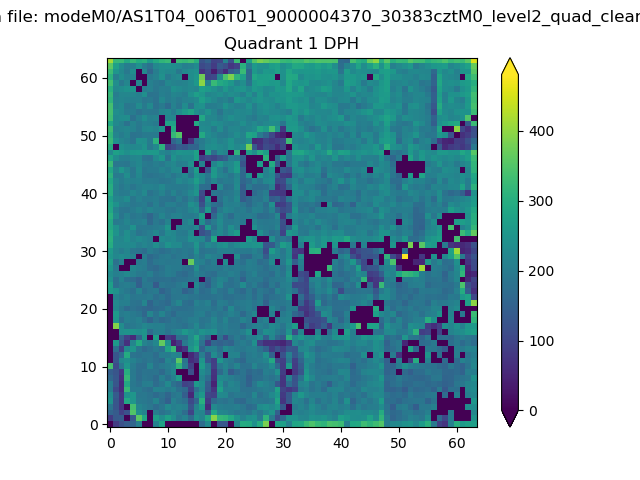 |
Quadrant B |
|---|---|---|---|
| Quadrant D | 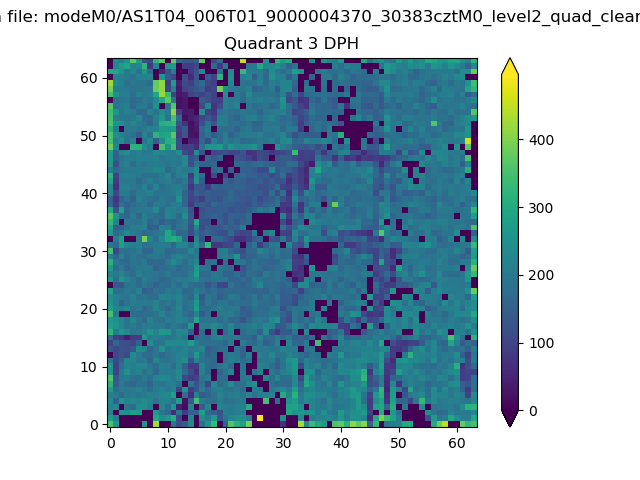 |
 |
Quadrant C |
| Plot type | Count rate plots | Images |
|---|---|---|
| Comparison with Poisson distribution Blue bars denote a histogram of data divided into 1 sec bins. Red curve is a Poisson curve with rate = median count rate of data. |
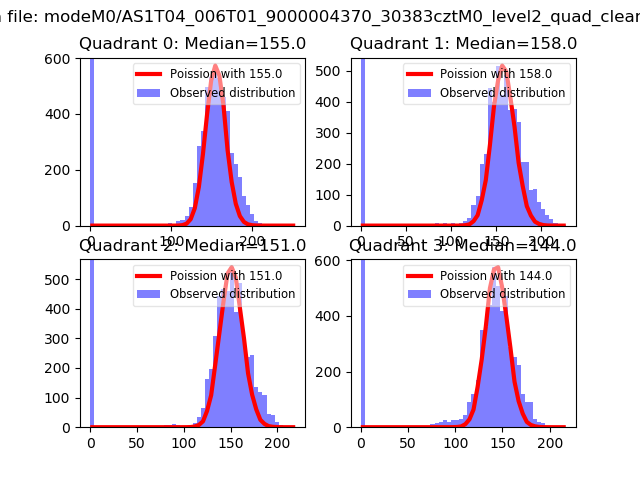 |
 |
| Quadrant-wise count rates Data is divided into 100 sec bins |
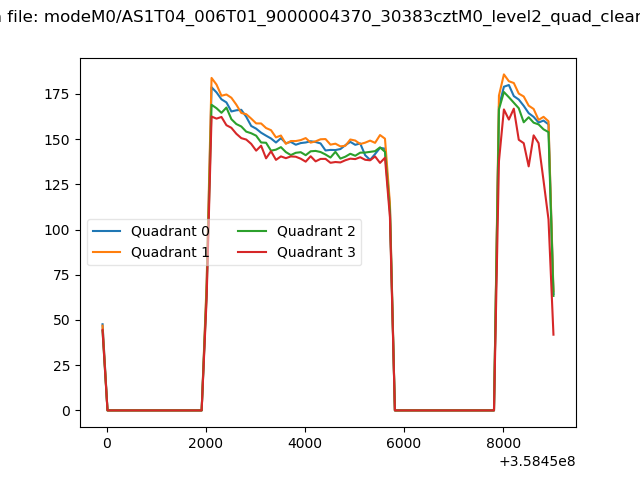 |
|
| Module-wise count rates for Quadrant A Data is divided into 100 sec bins |
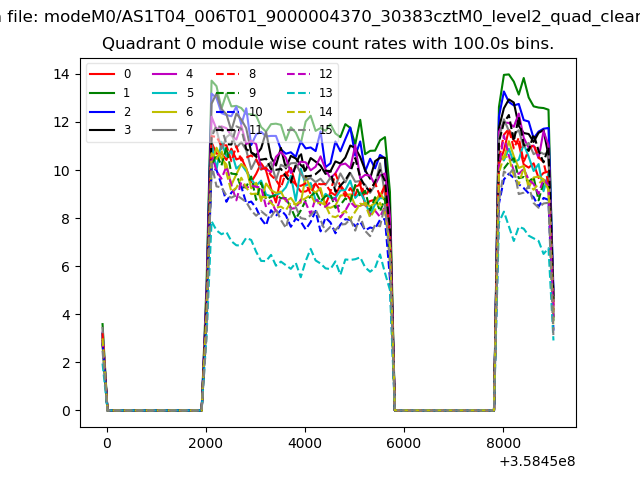 |
 |
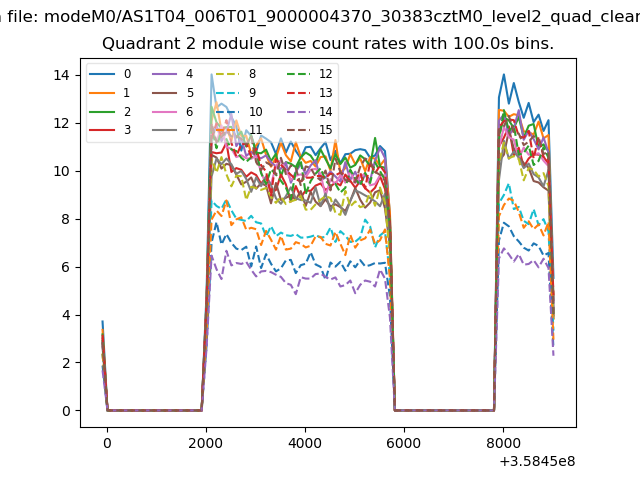
| Module-wise count rates for Quadrant B Data is divided into 100 sec bins |
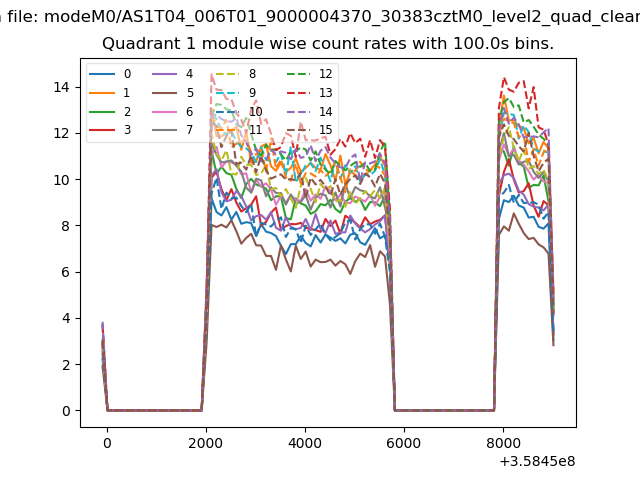 |
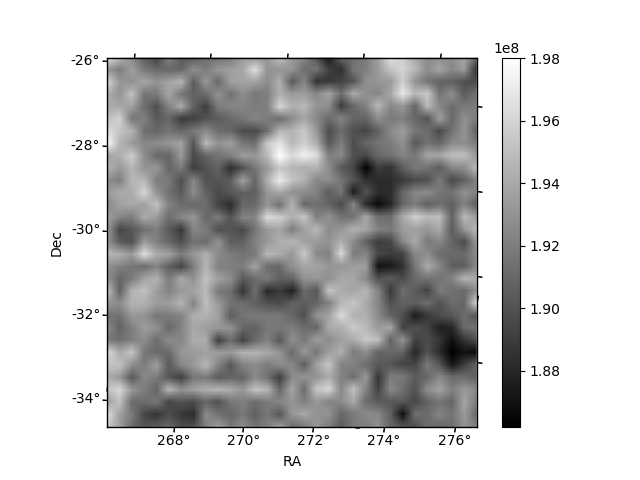 |
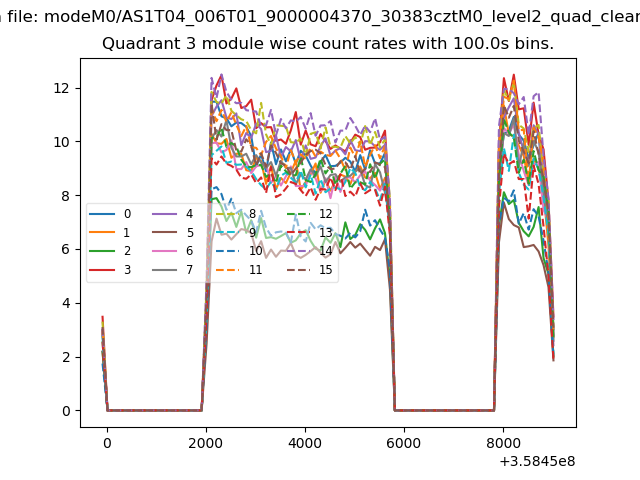
| Module-wise count rates for Quadrant C Data is divided into 100 sec bins |
 |
 |
| Module-wise count rates for Quadrant D Data is divided into 100 sec bins |
 |
 |
| Parameter | Plot |
|---|---|
| CZT HV Monitor | 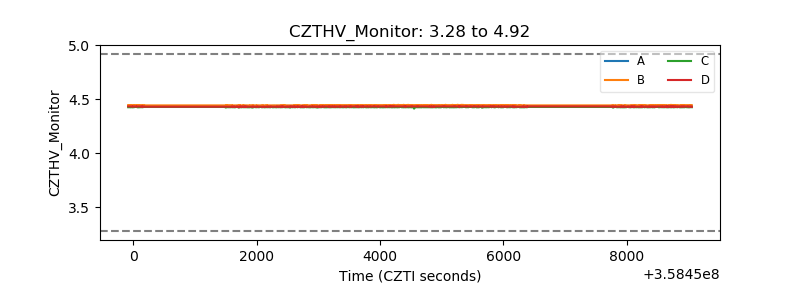 |
| D_VDD | 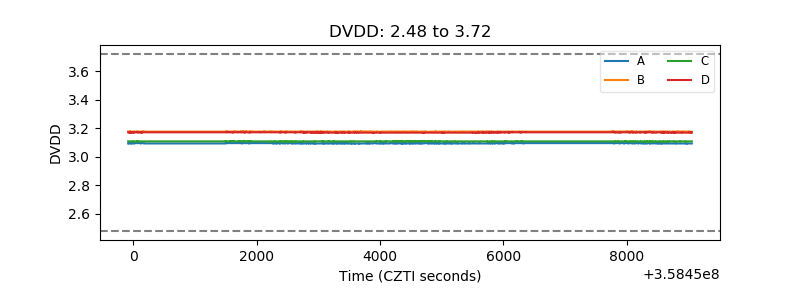 |
| Temperature 1 | 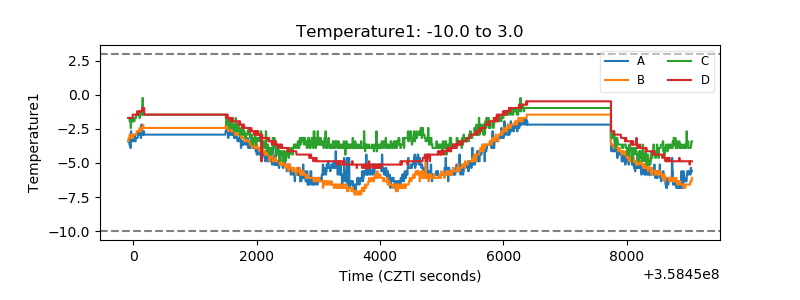 |
| Veto HV Monitor | 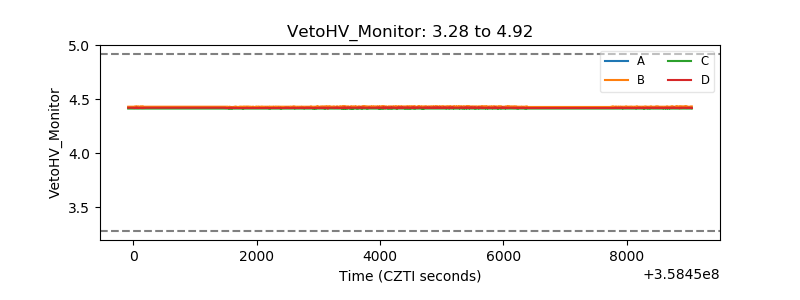 |
| Veto LLD | 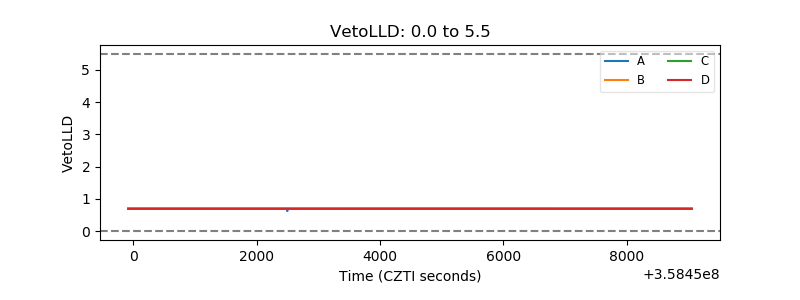 |
| Alpha Counter | 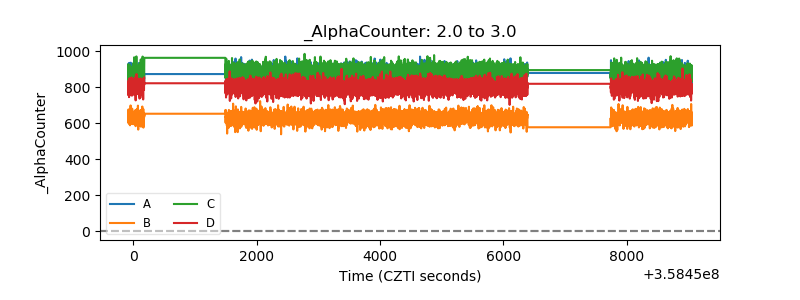 |
| _CPM_Rate | 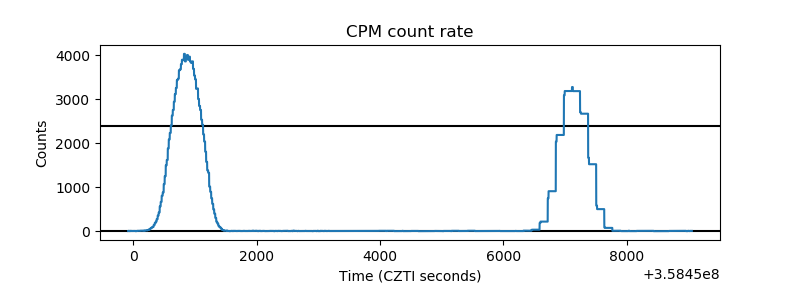 |
| CZT Counter | 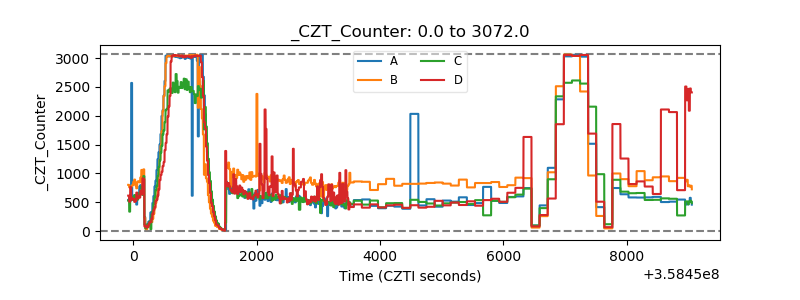 |
| +2.5 Volts monitor | 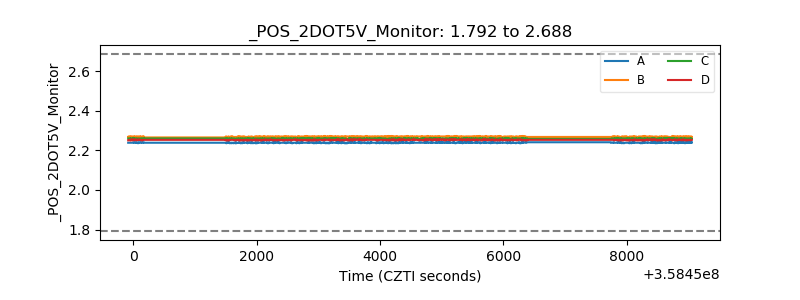 |
| +5 Volts monitor | 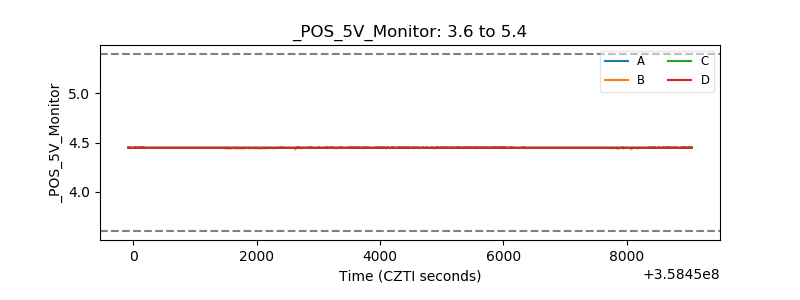 |
| _ROLL_ROT | 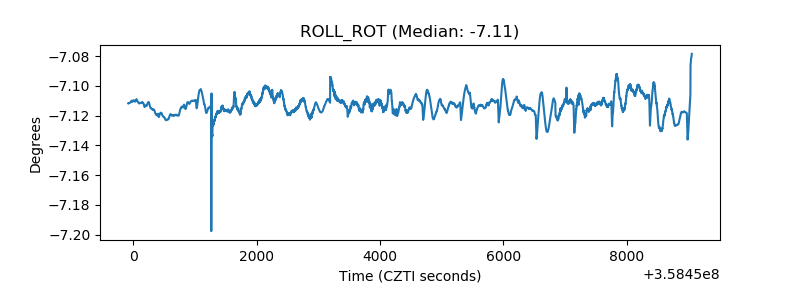 |
| _Roll_DEC | 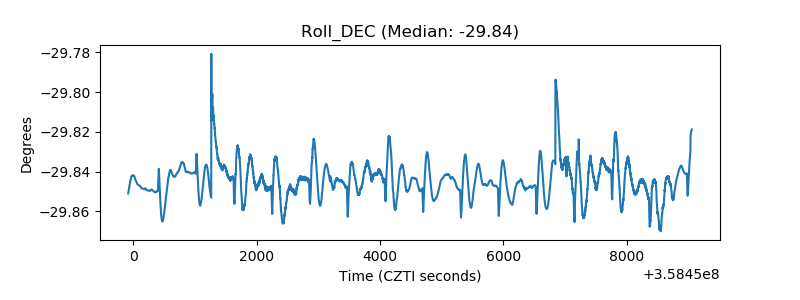 |
| _Roll_RA | 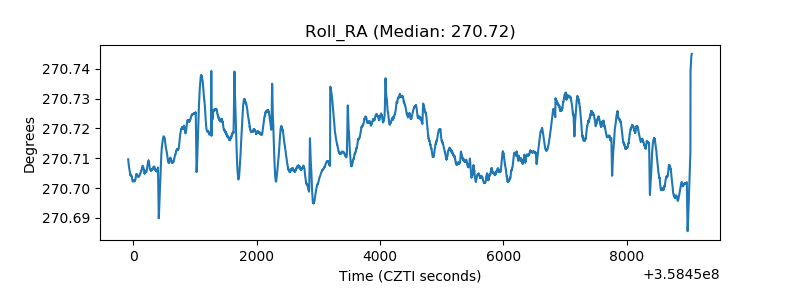 |
| Veto Counter | 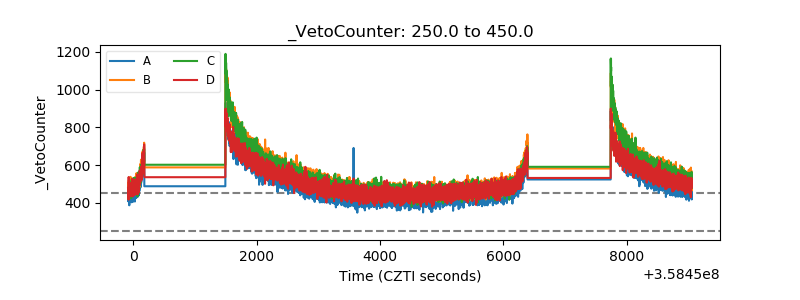 |