| Param | Original file | Final file |
|---|---|---|
| Filename | modeM0/AS1T04_006T01_9000004370_30384cztM0_level2.evt | modeM0/AS1T04_006T01_9000004370_30384cztM0_level2_quad_clean.evt |
| Size (bytes) | 533,609,280 | 111,337,920 |
| Size | 508.9 MB | 106.2 MB |
| Events in quadrant A | 3,068,676 | 753,559 |
| Events in quadrant B | 5,027,290 | 771,213 |
| Events in quadrant C | 3,246,618 | 733,946 |
| Events in quadrant D | 4,412,222 | 694,914 |
| Mode M9 | |||
|---|---|---|---|
| Quadrant | BADHDUFLAG | Total packets | Discarded packets |
| A | 0 | 13 | 0 |
| B | 0 | 13 | 0 |
| C | 0 | 13 | 0 |
| D | 0 | 13 | 0 |
| Mode M0 | |||
|---|---|---|---|
| Quadrant | BADHDUFLAG | Total packets | Discarded packets |
| A | 0 | 12743 | 1 |
| B | 0 | 18708 | 1 |
| C | 0 | 13224 | 1 |
| D | 0 | 17032 | 1 |
| Mode SS | |||
|---|---|---|---|
| Quadrant | BADHDUFLAG | Total packets | Discarded packets |
| A | 0 | 122 | 0 |
| B | 0 | 122 | 0 |
| C | 0 | 122 | 0 |
| D | 0 | 122 | 0 |
| Quadrant | Total seconds | Saturated seconds | Saturation percentage |
|---|---|---|---|
| A | 5988 | 65 | 1.085504% |
| B | 5988 | 156 | 2.605210% |
| C | 5988 | 198 | 3.306613% |
| D | 5987 | 356 | 5.946217% |
Noise dominated data is calculated using 1-second bins in cleaned event files. If a bin has >2000 counts, and if more than 50% of those come from <1% of pixels, then it is considered to be noise-dominated and hence unusable.
| Quadrant | # 1 sec bins | Bins with >0 counts | Bins with >2000 counts | High rate bins dominated by noise | Noise dominated (total time) | Noise dominated (detector-on time) | Marked lightcurve |
|---|---|---|---|---|---|---|---|
| A | 7283 | 5989 | 4 | 4 | 0.05% | 0.07% | 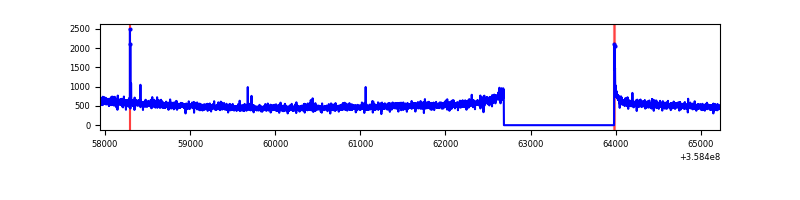 |
| B | 7283 | 5988 | 8 | 8 | 0.11% | 0.13% | 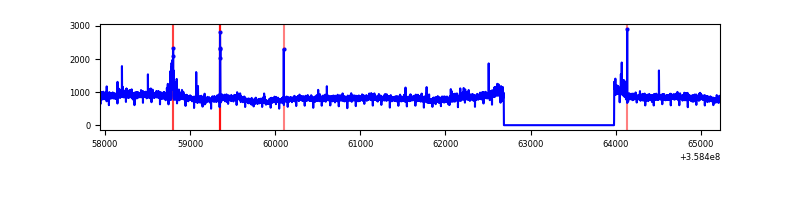 |
| C | 7283 | 5988 | 0 | 0 | 0.00% | 0.00% | 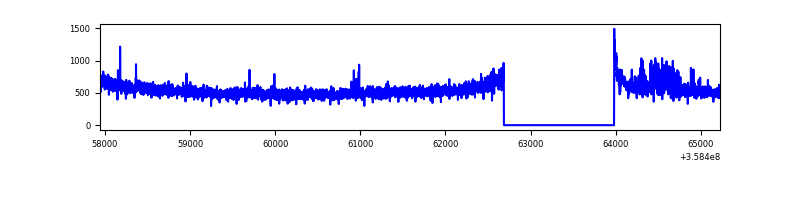 |
| D | 7282 | 5988 | 329 | 329 | 4.52% | 5.49% | 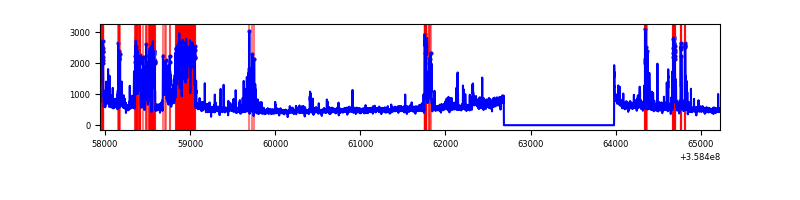 |
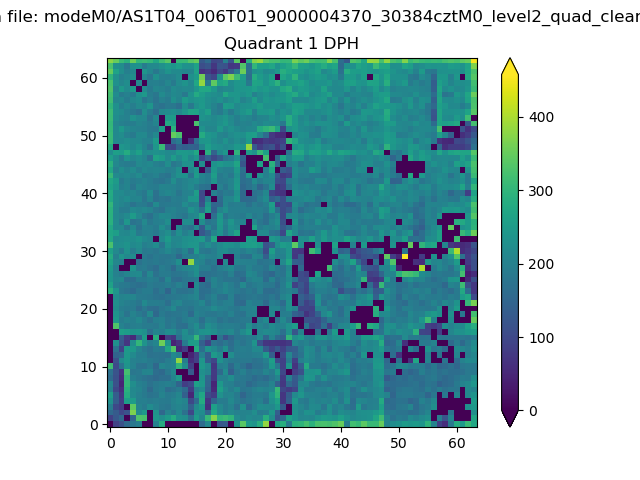
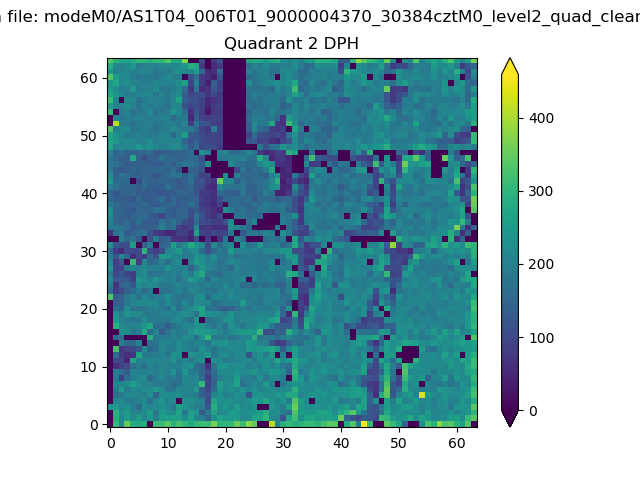
Top three noisy pixels from each quadrant. If the there are fewer than three noisy pixels in the level2.evt file, extra rows are filled as -1
| Pixel properties | Quadrant properties | ||||||
|---|---|---|---|---|---|---|---|
| Quadrant | DetID | PixID | Counts | Sigma | Mean | Median | Sigma |
| A | 8 | 192 | 13888 | 83.69 | 788 | 776 | 156.7 |
| A | 13 | 254 | 12445 | 74.48 | 788 | 776 | 156.7 |
| A | 12 | 96 | 8740 | 50.83 | 788 | 776 | 156.7 |
| B | 6 | 159 | 1769872 | 11870.21 | 790 | 772 | 149.0 |
| B | 0 | 229 | 120024 | 800.15 | 790 | 772 | 149.0 |
| B | 12 | 111 | 17517 | 112.35 | 790 | 772 | 149.0 |
| C | 14 | 238 | 158015 | 880.71 | 766 | 772 | 178.5 |
| C | 14 | 254 | 47275 | 260.46 | 766 | 772 | 178.5 |
| C | 3 | 233 | 37903 | 207.97 | 766 | 772 | 178.5 |
| D | 13 | 104 | 1007308 | 5157.78 | 743 | 732 | 195.2 |
| D | 7 | 238 | 198239 | 1012.04 | 743 | 732 | 195.2 |
| D | 8 | 195 | 181923 | 928.44 | 743 | 732 | 195.2 |
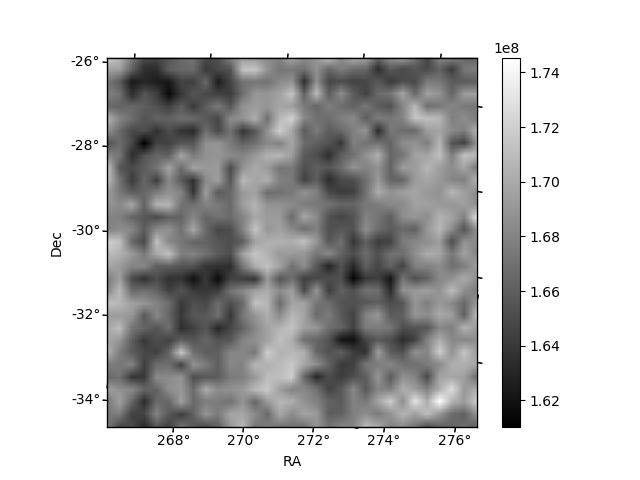
Histogram calculated using DETX and DETY for each event in the final _common_clean file
| Quadrant A | 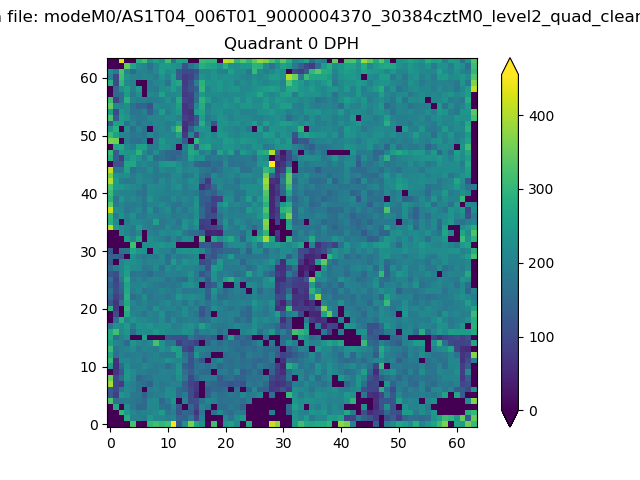 |
 |
Quadrant B |
|---|---|---|---|
| Quadrant D | 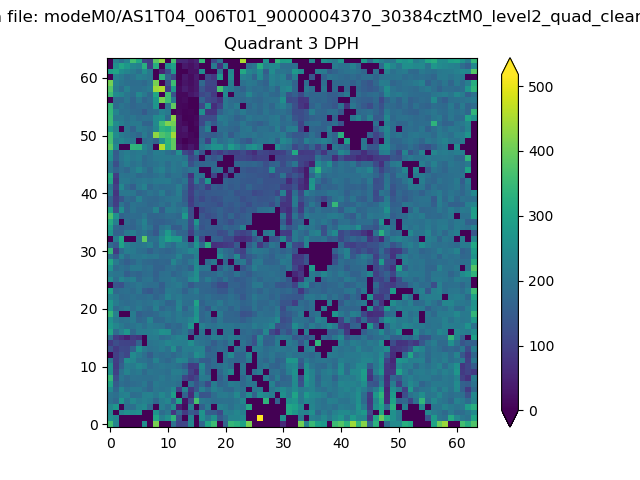 |
 |
Quadrant C |
| Plot type | Count rate plots | Images |
|---|---|---|
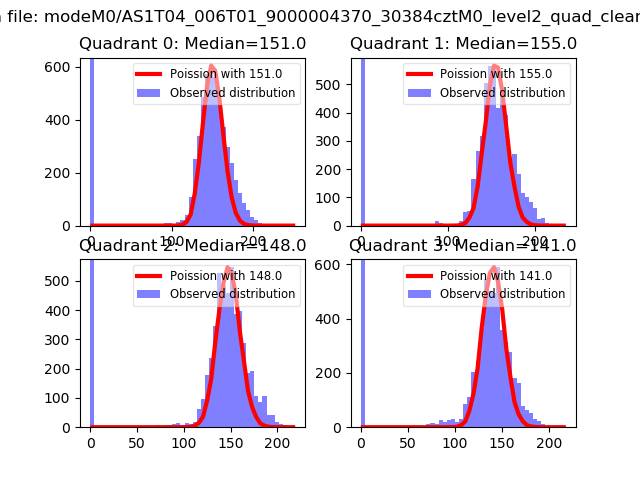
| Comparison with Poisson distribution Blue bars denote a histogram of data divided into 1 sec bins. Red curve is a Poisson curve with rate = median count rate of data. |
 |
 |
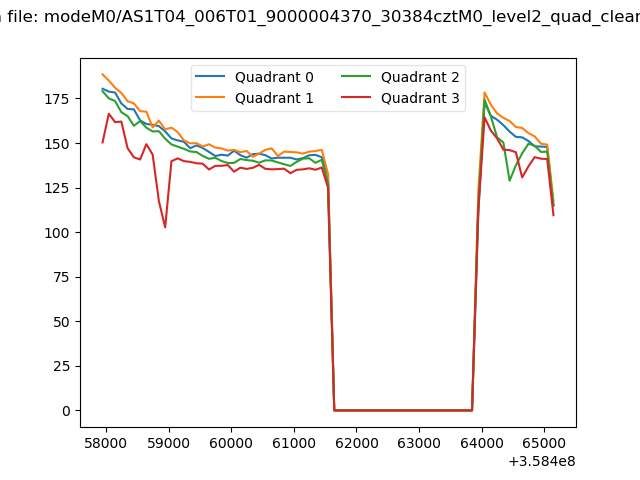
| Quadrant-wise count rates Data is divided into 100 sec bins |
 |
|
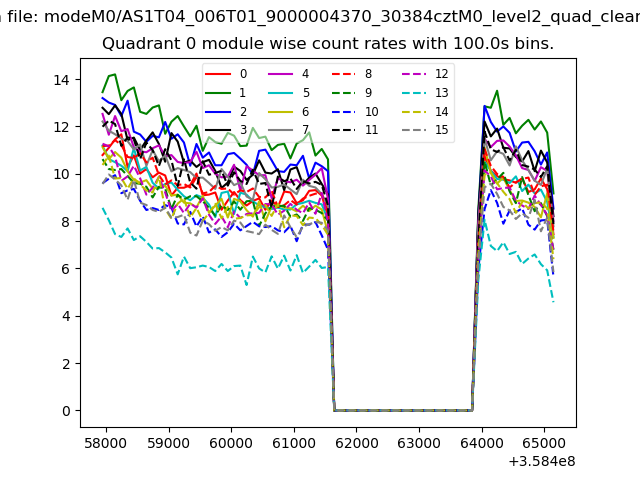
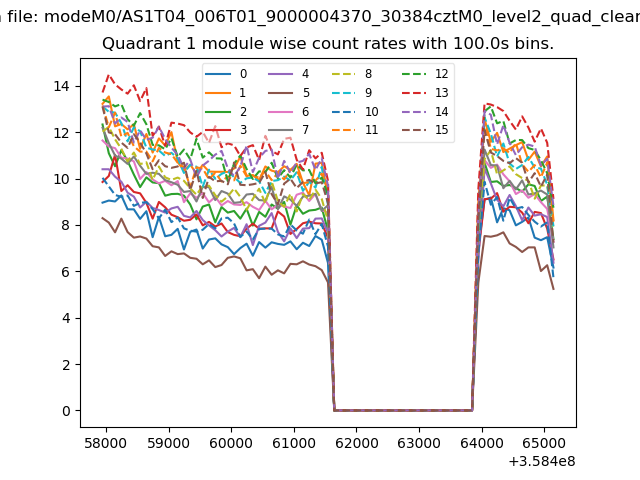
| Module-wise count rates for Quadrant A Data is divided into 100 sec bins |
 |
 |
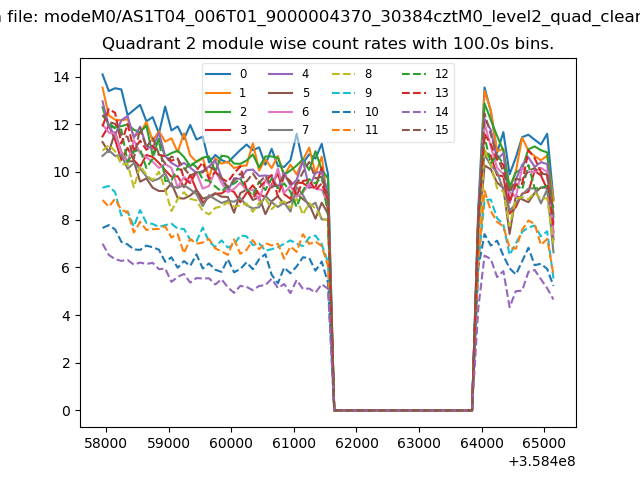
| Module-wise count rates for Quadrant B Data is divided into 100 sec bins |
 |
 |
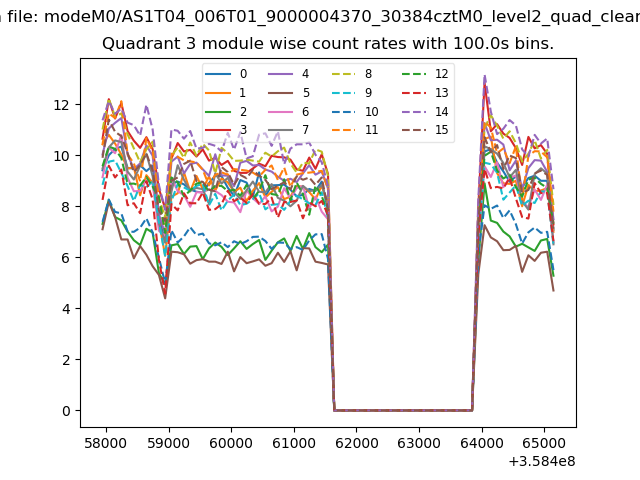
| Module-wise count rates for Quadrant C Data is divided into 100 sec bins |
 |
 |
| Module-wise count rates for Quadrant D Data is divided into 100 sec bins |
 |
 |
| Parameter | Plot |
|---|---|
| CZT HV Monitor | 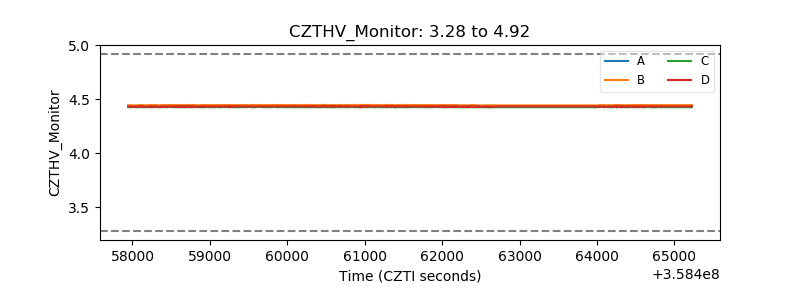 |
| D_VDD | 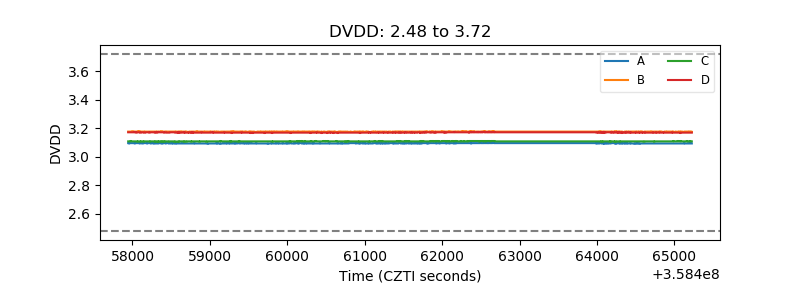 |
| Temperature 1 | 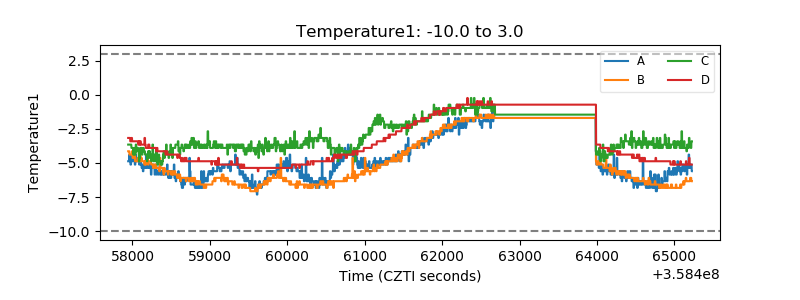 |
| Veto HV Monitor |  |
| Veto LLD | 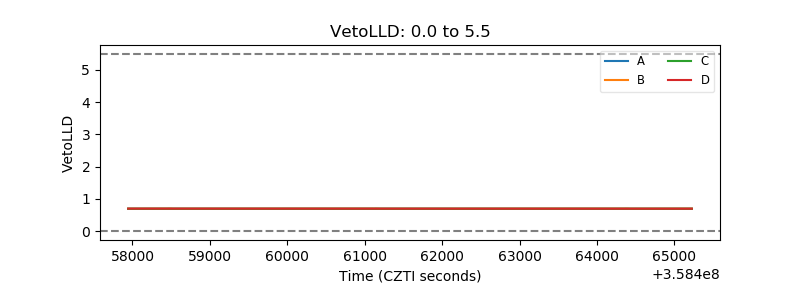 |
| Alpha Counter | 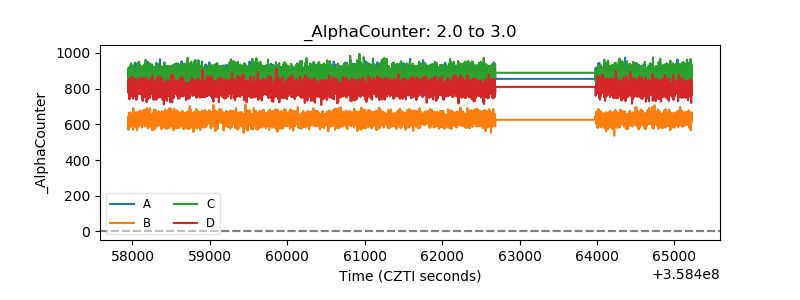 |
| _CPM_Rate | 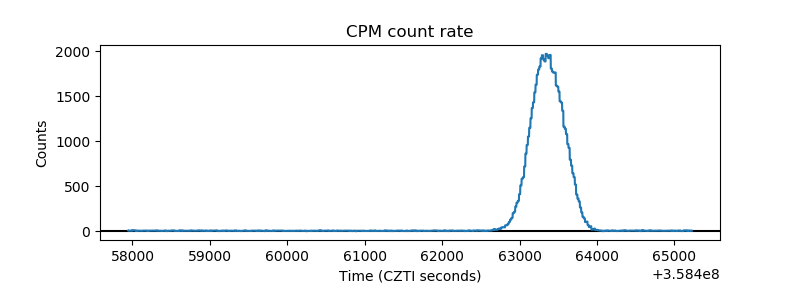 |
| CZT Counter | 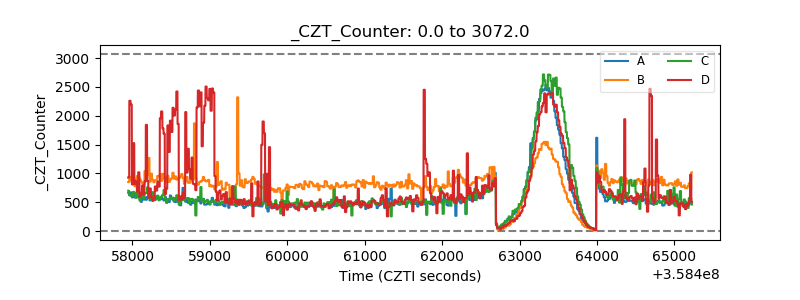 |
| +2.5 Volts monitor | 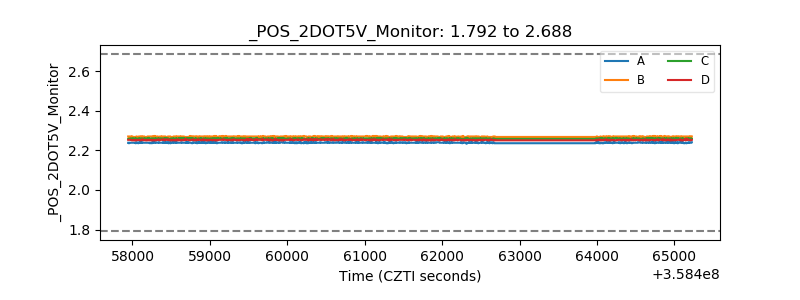 |
| +5 Volts monitor |  |
| _ROLL_ROT | 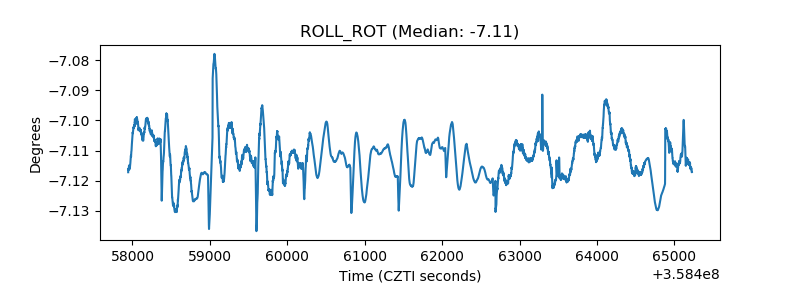 |
| _Roll_DEC | 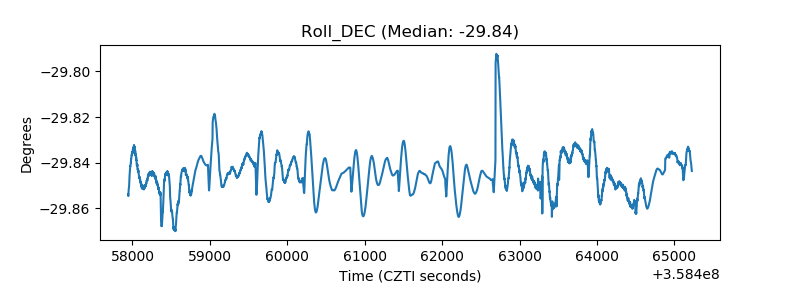 |
| _Roll_RA | 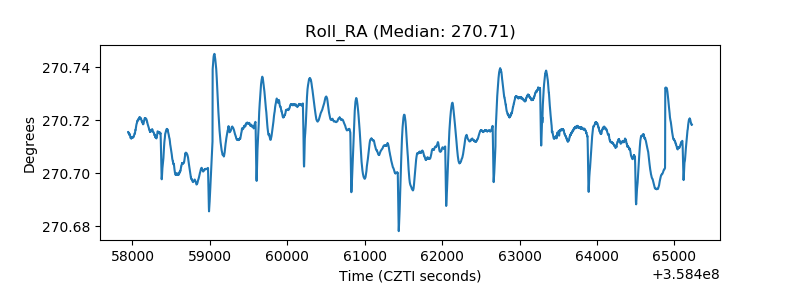 |
| Veto Counter | 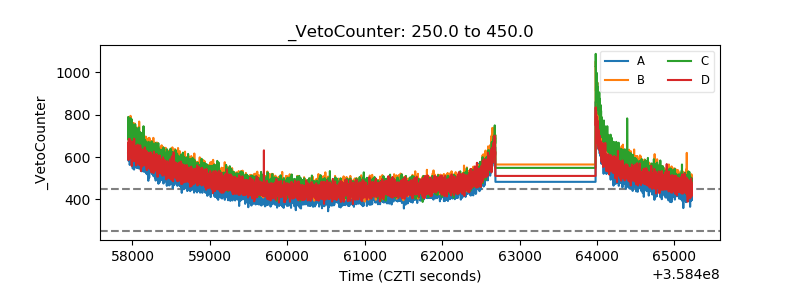 |