| Param | Original file | Final file |
|---|---|---|
| Filename | modeM0/AS1T04_006T01_9000004370_30391cztM0_level2.evt | modeM0/AS1T04_006T01_9000004370_30391cztM0_level2_quad_clean.evt |
| Size (bytes) | 1,045,307,520 | 184,662,720 |
| Size | 996.9 MB | 176.1 MB |
| Events in quadrant A | 6,385,339 | 1,187,886 |
| Events in quadrant B | 10,254,816 | 1,196,517 |
| Events in quadrant C | 6,819,248 | 1,162,570 |
| Events in quadrant D | 7,303,746 | 1,130,972 |
| Mode M9 | |||
|---|---|---|---|
| Quadrant | BADHDUFLAG | Total packets | Discarded packets |
| A | 0 | 8 | 0 |
| B | 0 | 9 | 0 |
| C | 0 | 9 | 0 |
| D | 0 | 9 | 0 |
| Mode M0 | |||
|---|---|---|---|
| Quadrant | BADHDUFLAG | Total packets | Discarded packets |
| A | 0 | 27491 | 4 |
| B | 0 | 40088 | 4 |
| C | 0 | 28098 | 4 |
| D | 0 | 30279 | 4 |
| Mode SS | |||
|---|---|---|---|
| Quadrant | BADHDUFLAG | Total packets | Discarded packets |
| A | 0 | 270 | 0 |
| B | 0 | 270 | 0 |
| C | 0 | 270 | 0 |
| D | 0 | 270 | 0 |
| Quadrant | Total seconds | Saturated seconds | Saturation percentage |
|---|---|---|---|
| A | 13230 | 319 | 2.411187% |
| B | 13230 | 479 | 3.620559% |
| C | 13230 | 449 | 3.393802% |
| D | 13230 | 326 | 2.464097% |
Noise dominated data is calculated using 1-second bins in cleaned event files. If a bin has >2000 counts, and if more than 50% of those come from <1% of pixels, then it is considered to be noise-dominated and hence unusable.
| Quadrant | # 1 sec bins | Bins with >0 counts | Bins with >2000 counts | High rate bins dominated by noise | Noise dominated (total time) | Noise dominated (detector-on time) | Marked lightcurve |
|---|---|---|---|---|---|---|---|
| A | 13615 | 13230 | 3 | 3 | 0.02% | 0.02% | 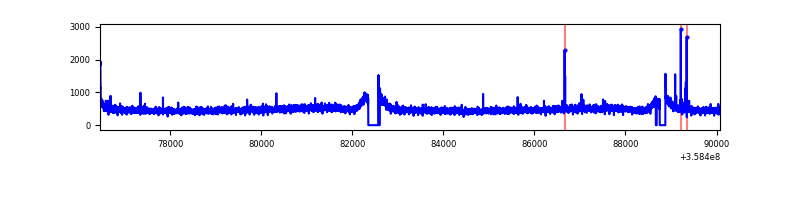 |
| B | 13615 | 13230 | 1 | 1 | 0.01% | 0.01% | 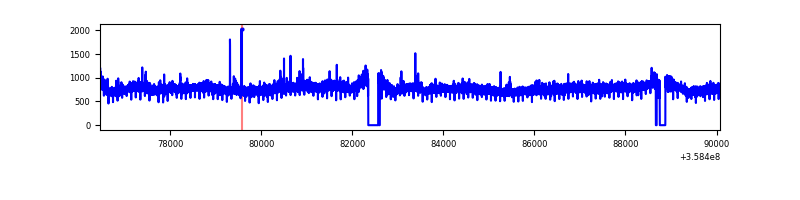 |
| C | 13615 | 13230 | 4 | 4 | 0.03% | 0.03% | 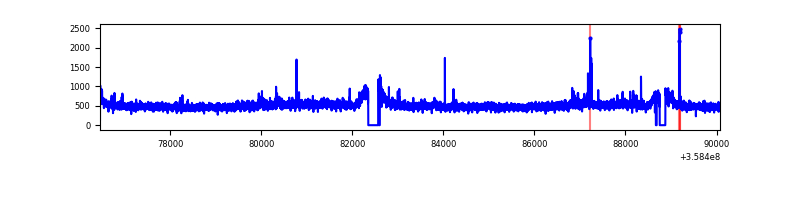 |
| D | 13615 | 13231 | 65 | 65 | 0.48% | 0.49% | 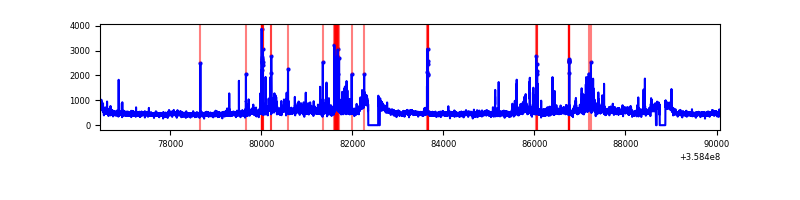 |
Top three noisy pixels from each quadrant. If the there are fewer than three noisy pixels in the level2.evt file, extra rows are filled as -1
| Pixel properties | Quadrant properties | ||||||
|---|---|---|---|---|---|---|---|
| Quadrant | DetID | PixID | Counts | Sigma | Mean | Median | Sigma |
| A | 8 | 192 | 35462 | 102.35 | 1636 | 1599 | 330.8 |
| A | 12 | 96 | 30894 | 88.55 | 1636 | 1599 | 330.8 |
| A | 13 | 254 | 25873 | 73.37 | 1636 | 1599 | 330.8 |
| B | 6 | 159 | 3738744 | 11956.21 | 1617 | 1572 | 312.6 |
| B | 0 | 229 | 102014 | 321.34 | 1617 | 1572 | 312.6 |
| B | 12 | 111 | 39019 | 119.8 | 1617 | 1572 | 312.6 |
| C | 3 | 233 | 334687 | 889.58 | 1586 | 1596 | 374.4 |
| C | 14 | 238 | 255882 | 679.12 | 1586 | 1596 | 374.4 |
| C | 2 | 114 | 31129 | 78.87 | 1586 | 1596 | 374.4 |
| D | 13 | 104 | 503060 | 1281.76 | 1592 | 1552 | 391.3 |
| D | 8 | 195 | 498538 | 1270.2 | 1592 | 1552 | 391.3 |
| D | 2 | 250 | 76326 | 191.11 | 1592 | 1552 | 391.3 |
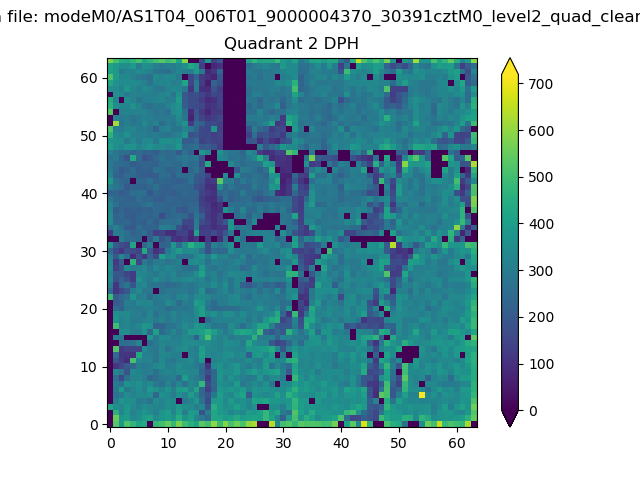
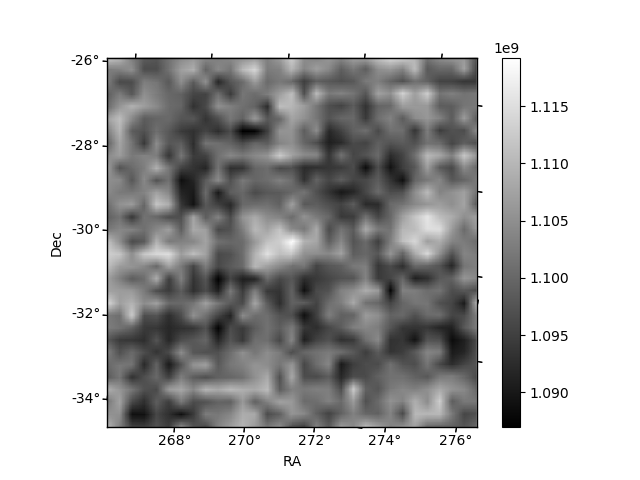
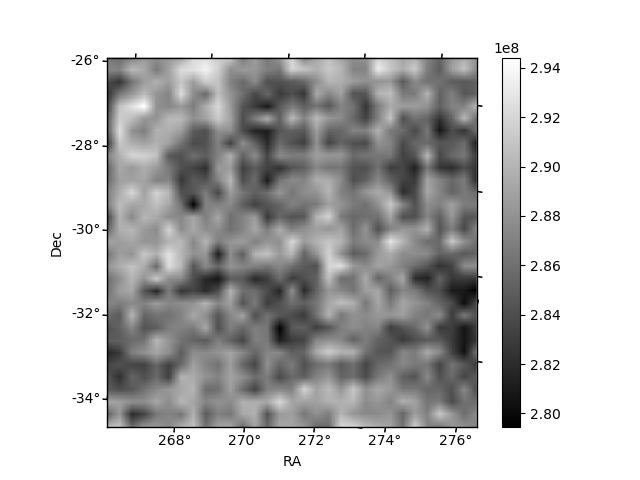
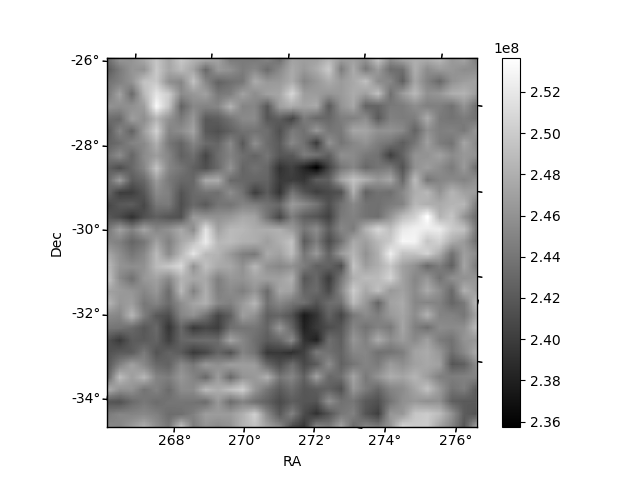
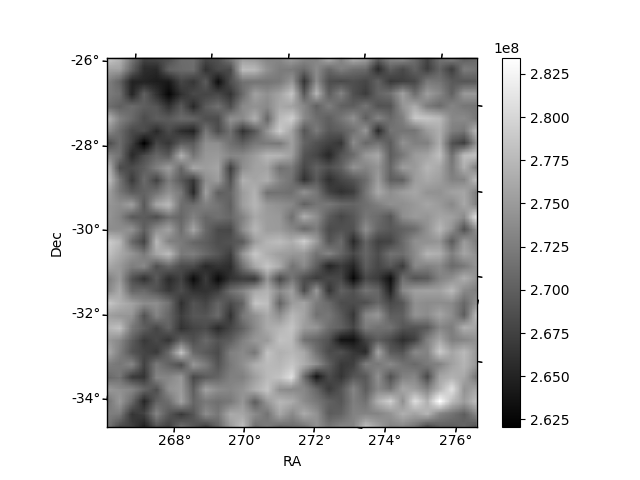
Histogram calculated using DETX and DETY for each event in the final _common_clean file
| Quadrant A | 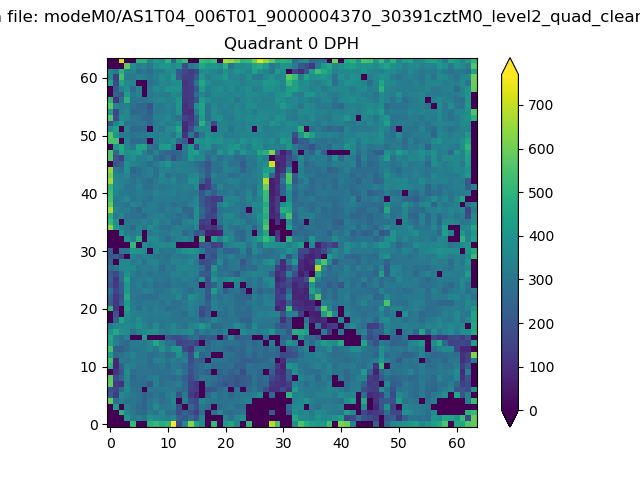 |
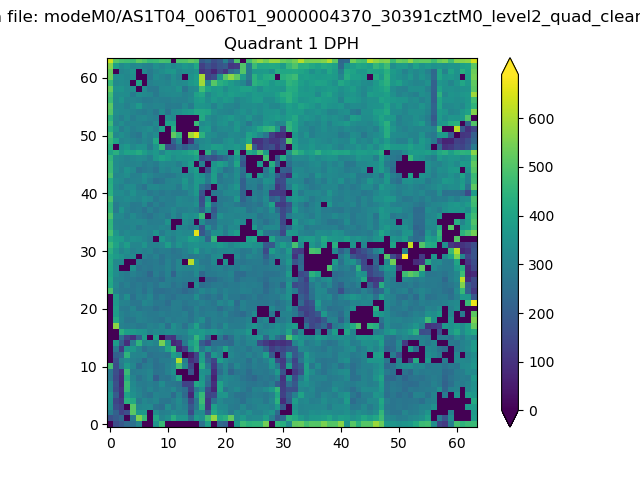 |
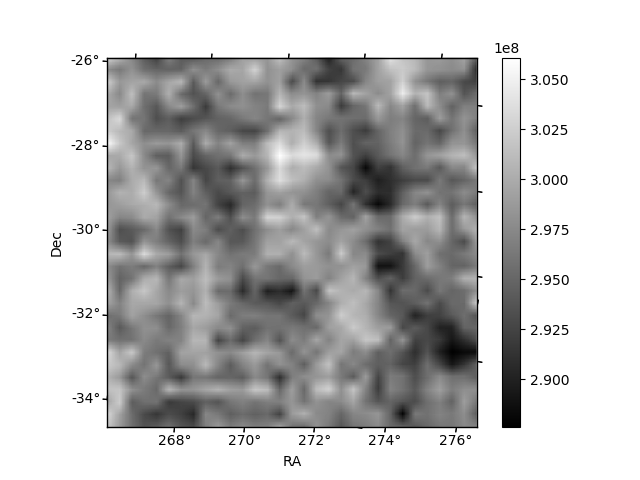
Quadrant B |
|---|---|---|---|
| Quadrant D | 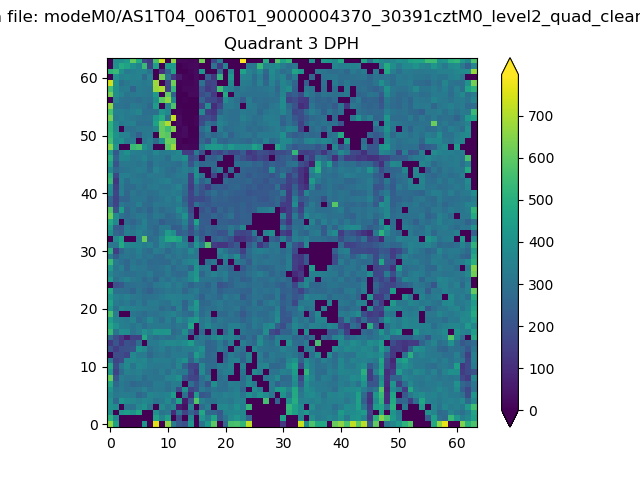 |
 |
Quadrant C |
| Plot type | Count rate plots | Images |
|---|---|---|
| Comparison with Poisson distribution Blue bars denote a histogram of data divided into 1 sec bins. Red curve is a Poisson curve with rate = median count rate of data. |
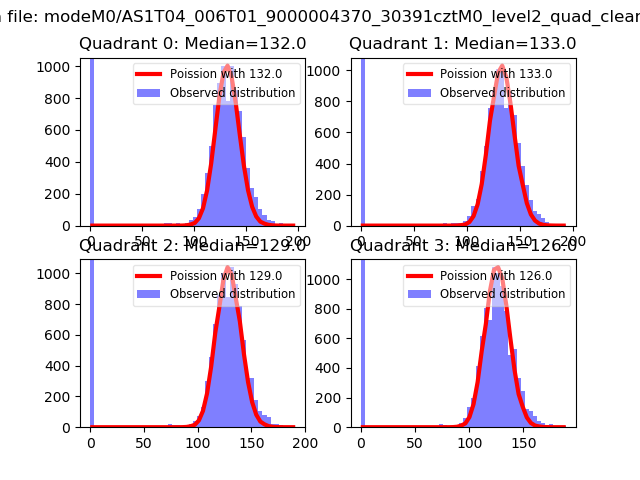 |
 |
| Quadrant-wise count rates Data is divided into 100 sec bins |
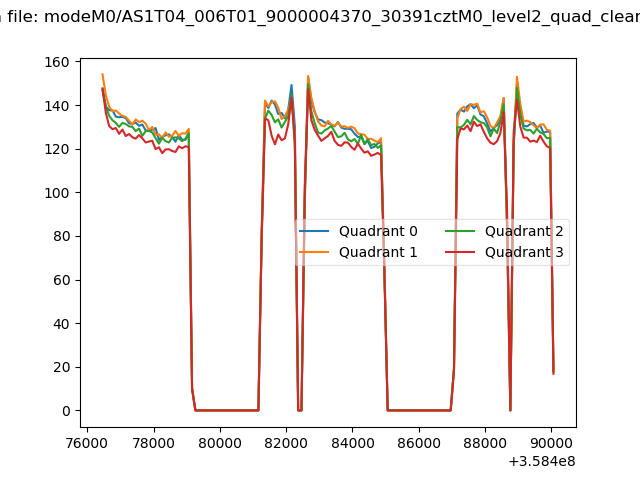 |
|
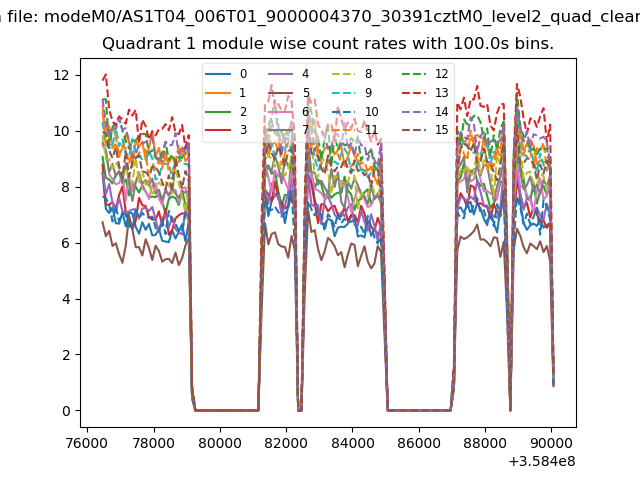
| Module-wise count rates for Quadrant A Data is divided into 100 sec bins |
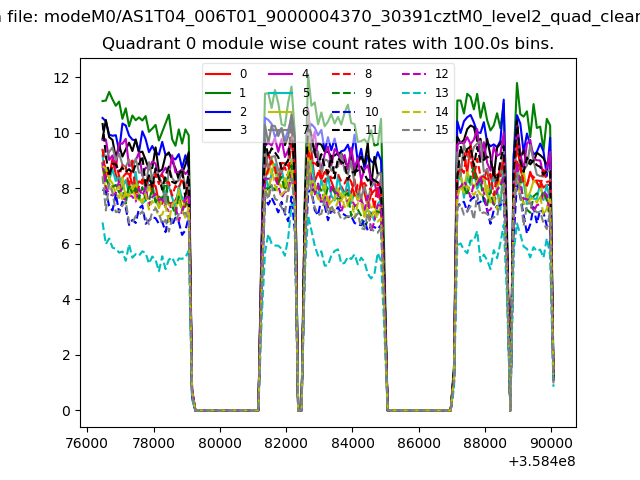 |
 |
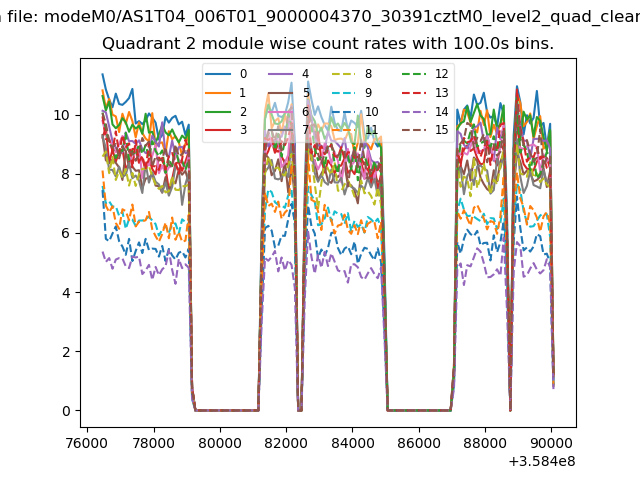
| Module-wise count rates for Quadrant B Data is divided into 100 sec bins |
 |
 |
| Module-wise count rates for Quadrant C Data is divided into 100 sec bins |
 |
 |
| Module-wise count rates for Quadrant D Data is divided into 100 sec bins |
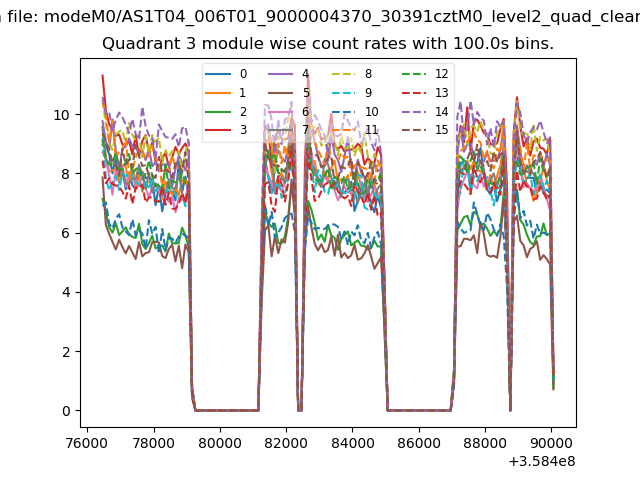 |
 |
| Parameter | Plot |
|---|---|
| CZT HV Monitor | 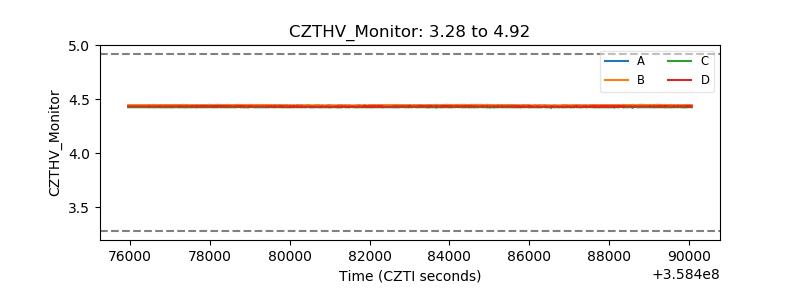 |
| D_VDD | 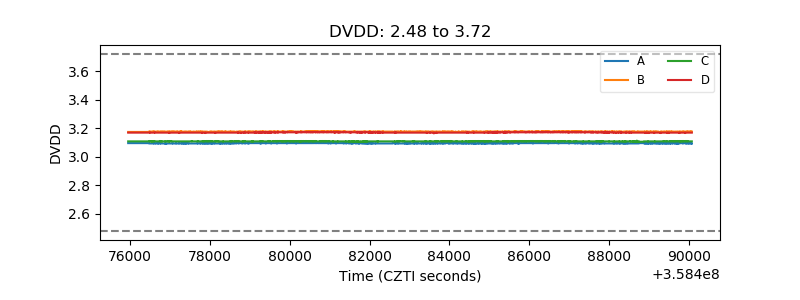 |
| Temperature 1 | 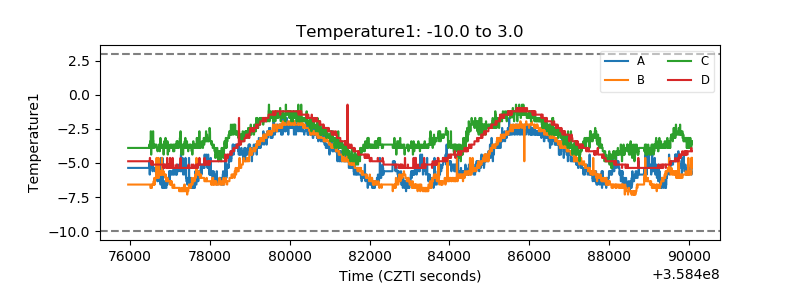 |
| Veto HV Monitor | 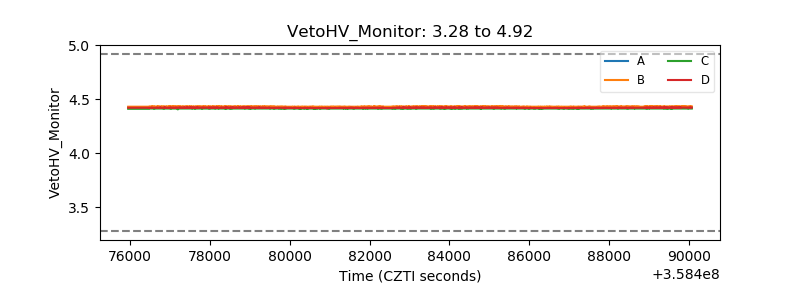 |
| Veto LLD | 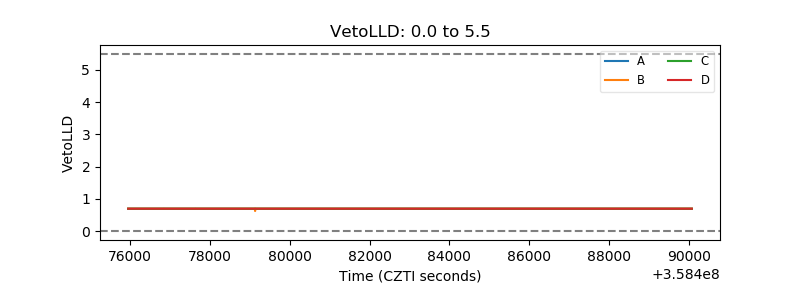 |
| Alpha Counter | 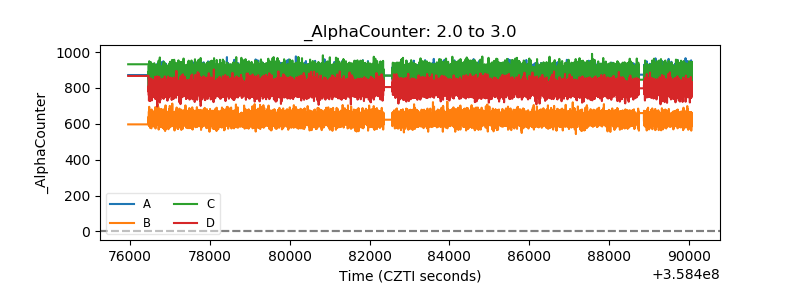 |
| _CPM_Rate | 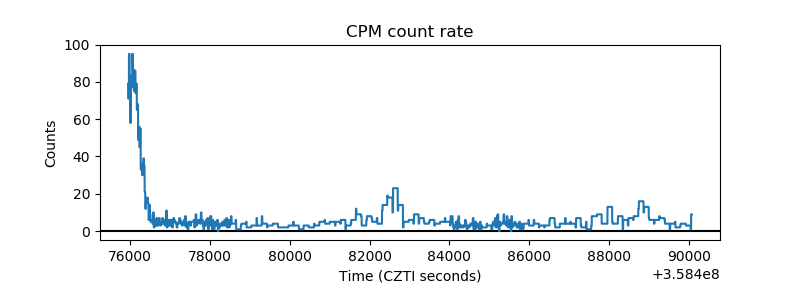 |
| CZT Counter | 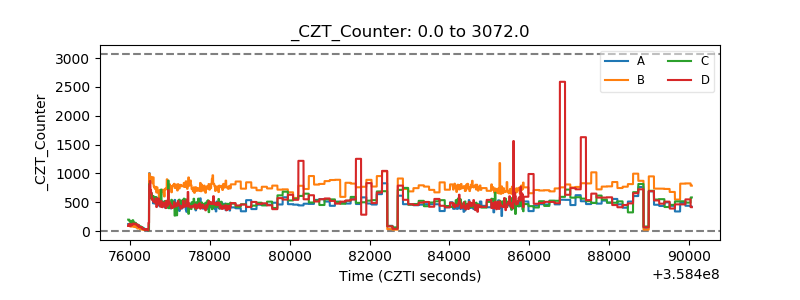 |
| +2.5 Volts monitor |  |
| +5 Volts monitor |  |
| _ROLL_ROT | 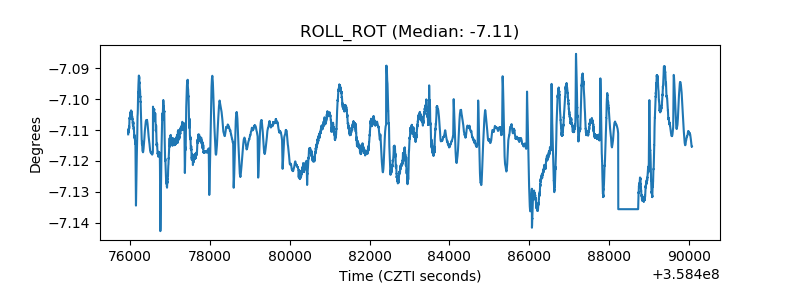 |
| _Roll_DEC | 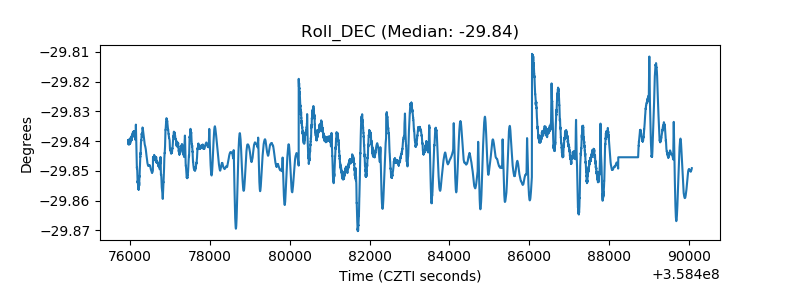 |
| _Roll_RA | 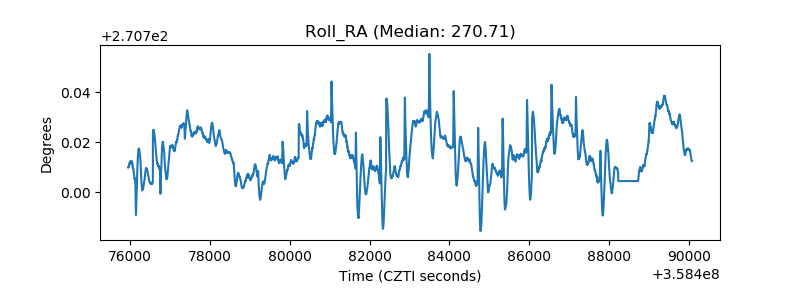 |
| Veto Counter | 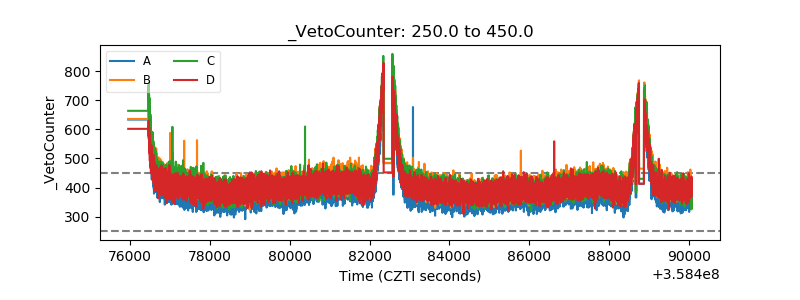 |