| Param | Original file | Final file |
|---|---|---|
| Filename | modeM0/AS1T04_006T01_9000004370_30393cztM0_level2.evt | modeM0/AS1T04_006T01_9000004370_30393cztM0_level2_quad_clean.evt |
| Size (bytes) | 575,968,320 | 69,603,840 |
| Size | 549.3 MB | 66.4 MB |
| Events in quadrant A | 3,391,391 | 420,263 |
| Events in quadrant B | 5,474,318 | 415,011 |
| Events in quadrant C | 3,396,092 | 404,762 |
| Events in quadrant D | 4,727,631 | 400,094 |
| Mode M9 | |||
|---|---|---|---|
| Quadrant | BADHDUFLAG | Total packets | Discarded packets |
| A | 0 | 10 | 0 |
| B | 0 | 11 | 0 |
| C | 0 | 11 | 0 |
| D | 0 | 11 | 0 |
| Mode M0 | |||
|---|---|---|---|
| Quadrant | BADHDUFLAG | Total packets | Discarded packets |
| A | 0 | 14413 | 2 |
| B | 0 | 20840 | 3 |
| C | 0 | 14282 | 2 |
| D | 0 | 18492 | 2 |
| Mode SS | |||
|---|---|---|---|
| Quadrant | BADHDUFLAG | Total packets | Discarded packets |
| A | 0 | 136 | 0 |
| B | 0 | 136 | 0 |
| C | 0 | 136 | 0 |
| D | 0 | 136 | 0 |
| Quadrant | Total seconds | Saturated seconds | Saturation percentage |
|---|---|---|---|
| A | 6705 | 77 | 1.148397% |
| B | 6704 | 160 | 2.386635% |
| C | 6704 | 91 | 1.357399% |
| D | 6704 | 305 | 4.549523% |
Noise dominated data is calculated using 1-second bins in cleaned event files. If a bin has >2000 counts, and if more than 50% of those come from <1% of pixels, then it is considered to be noise-dominated and hence unusable.
| Quadrant | # 1 sec bins | Bins with >0 counts | Bins with >2000 counts | High rate bins dominated by noise | Noise dominated (total time) | Noise dominated (detector-on time) | Marked lightcurve |
|---|---|---|---|---|---|---|---|
| A | 7730 | 6705 | 3 | 3 | 0.04% | 0.04% | 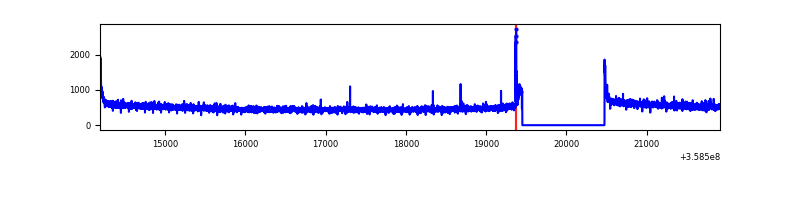 |
| B | 7729 | 6704 | 29 | 29 | 0.38% | 0.43% | 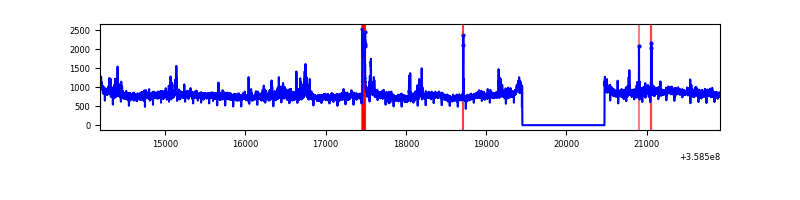 |
| C | 7729 | 6704 | 0 | 0 | 0.00% | 0.00% | 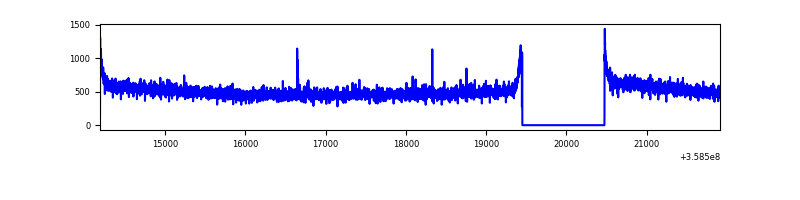 |
| D | 7729 | 6704 | 231 | 231 | 2.99% | 3.45% | 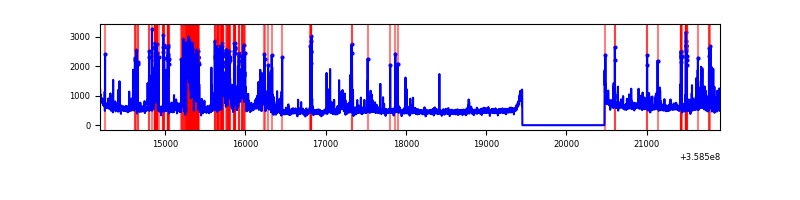 |
Top three noisy pixels from each quadrant. If the there are fewer than three noisy pixels in the level2.evt file, extra rows are filled as -1
| Pixel properties | Quadrant properties | ||||||
|---|---|---|---|---|---|---|---|
| Quadrant | DetID | PixID | Counts | Sigma | Mean | Median | Sigma |
| A | 8 | 192 | 23552 | 131.73 | 863 | 848 | 172.3 |
| A | 0 | 13 | 18464 | 102.21 | 863 | 848 | 172.3 |
| A | 13 | 254 | 13056 | 70.83 | 863 | 848 | 172.3 |
| B | 6 | 159 | 1858729 | 11558.91 | 851 | 832 | 160.7 |
| B | 0 | 229 | 124043 | 766.56 | 851 | 832 | 160.7 |
| B | 12 | 18 | 51313 | 314.07 | 851 | 832 | 160.7 |
| C | 14 | 238 | 133691 | 690.52 | 824 | 830 | 192.4 |
| C | 3 | 233 | 29737 | 150.24 | 824 | 830 | 192.4 |
| C | 2 | 114 | 15944 | 78.55 | 824 | 830 | 192.4 |
| D | 13 | 104 | 646564 | 3046.43 | 817 | 801 | 212.0 |
| D | 12 | 233 | 467178 | 2200.16 | 817 | 801 | 212.0 |
| D | 8 | 195 | 279852 | 1316.44 | 817 | 801 | 212.0 |
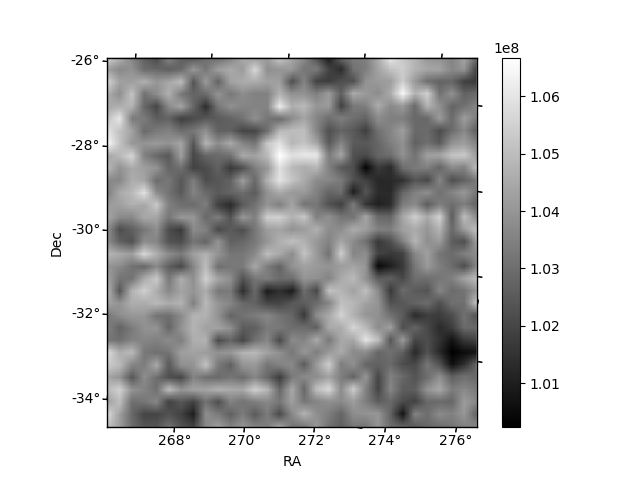
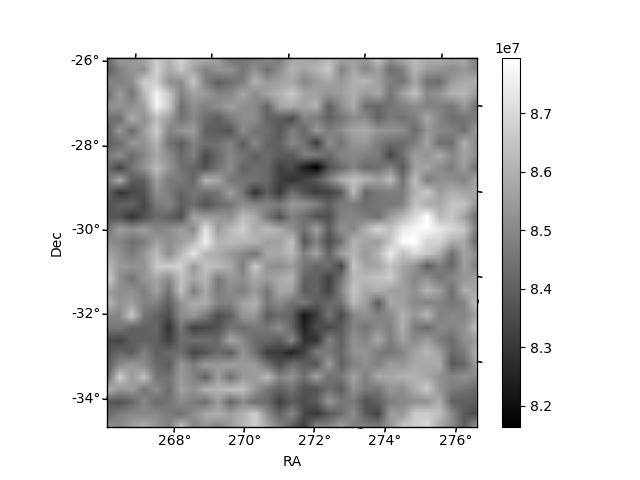
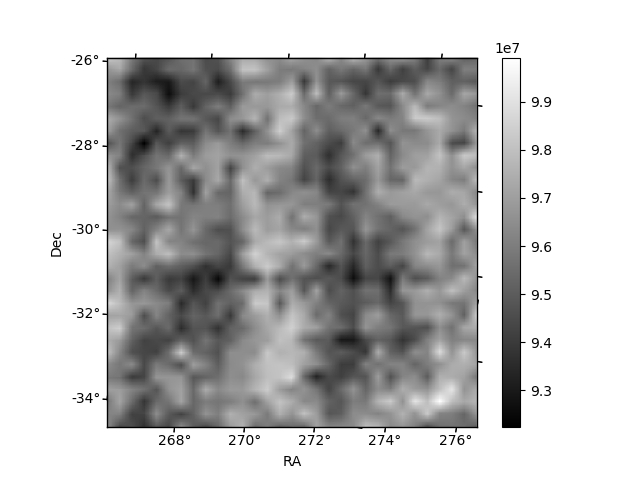
Histogram calculated using DETX and DETY for each event in the final _common_clean file
| Quadrant A | 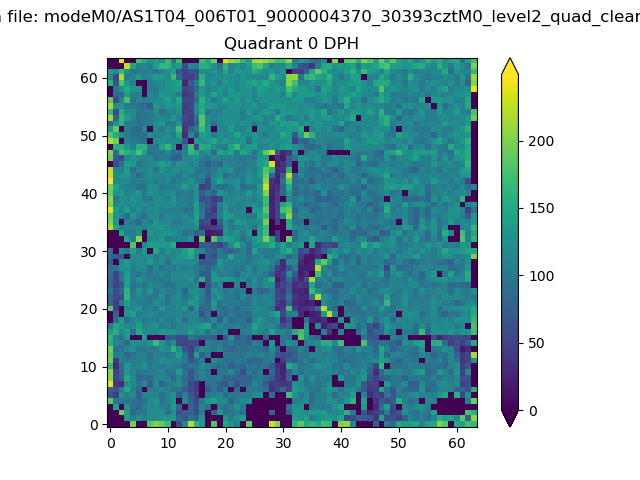 |
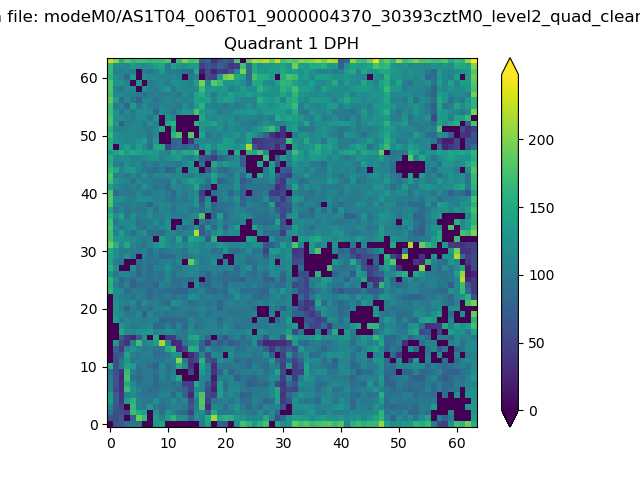 |
Quadrant B |
|---|---|---|---|
| Quadrant D | 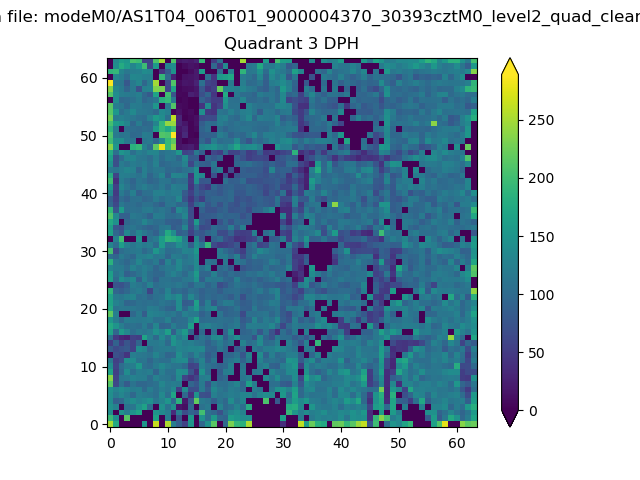 |
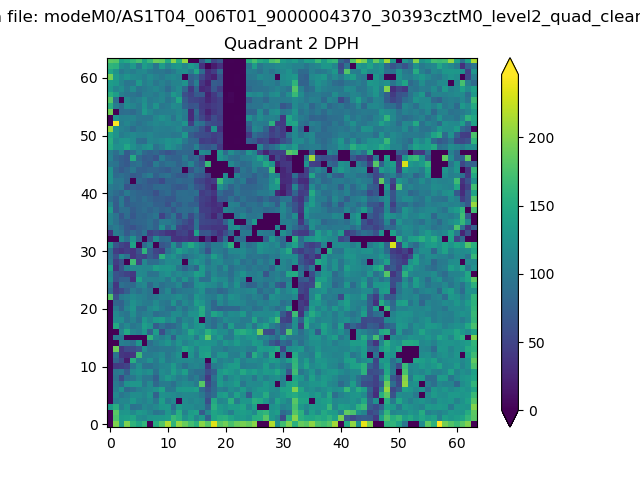 |
Quadrant C |
| Plot type | Count rate plots | Images |
|---|---|---|
| Comparison with Poisson distribution Blue bars denote a histogram of data divided into 1 sec bins. Red curve is a Poisson curve with rate = median count rate of data. |
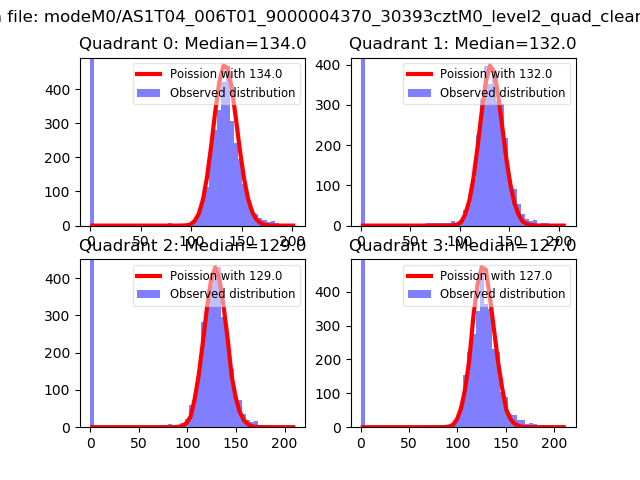 |
 |
| Quadrant-wise count rates Data is divided into 100 sec bins |
 |
|
| Module-wise count rates for Quadrant A Data is divided into 100 sec bins |
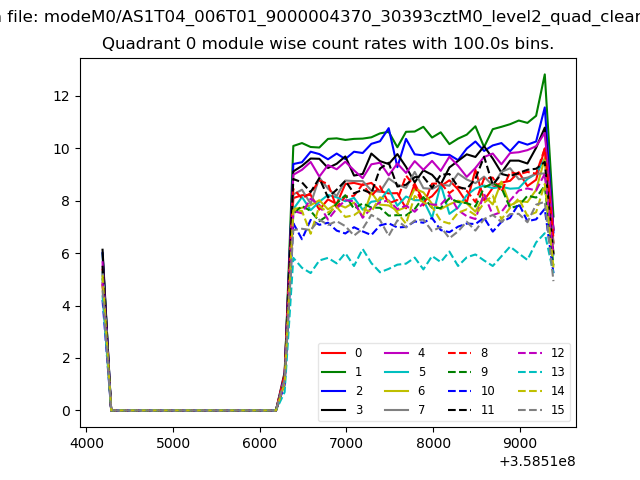 |
 |
| Module-wise count rates for Quadrant B Data is divided into 100 sec bins |
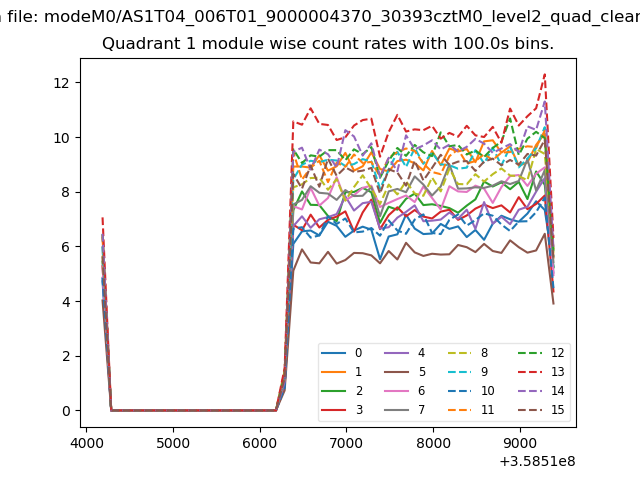 |
 |
| Module-wise count rates for Quadrant C Data is divided into 100 sec bins |
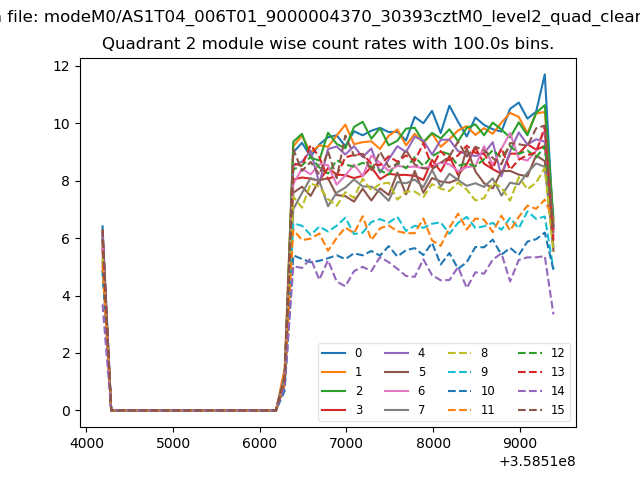 |
 |
| Module-wise count rates for Quadrant D Data is divided into 100 sec bins |
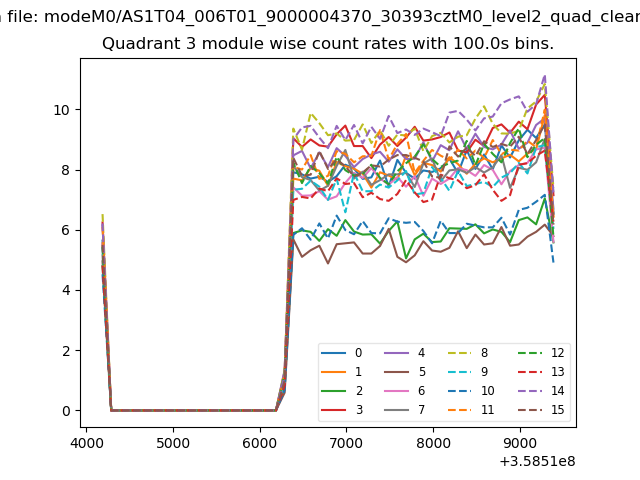 |
 |
| Parameter | Plot |
|---|---|
| CZT HV Monitor | 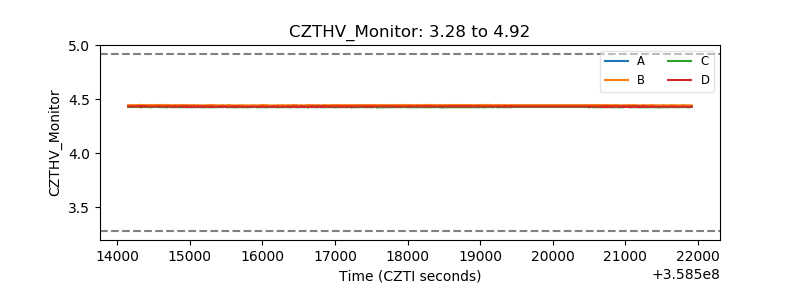 |
| D_VDD | 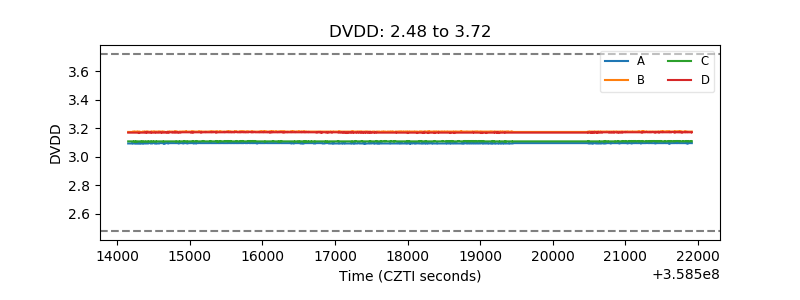 |
| Temperature 1 | 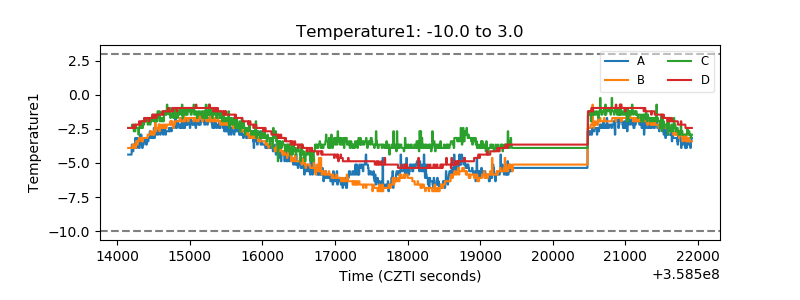 |
| Veto HV Monitor | 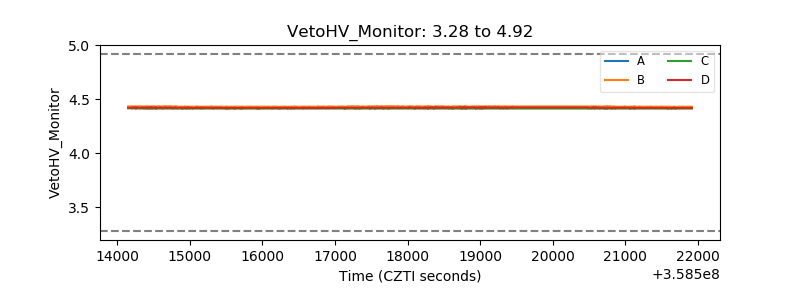 |
| Veto LLD | 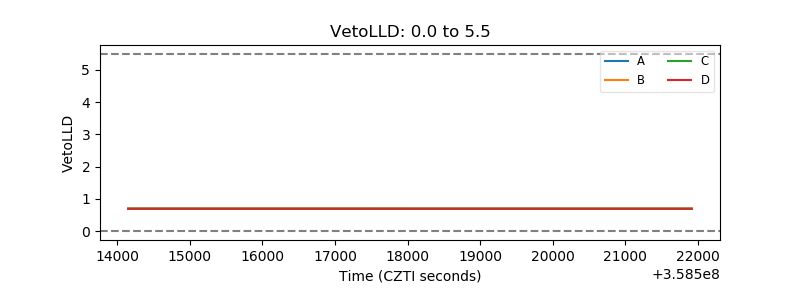 |
| Alpha Counter | 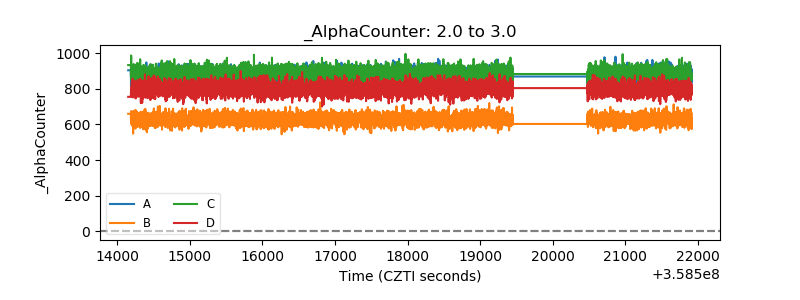 |
| _CPM_Rate | 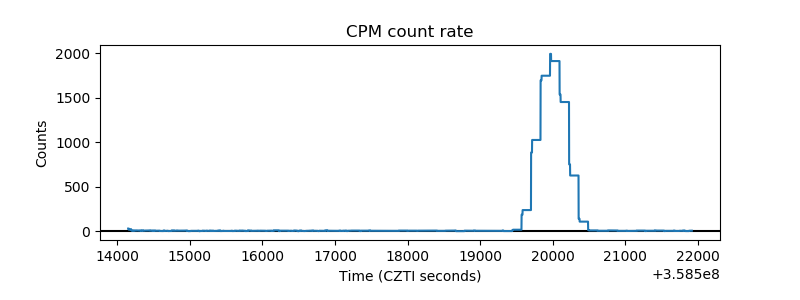 |
| CZT Counter |  |
| +2.5 Volts monitor |  |
| +5 Volts monitor |  |
| _ROLL_ROT | 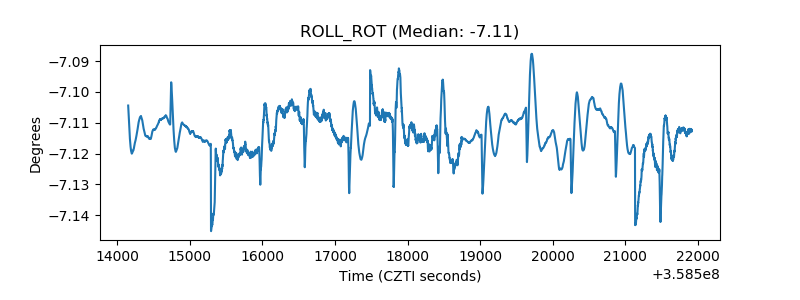 |
| _Roll_DEC | 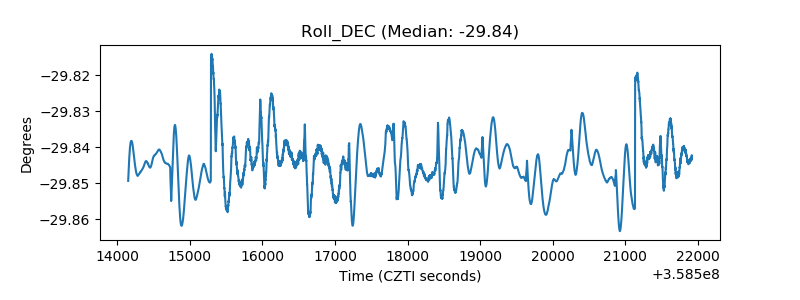 |
| _Roll_RA | 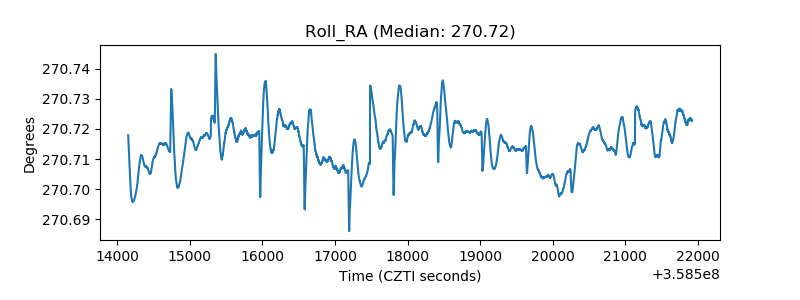 |
| Veto Counter | 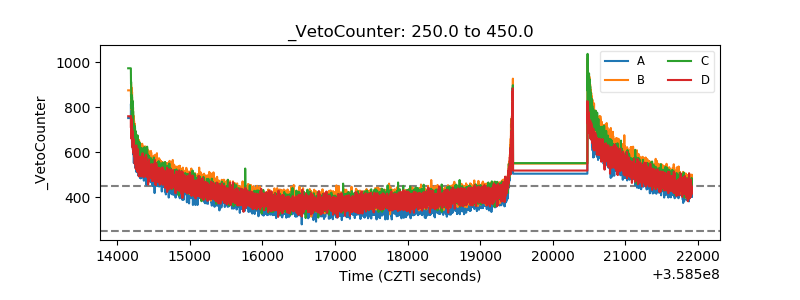 |