| Param | Original file | Final file |
|---|---|---|
| Filename | modeM0/AS1T04_006T01_9000004370_30395cztM0_level2.evt | modeM0/AS1T04_006T01_9000004370_30395cztM0_level2_quad_clean.evt |
| Size (bytes) | 555,943,680 | 78,995,520 |
| Size | 530.2 MB | 75.3 MB |
| Events in quadrant A | 3,625,667 | 482,554 |
| Events in quadrant B | 5,287,422 | 511,045 |
| Events in quadrant C | 3,359,256 | 498,903 |
| Events in quadrant D | 4,148,999 | 471,359 |
| Mode M9 | |||
|---|---|---|---|
| Quadrant | BADHDUFLAG | Total packets | Discarded packets |
| A | 0 | 15 | 0 |
| B | 0 | 16 | 1 |
| C | 0 | 16 | 0 |
| D | 0 | 16 | 0 |
| Mode M0 | |||
|---|---|---|---|
| Quadrant | BADHDUFLAG | Total packets | Discarded packets |
| A | 0 | 15623 | 808 |
| B | 0 | 20885 | 1169 |
| C | 0 | 14642 | 784 |
| D | 0 | 17536 | 1056 |
| Mode SS | |||
|---|---|---|---|
| Quadrant | BADHDUFLAG | Total packets | Discarded packets |
| A | 0 | 132 | 6 |
| B | 0 | 132 | 4 |
| C | 0 | 132 | 4 |
| D | 0 | 132 | 6 |
| Quadrant | Total seconds | Saturated seconds | Saturation percentage |
|---|---|---|---|
| A | 6145 | 121 | 1.969081% |
| B | 6098 | 174 | 2.853395% |
| C | 6144 | 138 | 2.246094% |
| D | 6116 | 195 | 3.188358% |
Noise dominated data is calculated using 1-second bins in cleaned event files. If a bin has >2000 counts, and if more than 50% of those come from <1% of pixels, then it is considered to be noise-dominated and hence unusable.
| Quadrant | # 1 sec bins | Bins with >0 counts | Bins with >2000 counts | High rate bins dominated by noise | Noise dominated (total time) | Noise dominated (detector-on time) | Marked lightcurve |
|---|---|---|---|---|---|---|---|
| A | 7600 | 6263 | 9 | 9 | 0.12% | 0.14% | 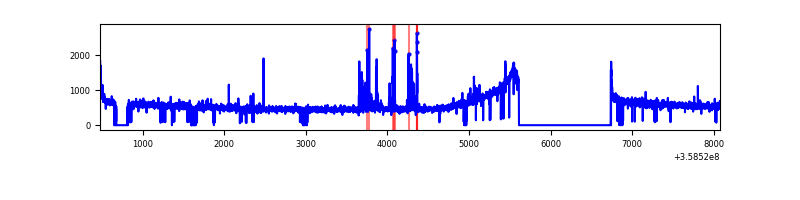 |
| B | 7600 | 6230 | 6 | 6 | 0.08% | 0.10% | 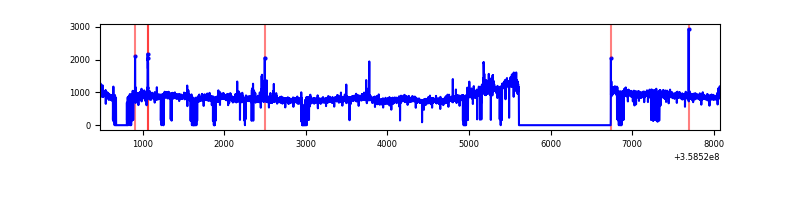 |
| C | 7600 | 6256 | 0 | 0 | 0.00% | 0.00% | 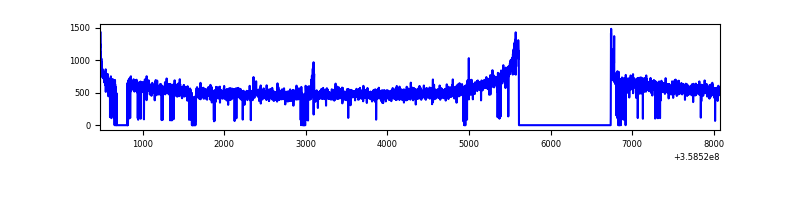 |
| D | 7600 | 6237 | 107 | 107 | 1.41% | 1.72% | 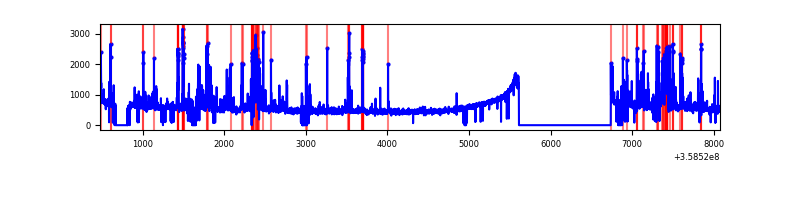 |
Top three noisy pixels from each quadrant. If the there are fewer than three noisy pixels in the level2.evt file, extra rows are filled as -1
| Pixel properties | Quadrant properties | ||||||
|---|---|---|---|---|---|---|---|
| Quadrant | DetID | PixID | Counts | Sigma | Mean | Median | Sigma |
| A | 0 | 13 | 108849 | 586.07 | 896 | 884 | 184.2 |
| A | 11 | 242 | 30727 | 162.0 | 896 | 884 | 184.2 |
| A | 8 | 192 | 22744 | 118.66 | 896 | 884 | 184.2 |
| B | 6 | 159 | 1783766 | 10956.89 | 850 | 833 | 162.7 |
| B | 0 | 229 | 123963 | 756.69 | 850 | 833 | 162.7 |
| B | 0 | 230 | 21078 | 124.41 | 850 | 833 | 162.7 |
| C | 14 | 238 | 130373 | 675.15 | 810 | 818 | 191.9 |
| C | 3 | 233 | 57201 | 293.83 | 810 | 818 | 191.9 |
| C | 2 | 114 | 14766 | 72.69 | 810 | 818 | 191.9 |
| D | 13 | 104 | 213766 | 1029.85 | 844 | 827 | 206.8 |
| D | 13 | 249 | 168647 | 811.64 | 844 | 827 | 206.8 |
| D | 8 | 195 | 162946 | 784.07 | 844 | 827 | 206.8 |
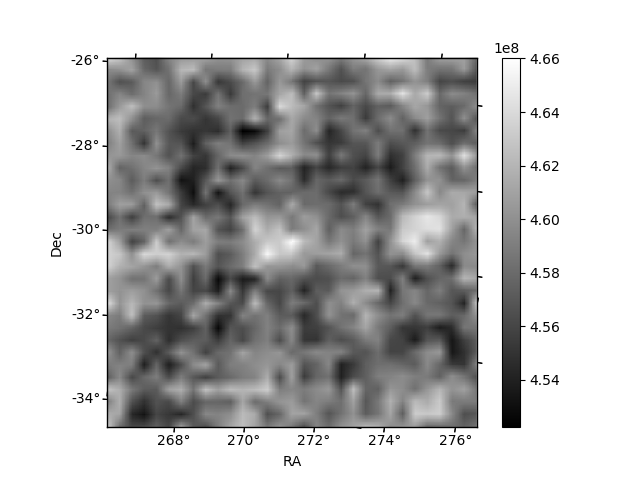
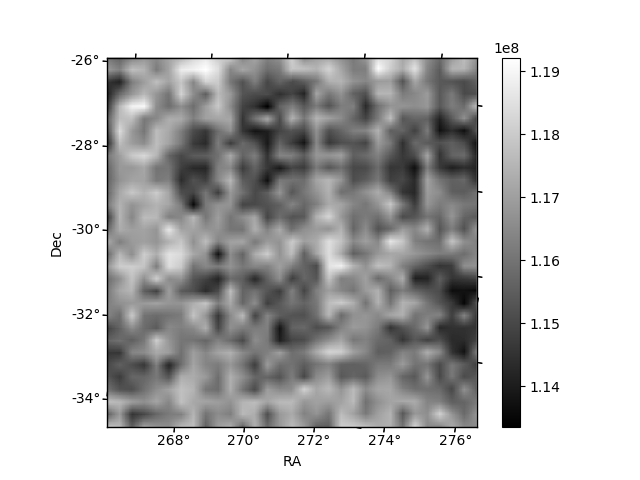
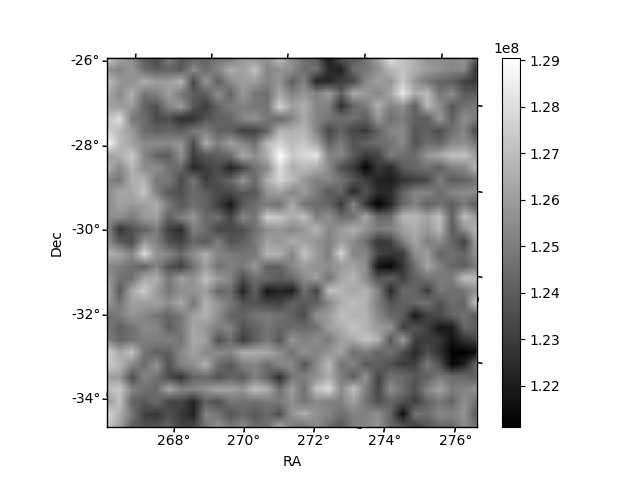
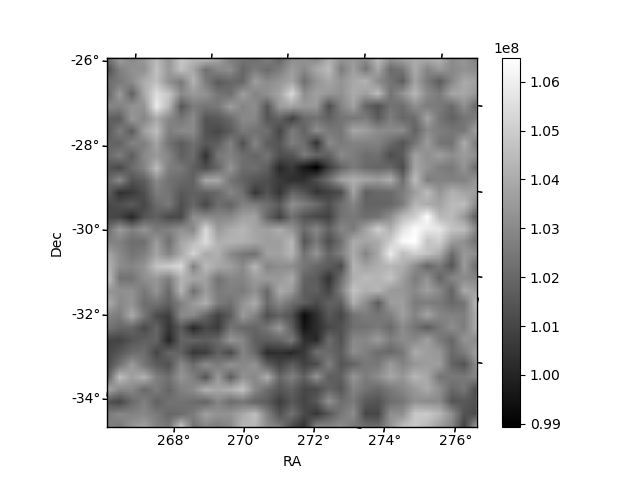
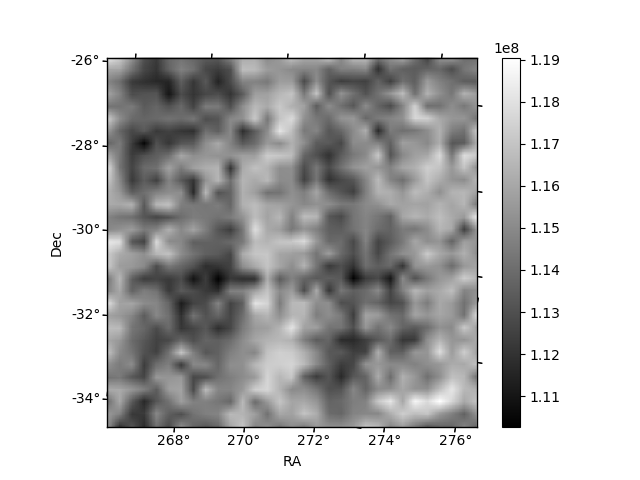
Histogram calculated using DETX and DETY for each event in the final _common_clean file
| Quadrant A | 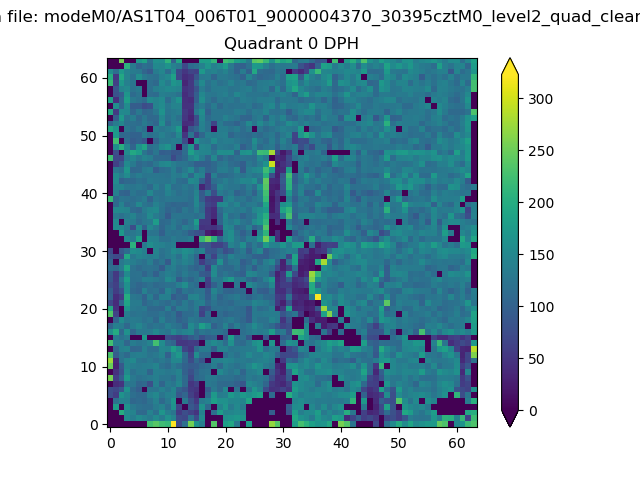 |
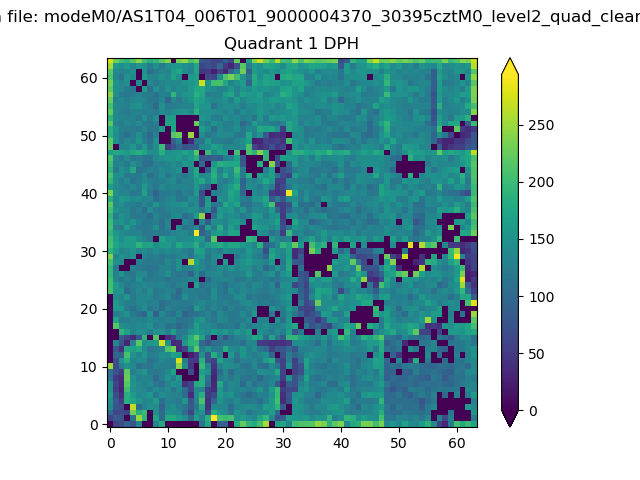 |
Quadrant B |
|---|---|---|---|
| Quadrant D | 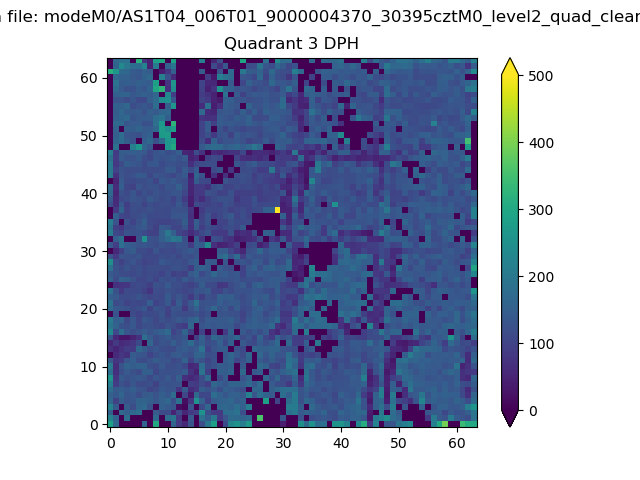 |
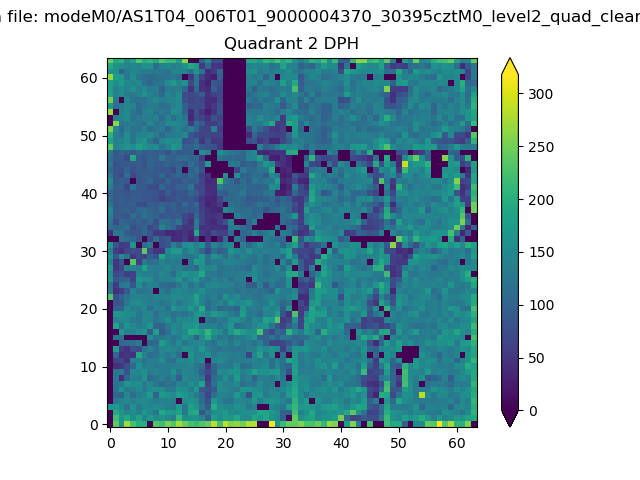 |
Quadrant C |
| Plot type | Count rate plots | Images |
|---|---|---|
| Comparison with Poisson distribution Blue bars denote a histogram of data divided into 1 sec bins. Red curve is a Poisson curve with rate = median count rate of data. |
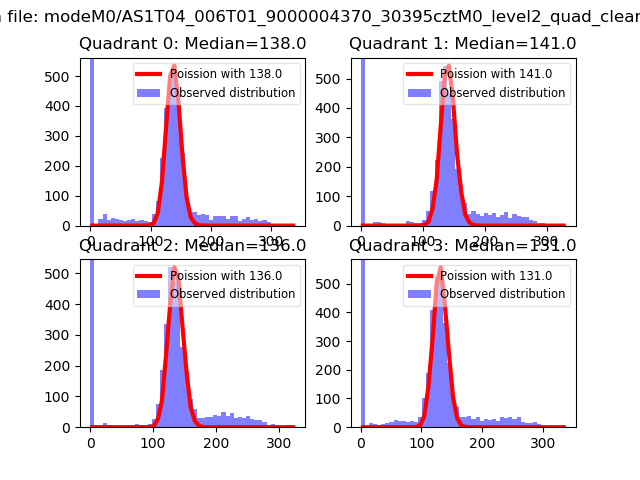 |
 |
| Quadrant-wise count rates Data is divided into 100 sec bins |
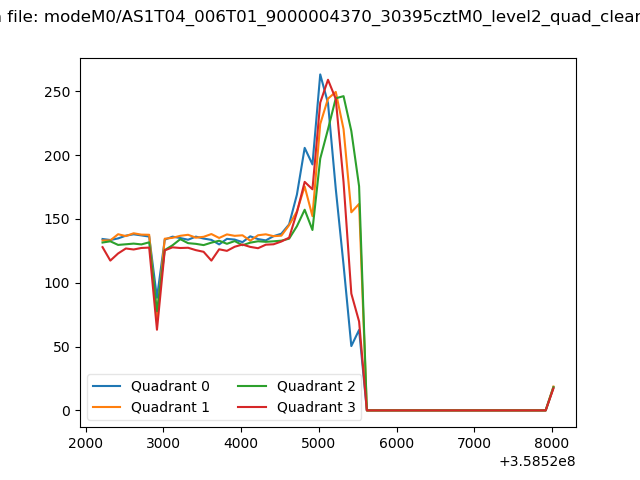 |
|
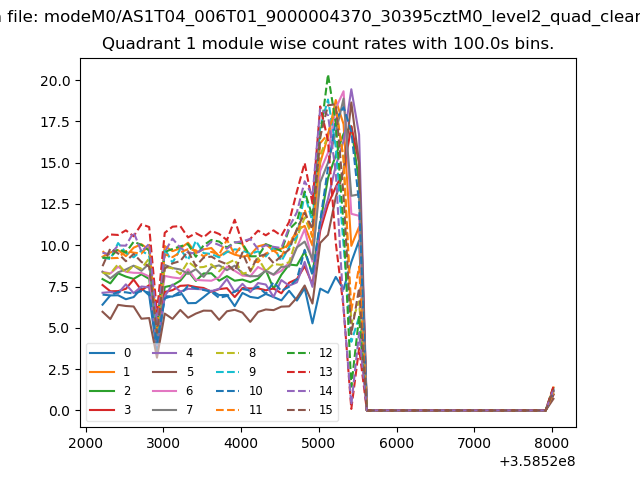
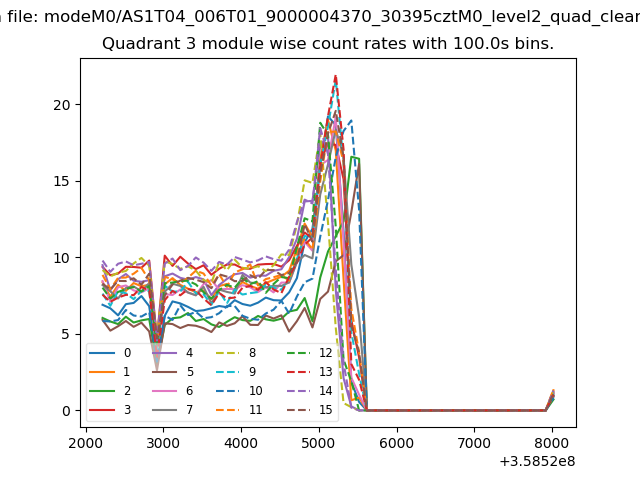
| Module-wise count rates for Quadrant A Data is divided into 100 sec bins |
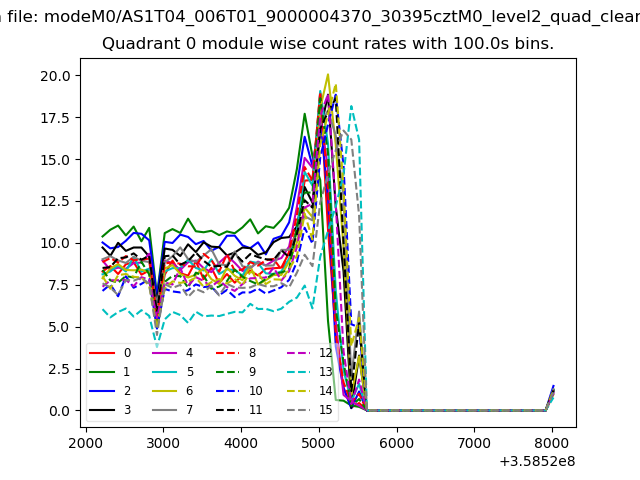 |
 |
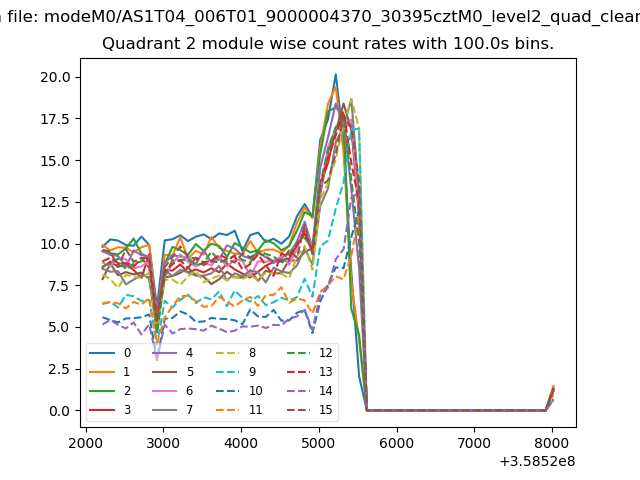
| Module-wise count rates for Quadrant B Data is divided into 100 sec bins |
 |
 |
| Module-wise count rates for Quadrant C Data is divided into 100 sec bins |
 |
 |
| Module-wise count rates for Quadrant D Data is divided into 100 sec bins |
 |
 |
| Parameter | Plot |
|---|---|
| CZT HV Monitor | 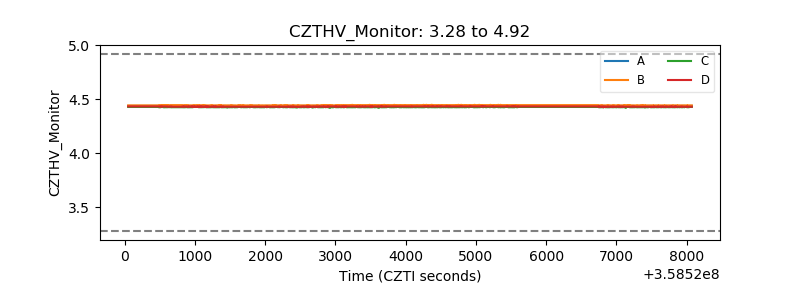 |
| D_VDD | 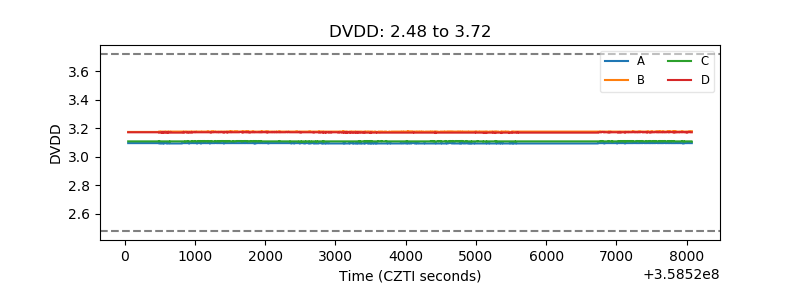 |
| Temperature 1 | 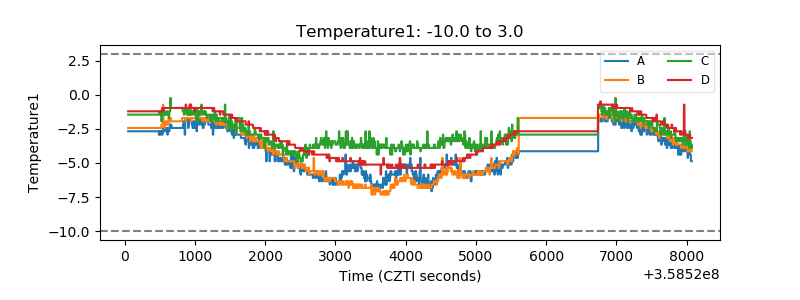 |
| Veto HV Monitor | 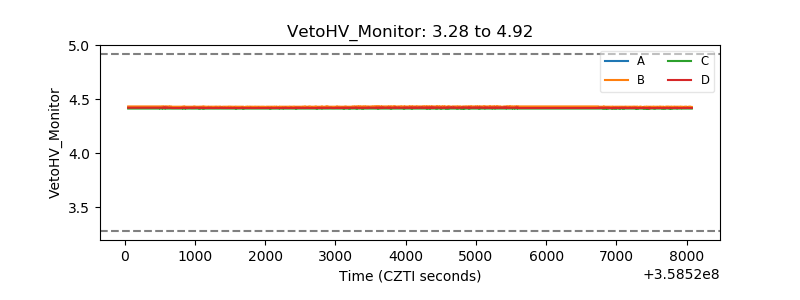 |
| Veto LLD | 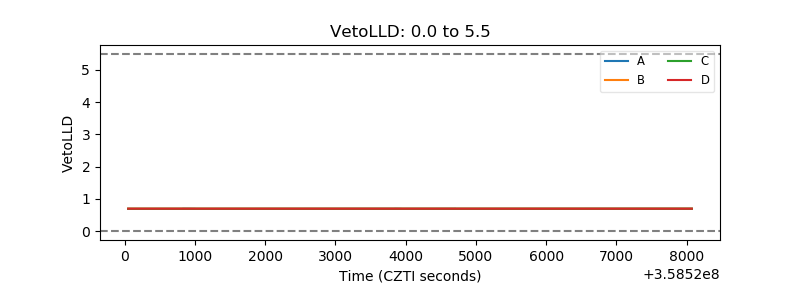 |
| Alpha Counter | 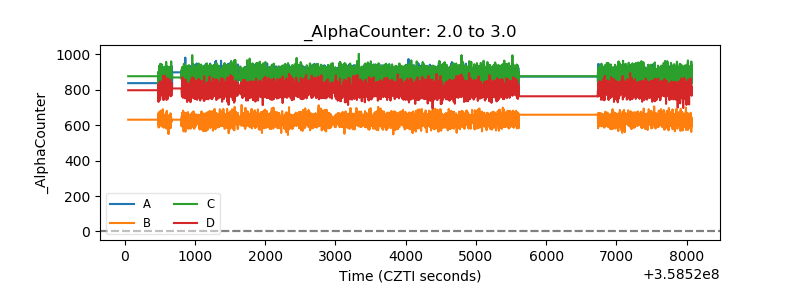 |
| _CPM_Rate | 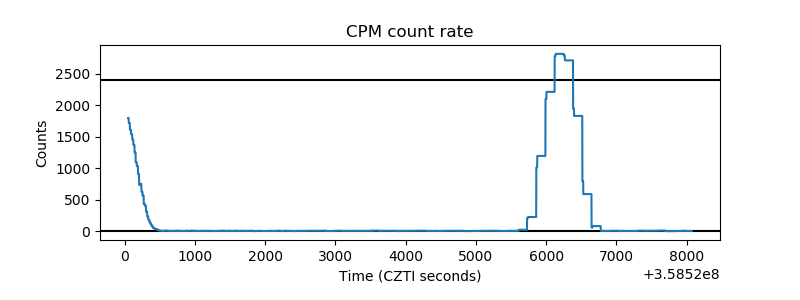 |
| CZT Counter | 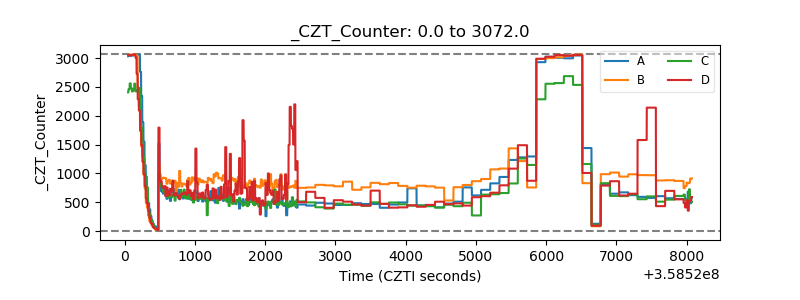 |
| +2.5 Volts monitor |  |
| +5 Volts monitor |  |
| _ROLL_ROT | 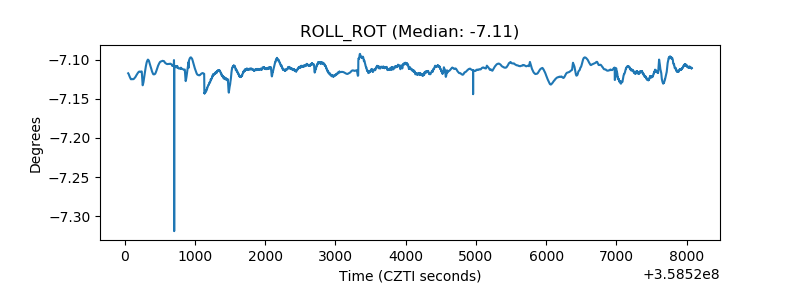 |
| _Roll_DEC | 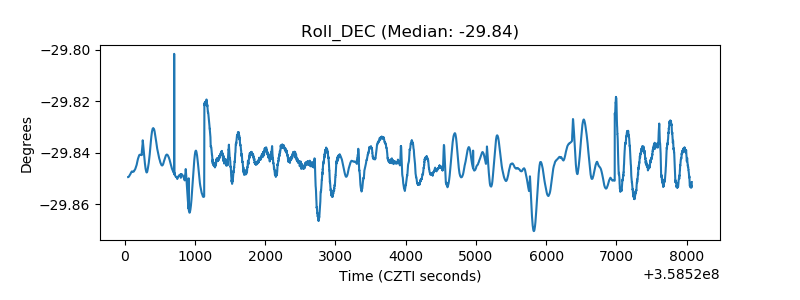 |
| _Roll_RA | 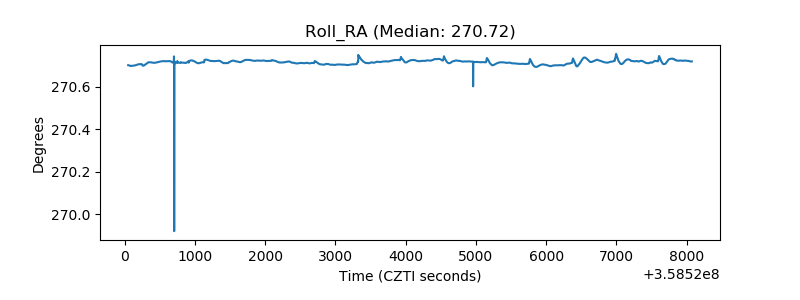 |
| Veto Counter | 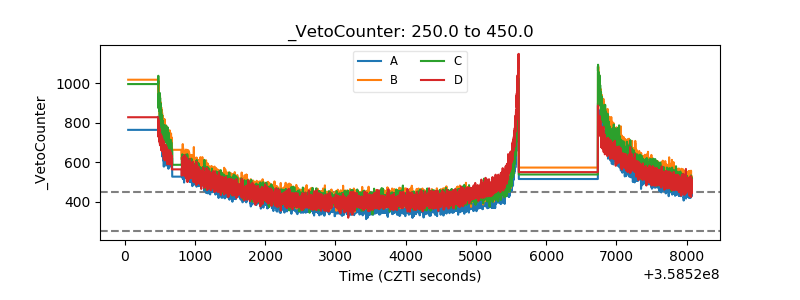 |