| Param | Original file | Final file |
|---|---|---|
| Filename | modeM0/AS1T04_006T01_9000004370_30396cztM0_level2.evt | modeM0/AS1T04_006T01_9000004370_30396cztM0_level2_quad_clean.evt |
| Size (bytes) | 565,303,680 | 94,775,040 |
| Size | 539.1 MB | 90.4 MB |
| Events in quadrant A | 3,705,715 | 624,192 |
| Events in quadrant B | 5,461,349 | 624,682 |
| Events in quadrant C | 3,469,380 | 590,621 |
| Events in quadrant D | 4,053,235 | 586,882 |
| Mode M9 | |||
|---|---|---|---|
| Quadrant | BADHDUFLAG | Total packets | Discarded packets |
| A | 0 | 21 | 0 |
| B | 0 | 22 | 0 |
| C | 0 | 22 | 0 |
| D | 0 | 22 | 0 |
| Mode M0 | |||
|---|---|---|---|
| Quadrant | BADHDUFLAG | Total packets | Discarded packets |
| A | 0 | 15183 | 2 |
| B | 0 | 20381 | 2 |
| C | 0 | 14264 | 2 |
| D | 0 | 16245 | 3 |
| Mode SS | |||
|---|---|---|---|
| Quadrant | BADHDUFLAG | Total packets | Discarded packets |
| A | 0 | 130 | 0 |
| B | 0 | 130 | 0 |
| C | 0 | 130 | 0 |
| D | 0 | 130 | 0 |
| Quadrant | Total seconds | Saturated seconds | Saturation percentage |
|---|---|---|---|
| A | 6358 | 166 | 2.610884% |
| B | 6358 | 161 | 2.532243% |
| C | 6358 | 123 | 1.934571% |
| D | 6357 | 187 | 2.941639% |
Noise dominated data is calculated using 1-second bins in cleaned event files. If a bin has >2000 counts, and if more than 50% of those come from <1% of pixels, then it is considered to be noise-dominated and hence unusable.
| Quadrant | # 1 sec bins | Bins with >0 counts | Bins with >2000 counts | High rate bins dominated by noise | Noise dominated (total time) | Noise dominated (detector-on time) | Marked lightcurve |
|---|---|---|---|---|---|---|---|
| A | 7583 | 6358 | 47 | 47 | 0.62% | 0.74% | 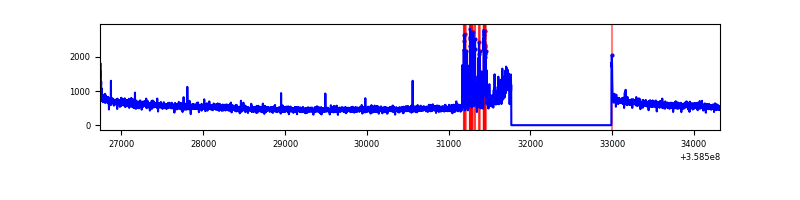 |
| B | 7583 | 6358 | 5 | 5 | 0.07% | 0.08% | 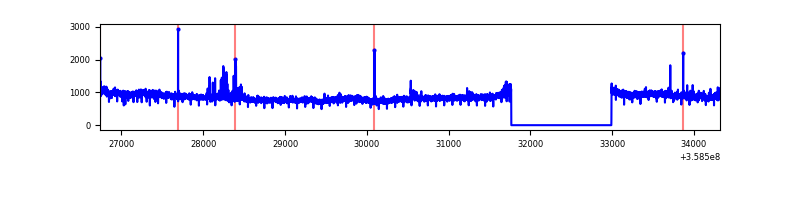 |
| C | 7583 | 6358 | 0 | 0 | 0.00% | 0.00% | 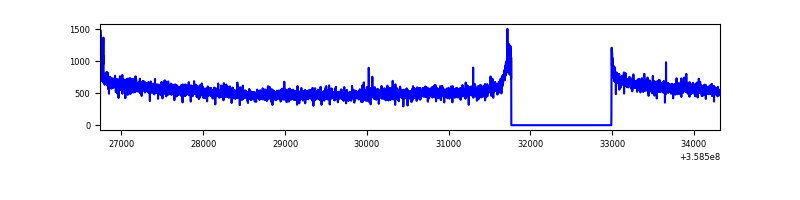 |
| D | 7582 | 6357 | 93 | 93 | 1.23% | 1.46% | 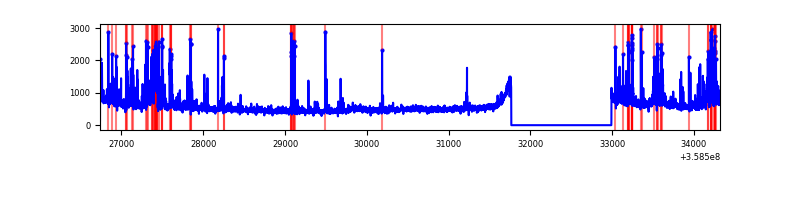 |
Top three noisy pixels from each quadrant. If the there are fewer than three noisy pixels in the level2.evt file, extra rows are filled as -1
| Pixel properties | Quadrant properties | ||||||
|---|---|---|---|---|---|---|---|
| Quadrant | DetID | PixID | Counts | Sigma | Mean | Median | Sigma |
| A | 0 | 13 | 237571 | 1359.79 | 886 | 871 | 174.1 |
| A | 8 | 192 | 24814 | 137.55 | 886 | 871 | 174.1 |
| A | 11 | 242 | 18355 | 100.44 | 886 | 871 | 174.1 |
| B | 6 | 159 | 1881349 | 11445.73 | 878 | 862 | 164.3 |
| B | 0 | 229 | 118652 | 716.94 | 878 | 862 | 164.3 |
| B | 12 | 111 | 18843 | 109.44 | 878 | 862 | 164.3 |
| C | 14 | 238 | 139029 | 712.93 | 838 | 846 | 193.8 |
| C | 3 | 233 | 41265 | 208.53 | 838 | 846 | 193.8 |
| C | 2 | 114 | 15499 | 75.6 | 838 | 846 | 193.8 |
| D | 8 | 195 | 225452 | 1026.56 | 837 | 824 | 218.8 |
| D | 13 | 138 | 192625 | 876.54 | 837 | 824 | 218.8 |
| D | 13 | 249 | 187396 | 852.65 | 837 | 824 | 218.8 |
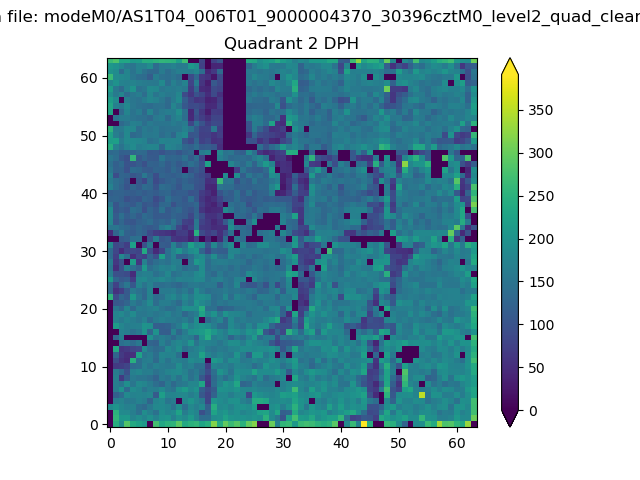
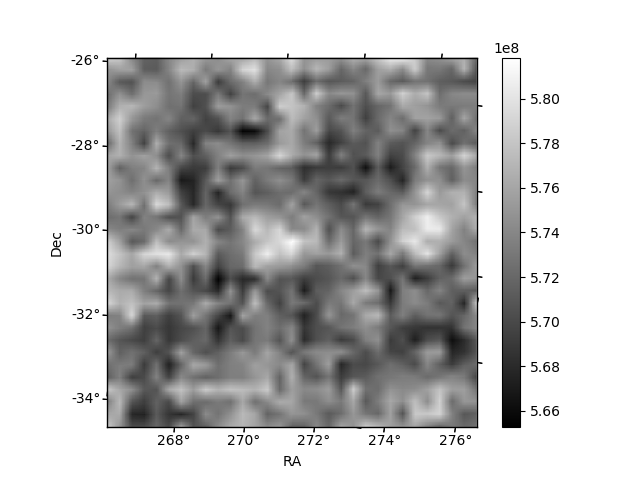
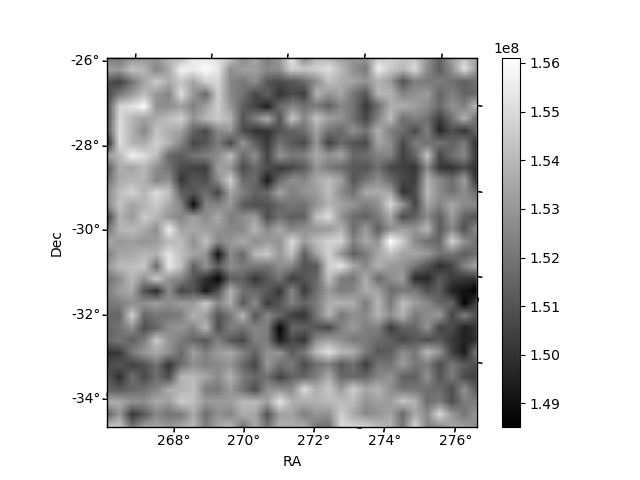
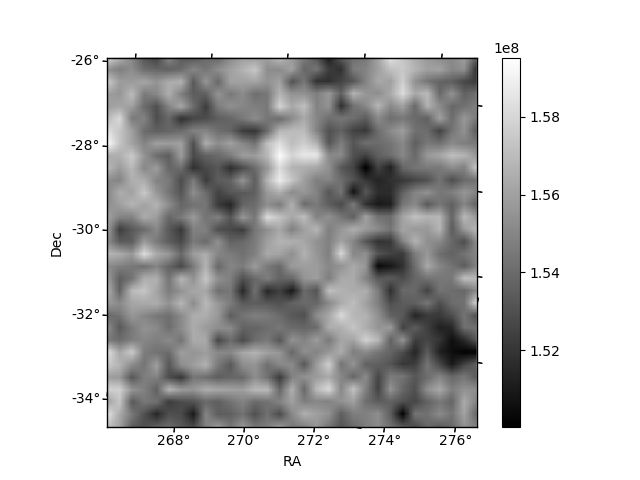
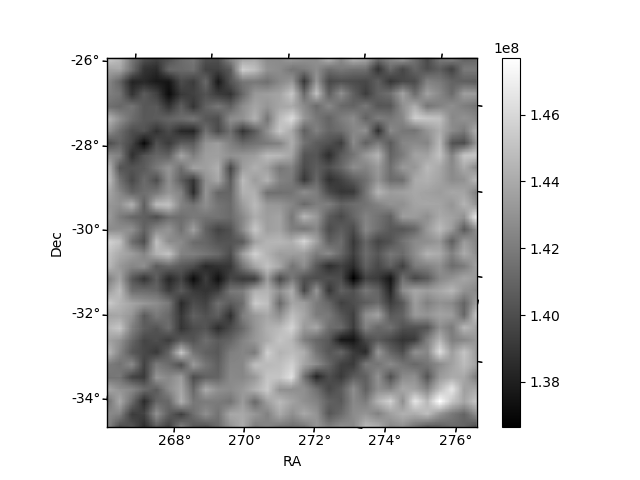
Histogram calculated using DETX and DETY for each event in the final _common_clean file
| Quadrant A | 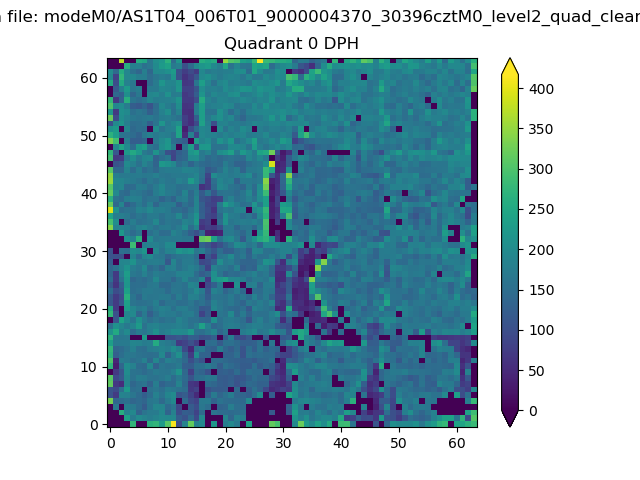 |
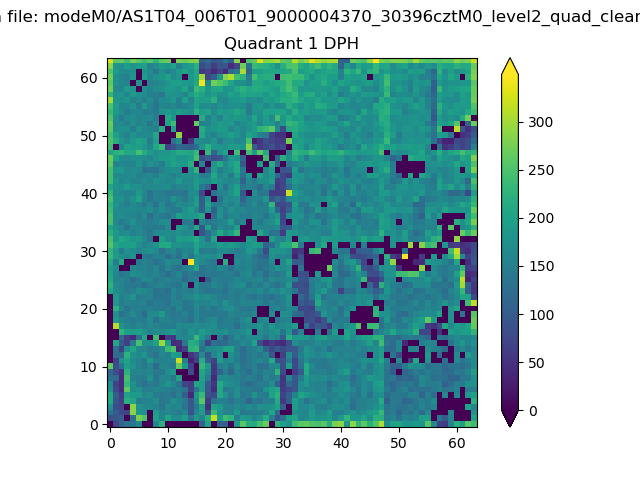 |
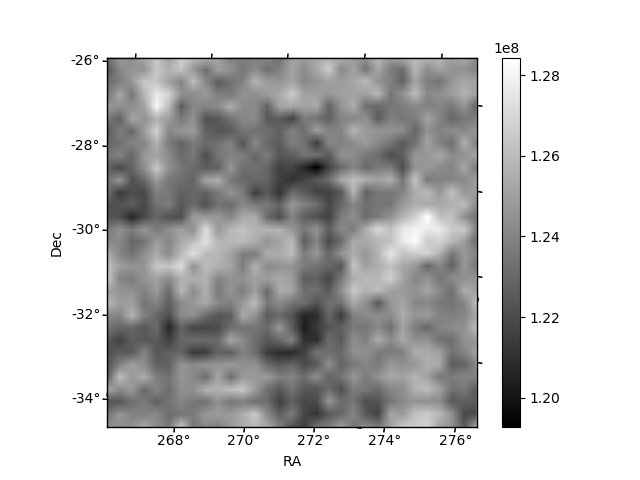
Quadrant B |
|---|---|---|---|
| Quadrant D | 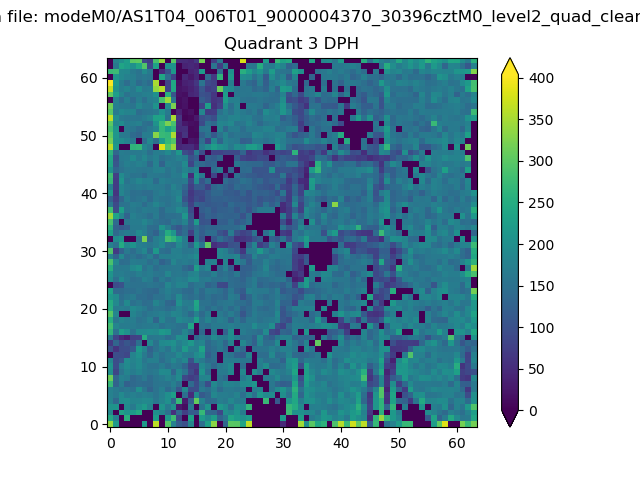 |
 |
Quadrant C |
| Plot type | Count rate plots | Images |
|---|---|---|
| Comparison with Poisson distribution Blue bars denote a histogram of data divided into 1 sec bins. Red curve is a Poisson curve with rate = median count rate of data. |
 |
 |
| Quadrant-wise count rates Data is divided into 100 sec bins |
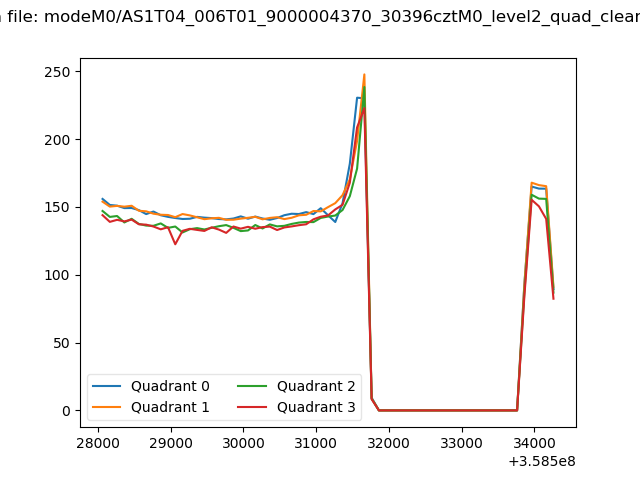 |
|
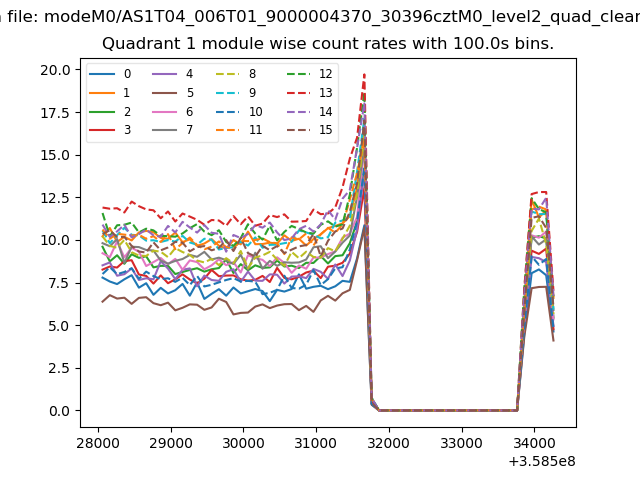
| Module-wise count rates for Quadrant A Data is divided into 100 sec bins |
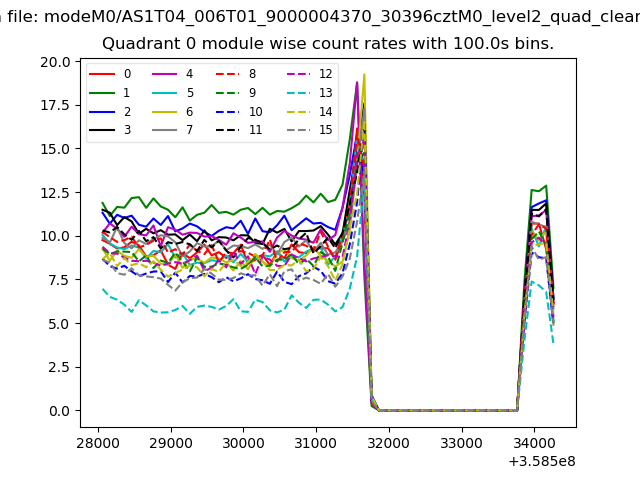 |
 |
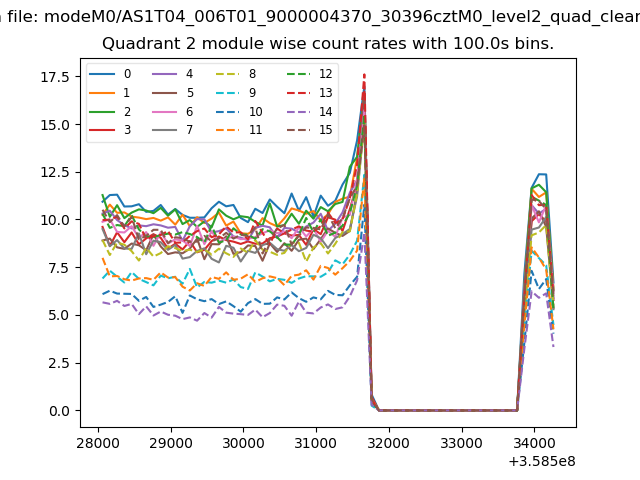
| Module-wise count rates for Quadrant B Data is divided into 100 sec bins |
 |
 |
| Module-wise count rates for Quadrant C Data is divided into 100 sec bins |
 |
 |
| Module-wise count rates for Quadrant D Data is divided into 100 sec bins |
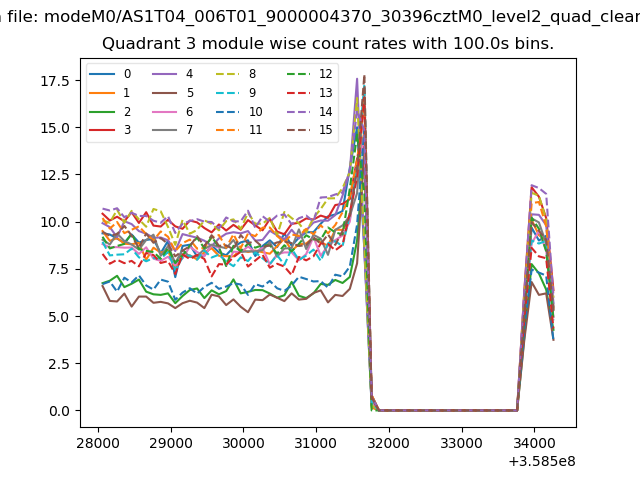 |
 |
| Parameter | Plot |
|---|---|
| CZT HV Monitor | 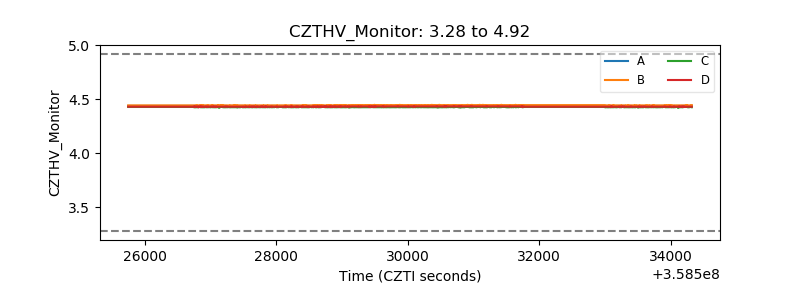 |
| D_VDD | 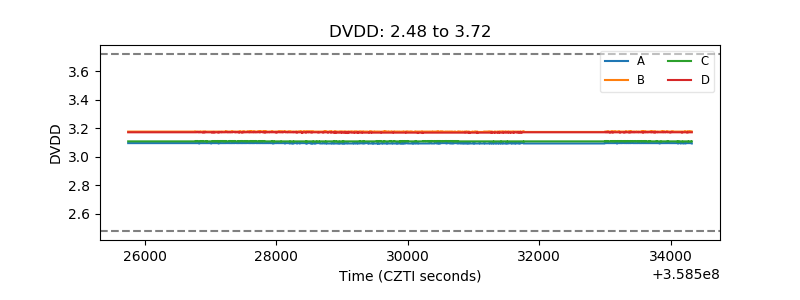 |
| Temperature 1 | 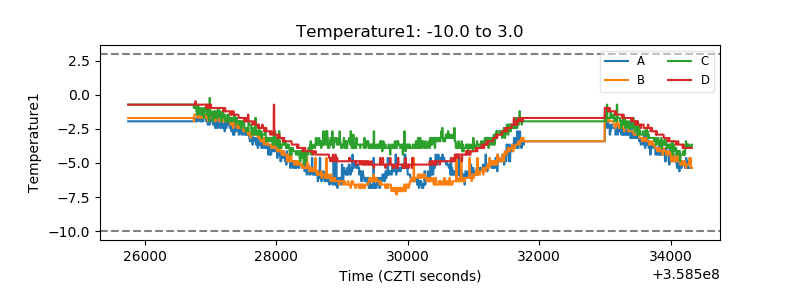 |
| Veto HV Monitor | 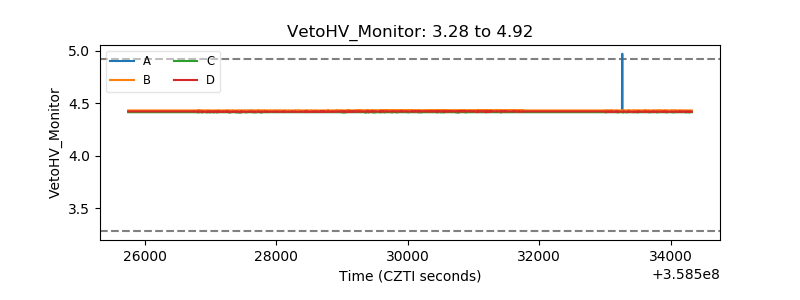 |
| Veto LLD | 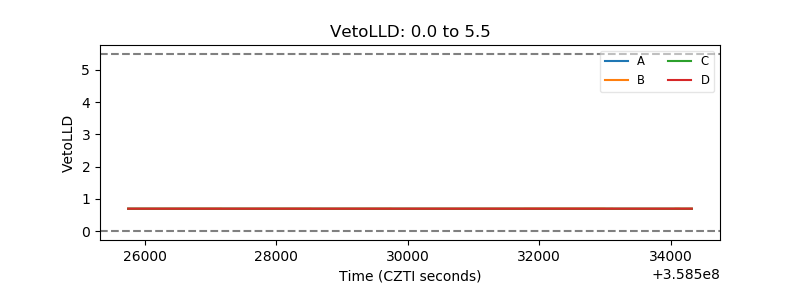 |
| Alpha Counter |  |
| _CPM_Rate |  |
| CZT Counter | 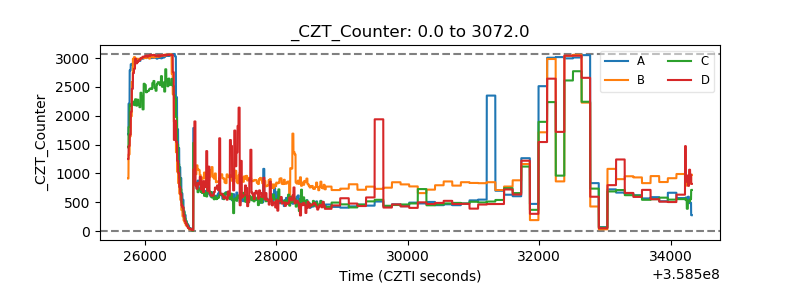 |
| +2.5 Volts monitor |  |
| +5 Volts monitor |  |
| _ROLL_ROT | 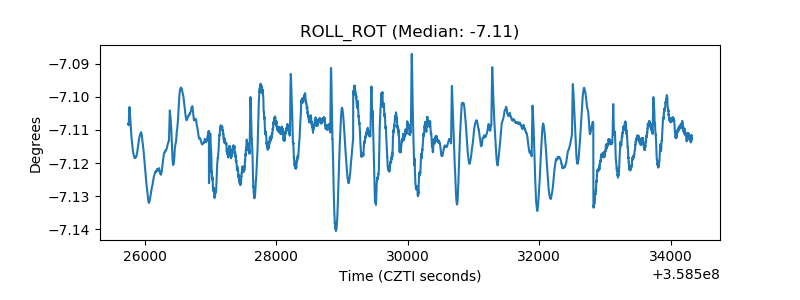 |
| _Roll_DEC | 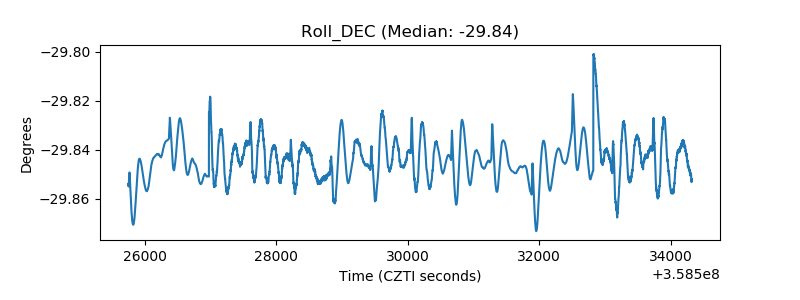 |
| _Roll_RA | 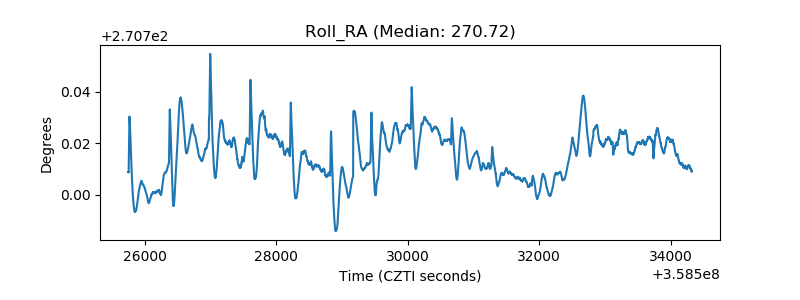 |
| Veto Counter | 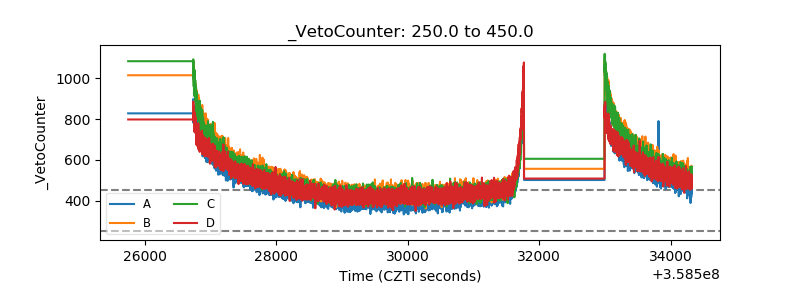 |