| Param | Original file | Final file |
|---|---|---|
| Filename | modeM0/AS1T04_006T01_9000004370_30397cztM0_level2.evt | modeM0/AS1T04_006T01_9000004370_30397cztM0_level2_quad_clean.evt |
| Size (bytes) | 314,936,640 | 58,648,320 |
| Size | 300.3 MB | 55.9 MB |
| Events in quadrant A | 1,894,378 | 394,432 |
| Events in quadrant B | 2,928,435 | 398,370 |
| Events in quadrant C | 1,883,445 | 375,219 |
| Events in quadrant D | 2,597,071 | 363,701 |
| Mode M9 | |||
|---|---|---|---|
| Quadrant | BADHDUFLAG | Total packets | Discarded packets |
| A | 0 | 12 | 0 |
| B | 0 | 12 | 0 |
| C | 0 | 12 | 0 |
| D | 0 | 12 | 0 |
| Mode M0 | |||
|---|---|---|---|
| Quadrant | BADHDUFLAG | Total packets | Discarded packets |
| A | 0 | 7877 | 1 |
| B | 0 | 11031 | 1 |
| C | 0 | 7765 | 1 |
| D | 0 | 10171 | 1 |
| Mode SS | |||
|---|---|---|---|
| Quadrant | BADHDUFLAG | Total packets | Discarded packets |
| A | 0 | 72 | 0 |
| B | 0 | 72 | 0 |
| C | 0 | 72 | 0 |
| D | 0 | 72 | 0 |
| Quadrant | Total seconds | Saturated seconds | Saturation percentage |
|---|---|---|---|
| A | 3439 | 89 | 2.587962% |
| B | 3440 | 112 | 3.255814% |
| C | 3440 | 74 | 2.151163% |
| D | 3440 | 99 | 2.877907% |
Noise dominated data is calculated using 1-second bins in cleaned event files. If a bin has >2000 counts, and if more than 50% of those come from <1% of pixels, then it is considered to be noise-dominated and hence unusable.
| Quadrant | # 1 sec bins | Bins with >0 counts | Bins with >2000 counts | High rate bins dominated by noise | Noise dominated (total time) | Noise dominated (detector-on time) | Marked lightcurve |
|---|---|---|---|---|---|---|---|
| A | 4664 | 3439 | 1 | 1 | 0.02% | 0.03% | 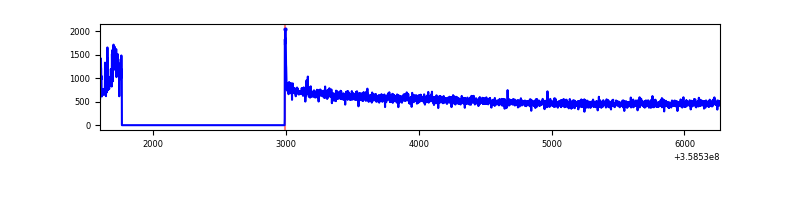 |
| B | 4665 | 3440 | 3 | 3 | 0.06% | 0.09% | 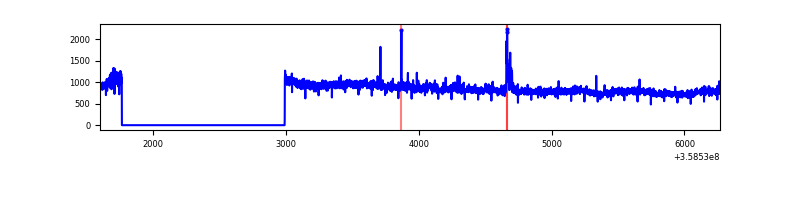 |
| C | 4665 | 3440 | 0 | 0 | 0.00% | 0.00% | 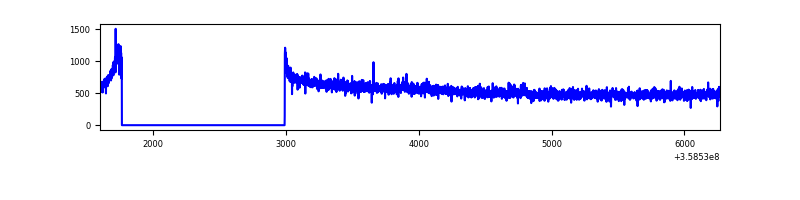 |
| D | 4665 | 3440 | 43 | 43 | 0.92% | 1.25% | 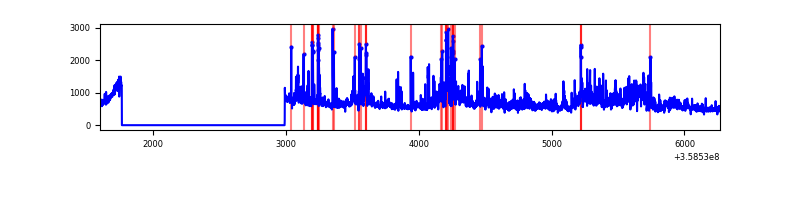 |
Top three noisy pixels from each quadrant. If the there are fewer than three noisy pixels in the level2.evt file, extra rows are filled as -1
| Pixel properties | Quadrant properties | ||||||
|---|---|---|---|---|---|---|---|
| Quadrant | DetID | PixID | Counts | Sigma | Mean | Median | Sigma |
| A | 0 | 13 | 22002 | 225.41 | 480 | 472 | 95.5 |
| A | 8 | 192 | 12690 | 127.92 | 480 | 472 | 95.5 |
| A | 13 | 254 | 7200 | 70.44 | 480 | 472 | 95.5 |
| B | 6 | 159 | 996465 | 10918.12 | 476 | 465 | 91.2 |
| B | 0 | 229 | 69029 | 751.6 | 476 | 465 | 91.2 |
| B | 12 | 111 | 10056 | 105.14 | 476 | 465 | 91.2 |
| C | 14 | 238 | 74370 | 694.66 | 454 | 457 | 106.4 |
| C | 3 | 233 | 30946 | 286.55 | 454 | 457 | 106.4 |
| C | 2 | 114 | 8443 | 75.06 | 454 | 457 | 106.4 |
| D | 8 | 195 | 590787 | 5236.87 | 452 | 443 | 112.7 |
| D | 13 | 249 | 111304 | 983.43 | 452 | 443 | 112.7 |
| D | 13 | 138 | 66875 | 589.31 | 452 | 443 | 112.7 |
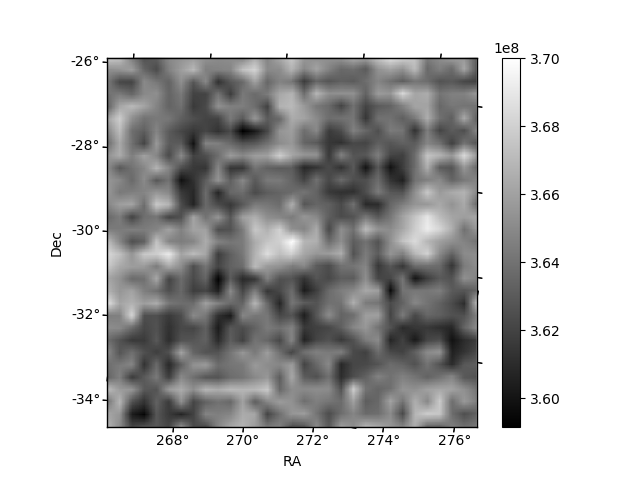
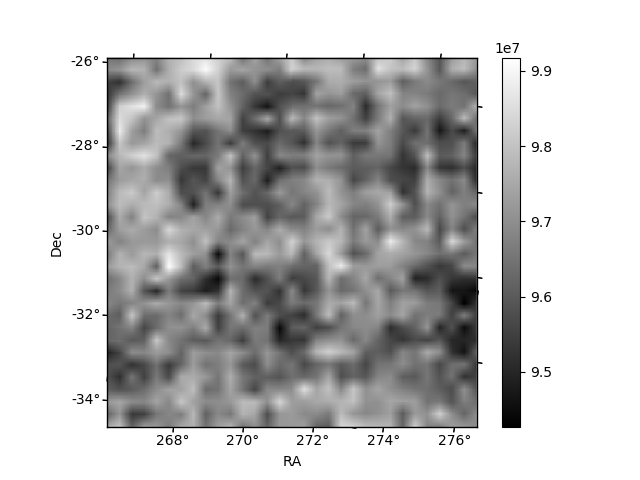
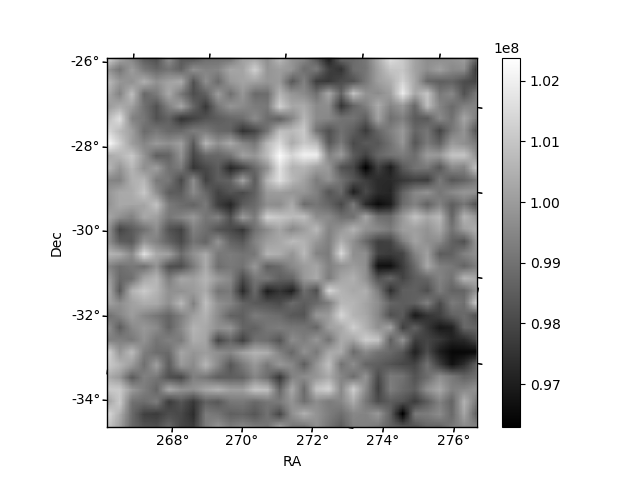
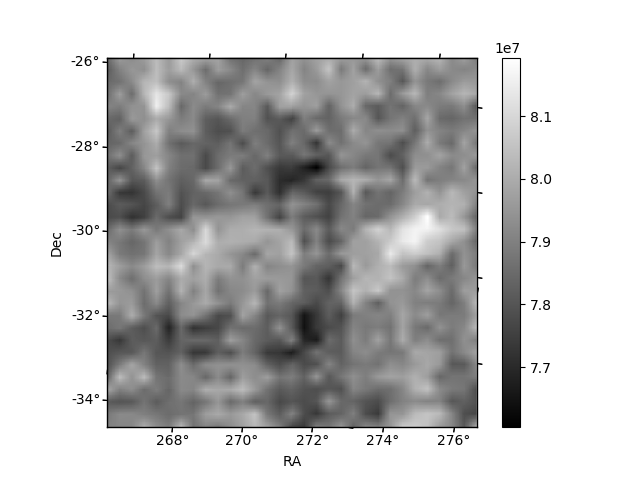
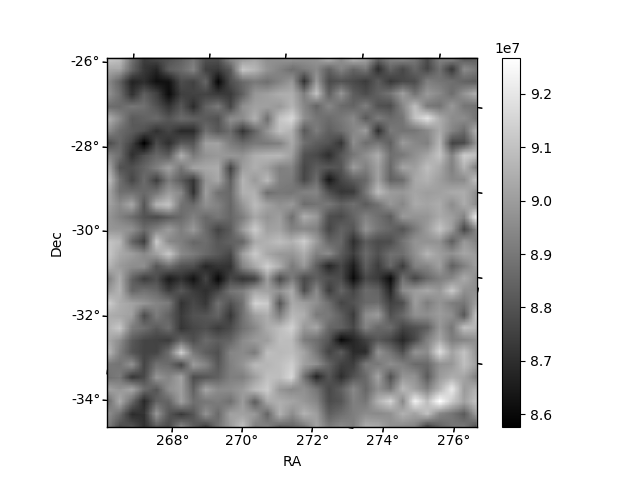
Histogram calculated using DETX and DETY for each event in the final _common_clean file
| Quadrant A | 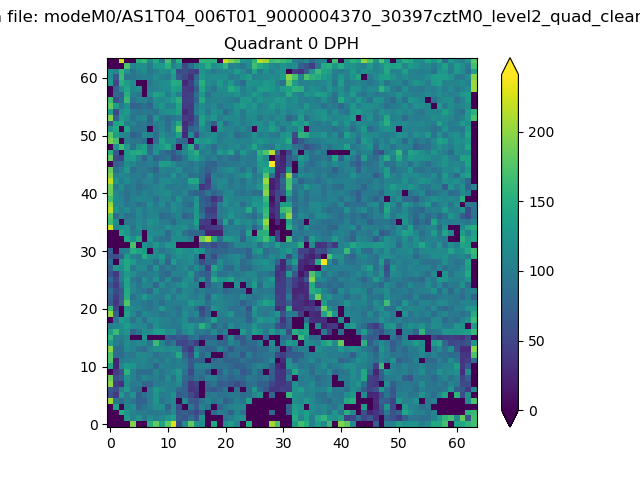 |
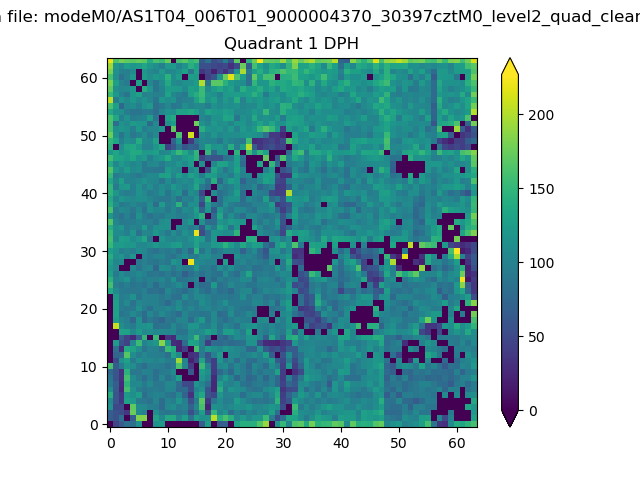 |
Quadrant B |
|---|---|---|---|
| Quadrant D | 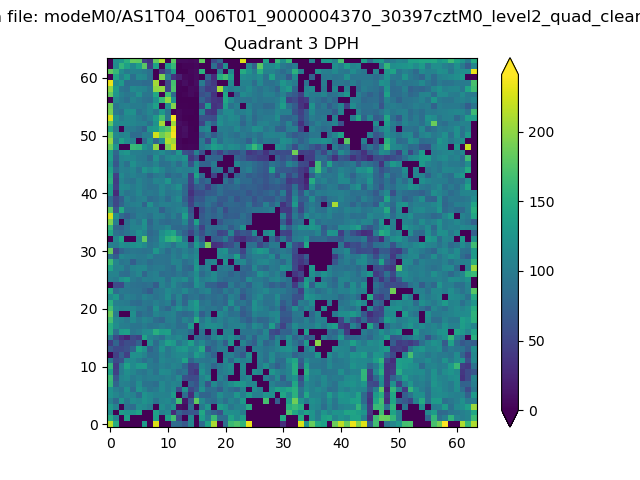 |
 |
Quadrant C |
| Plot type | Count rate plots | Images |
|---|---|---|
| Comparison with Poisson distribution Blue bars denote a histogram of data divided into 1 sec bins. Red curve is a Poisson curve with rate = median count rate of data. |
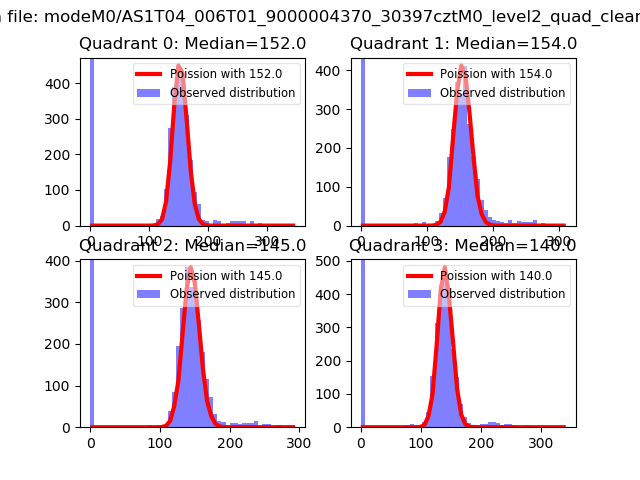 |
 |
| Quadrant-wise count rates Data is divided into 100 sec bins |
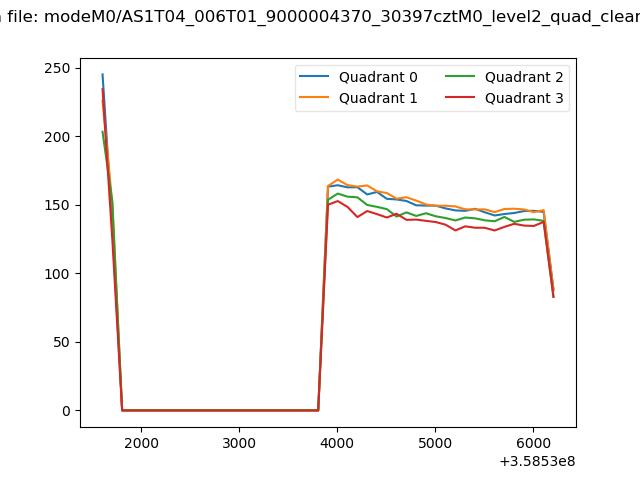 |
|
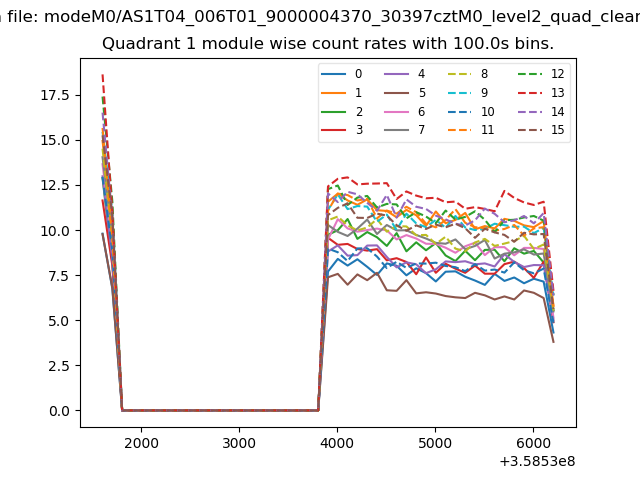
| Module-wise count rates for Quadrant A Data is divided into 100 sec bins |
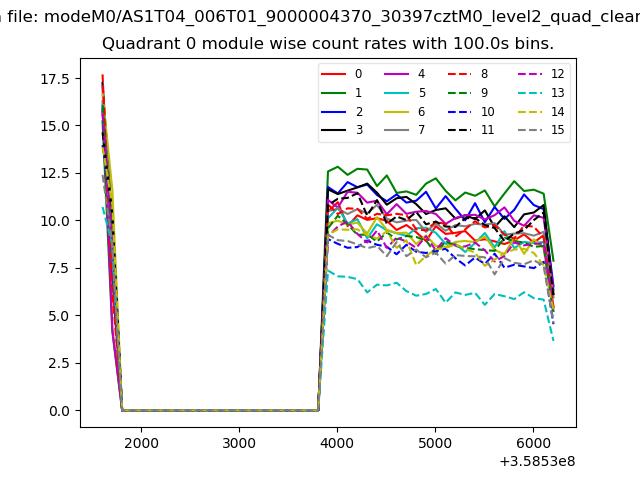 |
 |
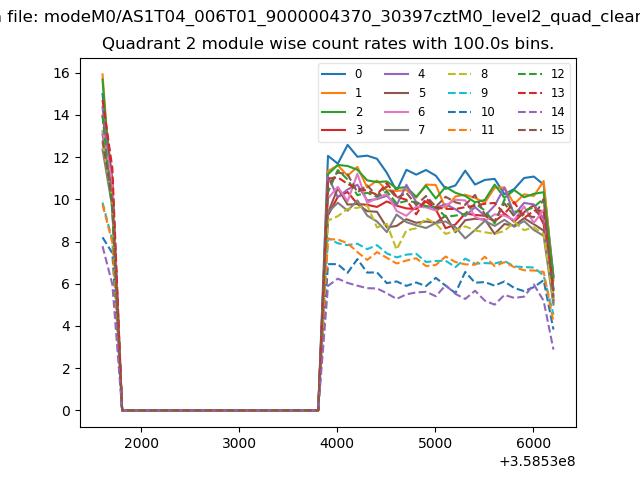
| Module-wise count rates for Quadrant B Data is divided into 100 sec bins |
 |
 |
| Module-wise count rates for Quadrant C Data is divided into 100 sec bins |
 |
 |
| Module-wise count rates for Quadrant D Data is divided into 100 sec bins |
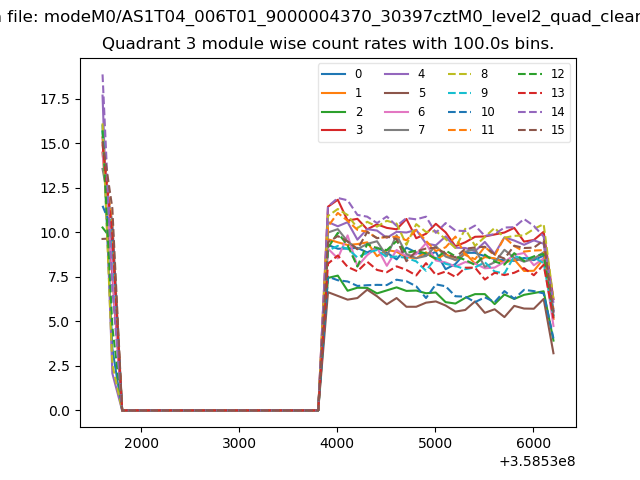 |
 |
| Parameter | Plot |
|---|---|
| CZT HV Monitor | 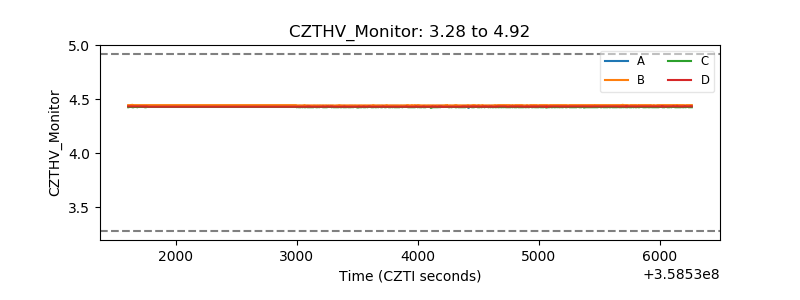 |
| D_VDD | 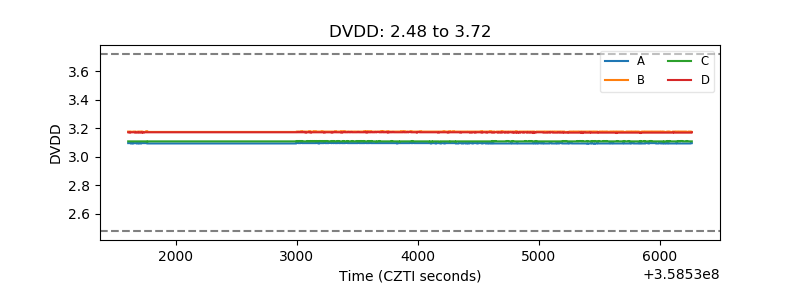 |
| Temperature 1 | 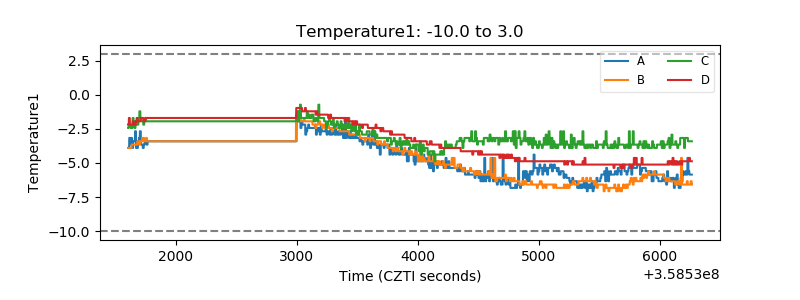 |
| Veto HV Monitor |  |
| Veto LLD | 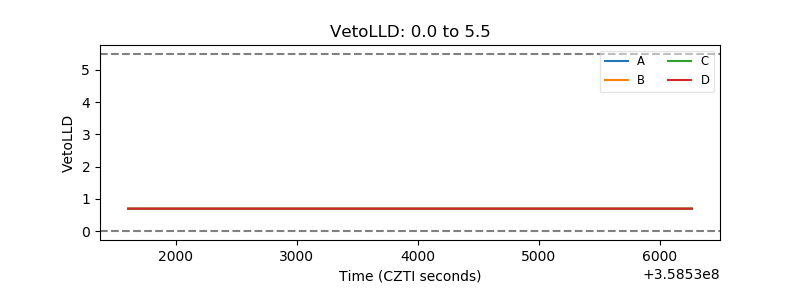 |
| Alpha Counter | 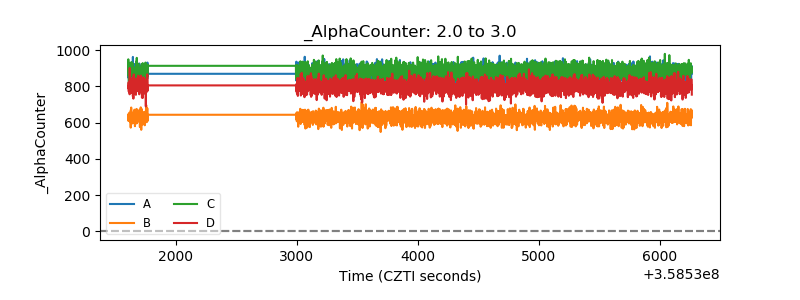 |
| _CPM_Rate | 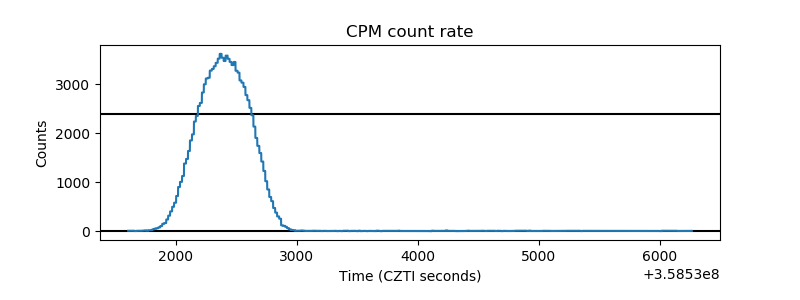 |
| CZT Counter |  |
| +2.5 Volts monitor | 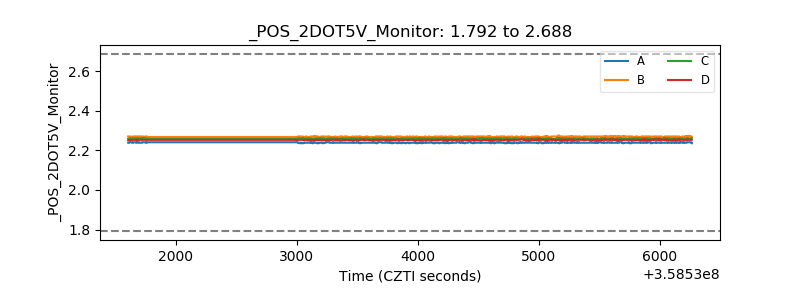 |
| +5 Volts monitor |  |
| _ROLL_ROT | 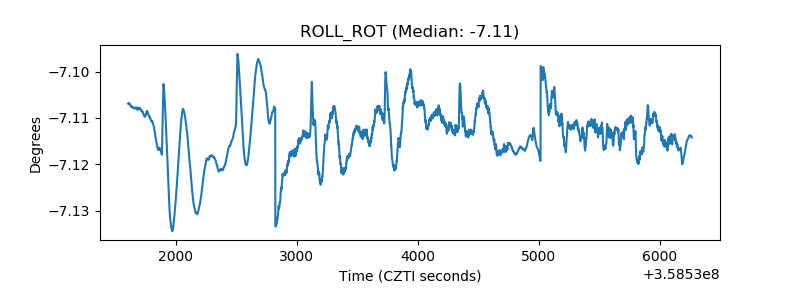 |
| _Roll_DEC | 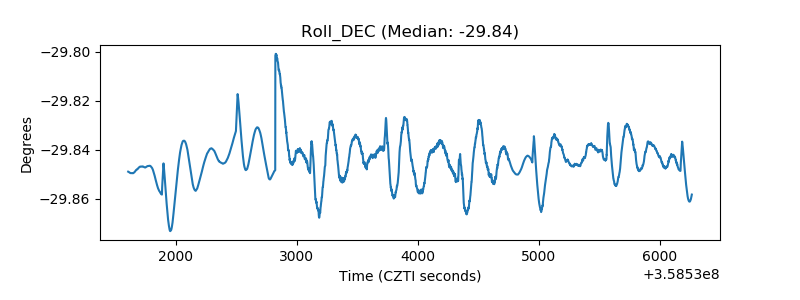 |
| _Roll_RA | 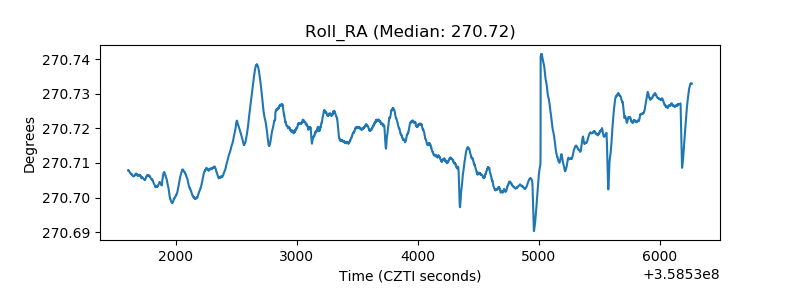 |
| Veto Counter | 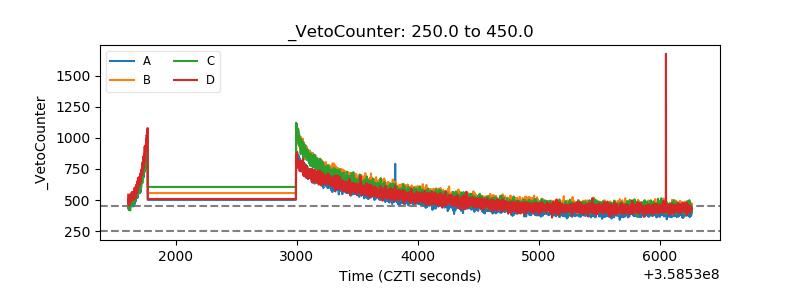 |