| Param | Original file | Final file |
|---|---|---|
| Filename | modeM0/AS1A10_053T20_9000004372cztM0_level2.fits | modeM0/AS1A10_053T20_9000004372cztM0_level2_quad_clean.evt |
| Size (bytes) | 165,248,640 | 136,232,640 |
| Size | 157.6 MB | 129.9 MB |
| Events in quadrant A | 1,049,264 | 809,221 |
| Events in quadrant B | 996,026 | 807,670 |
| Events in quadrant C | 1,015,764 | 752,806 |
| Events in quadrant D | 898,150 | 708,971 |
| Mode M0 | |||
|---|---|---|---|
| Quadrant | BADHDUFLAG | Total packets | Discarded packets |
| A | 0 | 33453 | 0 |
| B | 0 | 47423 | 0 |
| C | 0 | 33397 | 0 |
| D | 0 | 38627 | 0 |
| Mode M9 | |||
|---|---|---|---|
| Quadrant | BADHDUFLAG | Total packets | Discarded packets |
| A | 0 | 40 | 0 |
| B | 0 | 40 | 0 |
| C | 0 | 40 | 0 |
| D | 0 | 40 | 0 |
| Mode SS | |||
|---|---|---|---|
| Quadrant | BADHDUFLAG | Total packets | Discarded packets |
| A | 0 | 306 | 0 |
| B | 0 | 306 | 0 |
| C | 0 | 306 | 0 |
| D | 0 | 306 | 0 |
| Quadrant | Total seconds | Saturated seconds | Saturation percentage |
|---|---|---|---|
| A | 15162 | 241 | 1.589500% |
| B | 15162 | 443 | 2.921778% |
| C | 15162 | 500 | 3.297718% |
| D | 15162 | 444 | 2.928374% |
Noise dominated data is calculated using 1-second bins in cleaned event files. If a bin has >2000 counts, and if more than 50% of those come from <1% of pixels, then it is considered to be noise-dominated and hence unusable.
| Quadrant | # 1 sec bins | Bins with >0 counts | Bins with >2000 counts | High rate bins dominated by noise | Noise dominated (total time) | Noise dominated (detector-on time) | Marked lightcurve |
|---|---|---|---|---|---|---|---|
| A | 19032 | 15160 | 0 | 0 | 0.00% | 0.00% |  |
| B | 19032 | 15159 | 0 | 0 | 0.00% | 0.00% |  |
| C | 19032 | 15156 | 0 | 0 | 0.00% | 0.00% |  |
| D | 19032 | 15160 | 0 | 0 | 0.00% | 0.00% |  |
Top three noisy pixels from each quadrant. If the there are fewer than three noisy pixels in the level2.evt file, extra rows are filled as -1
| Pixel properties | Quadrant properties | ||||||
|---|---|---|---|---|---|---|---|
| Quadrant | DetID | PixID | Counts | Sigma | Mean | Median | Sigma |
| A | 7 | 110 | 846 | 8.61 | 274 | 260 | 68.1 |
| A | 0 | 29 | 842 | 8.55 | 274 | 260 | 68.1 |
| A | 9 | 19 | 770 | 7.49 | 274 | 260 | 68.1 |
| B | 2 | 9 | 758 | 9.3 | 264 | 253 | 54.3 |
| B | 5 | 255 | 680 | 7.86 | 264 | 253 | 54.3 |
| B | 3 | 17 | 668 | 7.64 | 264 | 253 | 54.3 |
| C | 3 | 202 | 808 | 8.18 | 267 | 253 | 67.8 |
| C | 1 | 81 | 787 | 7.87 | 267 | 253 | 67.8 |
| C | 3 | 203 | 763 | 7.52 | 267 | 253 | 67.8 |
| D | 15 | 46 | 667 | 6.24 | 256 | 235 | 69.3 |
| D | 10 | 189 | 660 | 6.14 | 256 | 235 | 69.3 |
| D | 6 | 231 | 632 | 5.73 | 256 | 235 | 69.3 |
Histogram calculated using DETX and DETY for each event in the final _common_clean file
| Quadrant A | 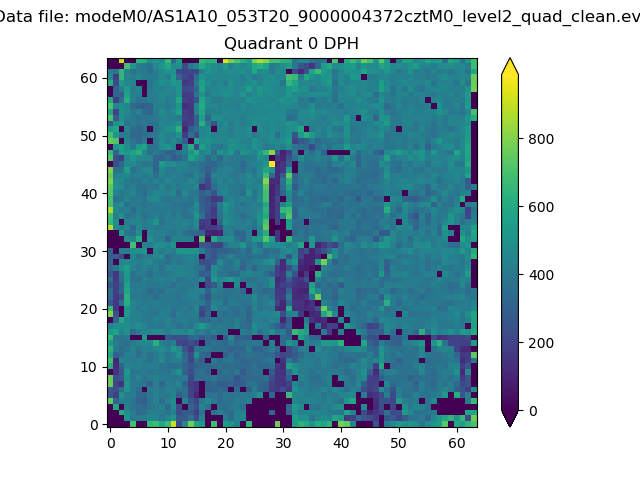 |
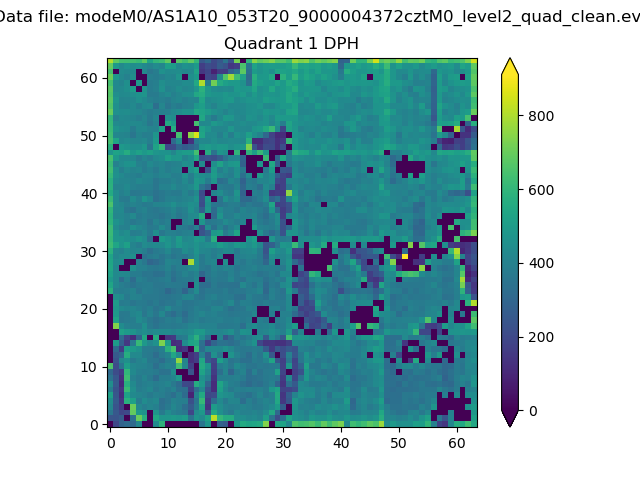 |
Quadrant B |
|---|---|---|---|
| Quadrant D |  |
 |
Quadrant C |
| Plot type | Count rate plots | Images |
|---|---|---|
| Comparison with Poisson distribution Blue bars denote a histogram of data divided into 1 sec bins. Red curve is a Poisson curve with rate = median count rate of data. |
 |
 |
| Quadrant-wise count rates Data is divided into 100 sec bins |
 |
|
| Module-wise count rates for Quadrant A Data is divided into 100 sec bins |
 |
 |
| Module-wise count rates for Quadrant B Data is divided into 100 sec bins |
 |
 |
| Module-wise count rates for Quadrant C Data is divided into 100 sec bins |
 |
 |
| Module-wise count rates for Quadrant D Data is divided into 100 sec bins |
 |
 |
| Parameter | Plot |
|---|---|
| CZT HV Monitor |  |
| D_VDD | 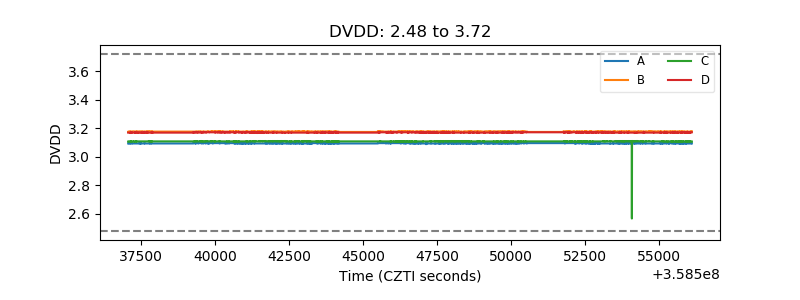 |
| Temperature 1 |  |
| Veto HV Monitor |  |
| Veto LLD |  |
| Alpha Counter |  |
| _CPM_Rate |  |
| CZT Counter |  |
| +2.5 Volts monitor |  |
| +5 Volts monitor |  |
| _ROLL_ROT |  |
| _Roll_DEC |  |
| _Roll_RA |  |
| Veto Counter |  |