| Param | Original file | Final file |
|---|---|---|
| Filename | modeM0/AS1A10_053T20_9000004372_30398cztM0_level2.evt | modeM0/AS1A10_053T20_9000004372_30398cztM0_level2_quad_clean.evt |
| Size (bytes) | 547,902,720 | 72,336,960 |
| Size | 522.5 MB | 69.0 MB |
| Events in quadrant A | 3,297,037 | 455,241 |
| Events in quadrant B | 5,203,382 | 456,785 |
| Events in quadrant C | 3,355,289 | 432,835 |
| Events in quadrant D | 4,331,830 | 426,802 |
| Mode M0 | |||
|---|---|---|---|
| Quadrant | BADHDUFLAG | Total packets | Discarded packets |
| A | 0 | 13441 | 1 |
| B | 0 | 19084 | 2 |
| C | 0 | 13478 | 1 |
| D | 0 | 16590 | 1 |
| Mode M9 | |||
|---|---|---|---|
| Quadrant | BADHDUFLAG | Total packets | Discarded packets |
| A | 0 | 13 | 0 |
| B | 0 | 13 | 0 |
| C | 0 | 13 | 0 |
| D | 0 | 13 | 0 |
| Mode SS | |||
|---|---|---|---|
| Quadrant | BADHDUFLAG | Total packets | Discarded packets |
| A | 0 | 122 | 0 |
| B | 0 | 122 | 0 |
| C | 0 | 122 | 0 |
| D | 0 | 122 | 0 |
| Quadrant | Total seconds | Saturated seconds | Saturation percentage |
|---|---|---|---|
| A | 5993 | 85 | 1.418321% |
| B | 5993 | 205 | 3.420657% |
| C | 5993 | 192 | 3.203738% |
| D | 5993 | 189 | 3.153679% |
Noise dominated data is calculated using 1-second bins in cleaned event files. If a bin has >2000 counts, and if more than 50% of those come from <1% of pixels, then it is considered to be noise-dominated and hence unusable.
| Quadrant | # 1 sec bins | Bins with >0 counts | Bins with >2000 counts | High rate bins dominated by noise | Noise dominated (total time) | Noise dominated (detector-on time) | Marked lightcurve |
|---|---|---|---|---|---|---|---|
| A | 7298 | 5993 | 6 | 6 | 0.08% | 0.10% | 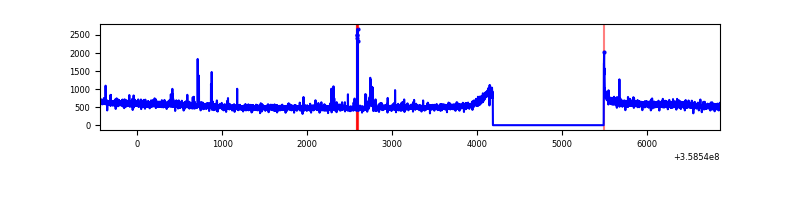 |
| B | 7298 | 5993 | 39 | 39 | 0.53% | 0.65% | 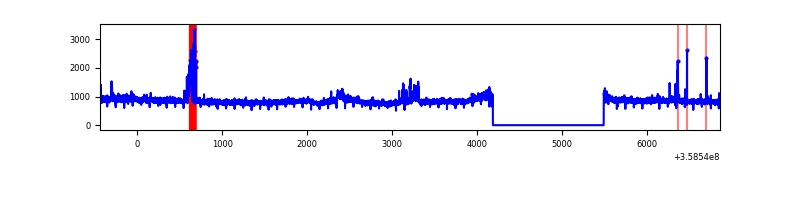 |
| C | 7298 | 5993 | 0 | 0 | 0.00% | 0.00% | 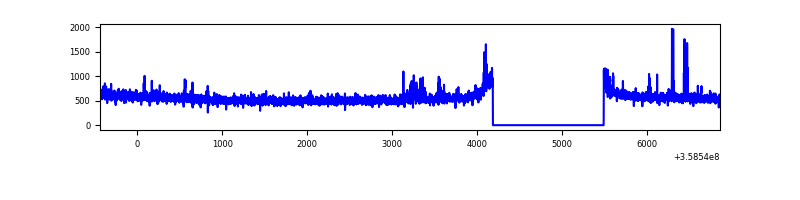 |
| D | 7298 | 5993 | 141 | 141 | 1.93% | 2.35% | 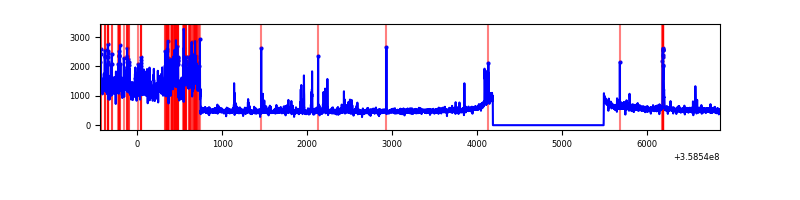 |
Top three noisy pixels from each quadrant. If the there are fewer than three noisy pixels in the level2.evt file, extra rows are filled as -1
| Pixel properties | Quadrant properties | ||||||
|---|---|---|---|---|---|---|---|
| Quadrant | DetID | PixID | Counts | Sigma | Mean | Median | Sigma |
| A | 0 | 13 | 41141 | 243.49 | 835 | 820 | 165.6 |
| A | 11 | 242 | 14135 | 80.41 | 835 | 820 | 165.6 |
| A | 8 | 192 | 12174 | 68.56 | 835 | 820 | 165.6 |
| B | 6 | 159 | 1704737 | 11085.15 | 822 | 805 | 153.7 |
| B | 0 | 229 | 259774 | 1684.76 | 822 | 805 | 153.7 |
| B | 12 | 111 | 18130 | 112.71 | 822 | 805 | 153.7 |
| C | 14 | 238 | 163023 | 899.6 | 788 | 796 | 180.3 |
| C | 14 | 254 | 45601 | 248.46 | 788 | 796 | 180.3 |
| C | 10 | 22 | 42545 | 231.51 | 788 | 796 | 180.3 |
| D | 8 | 195 | 1098123 | 5914.85 | 795 | 777 | 185.5 |
| D | 13 | 249 | 112178 | 600.47 | 795 | 777 | 185.5 |
| D | 13 | 104 | 43860 | 232.22 | 795 | 777 | 185.5 |
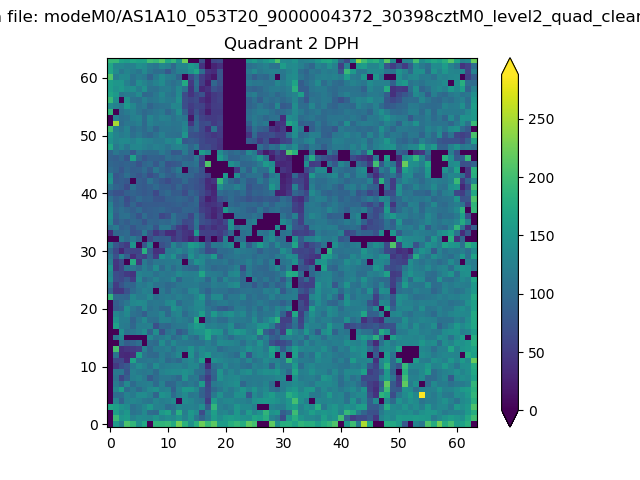
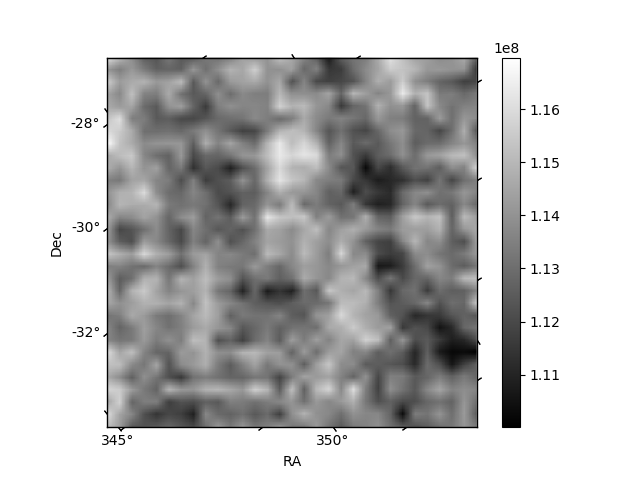
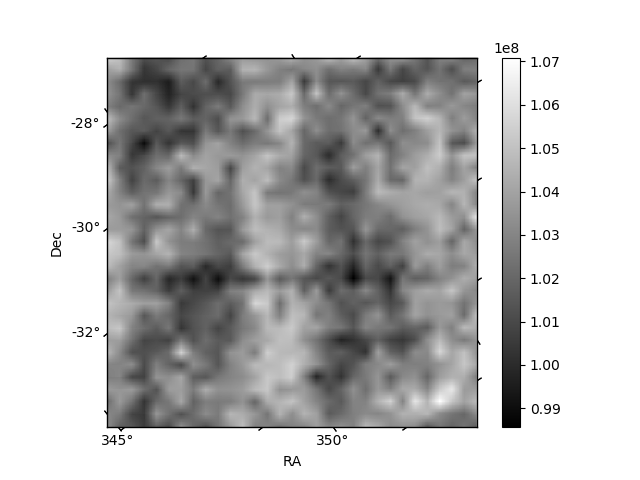
Histogram calculated using DETX and DETY for each event in the final _common_clean file
| Quadrant A | 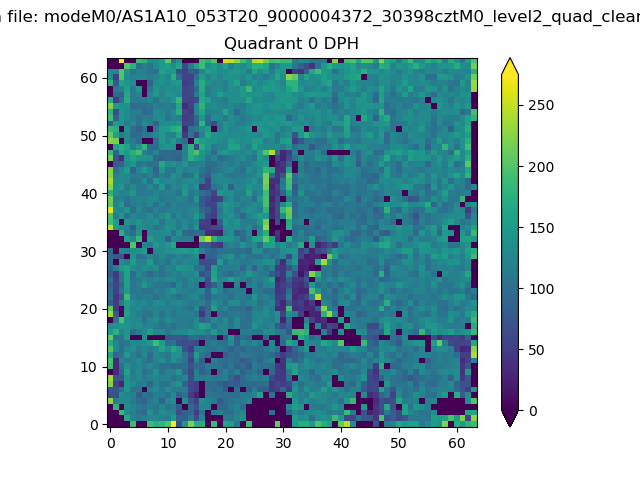 |
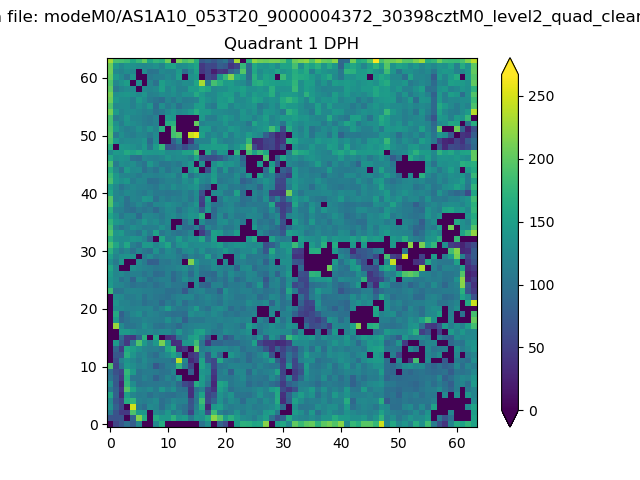 |
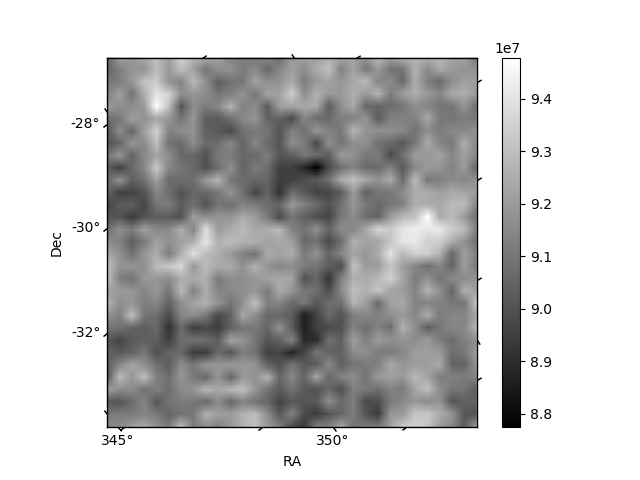
Quadrant B |
|---|---|---|---|
| Quadrant D | 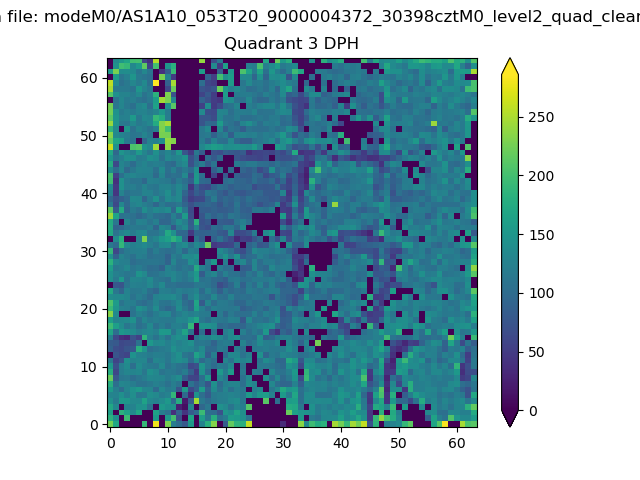 |
 |
Quadrant C |
| Plot type | Count rate plots | Images |
|---|---|---|
| Comparison with Poisson distribution Blue bars denote a histogram of data divided into 1 sec bins. Red curve is a Poisson curve with rate = median count rate of data. |
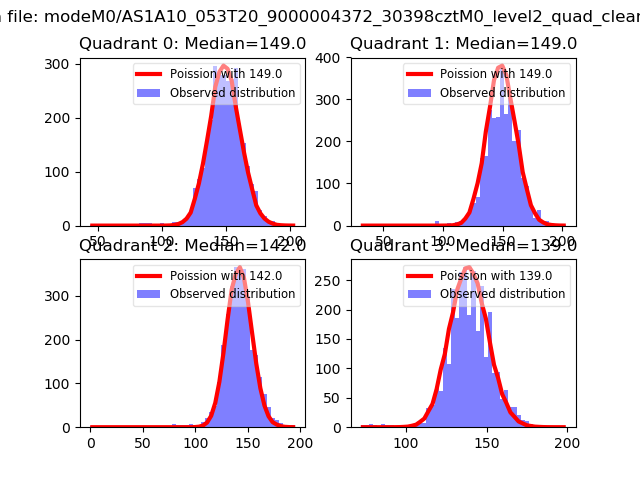 |
 |
| Quadrant-wise count rates Data is divided into 100 sec bins |
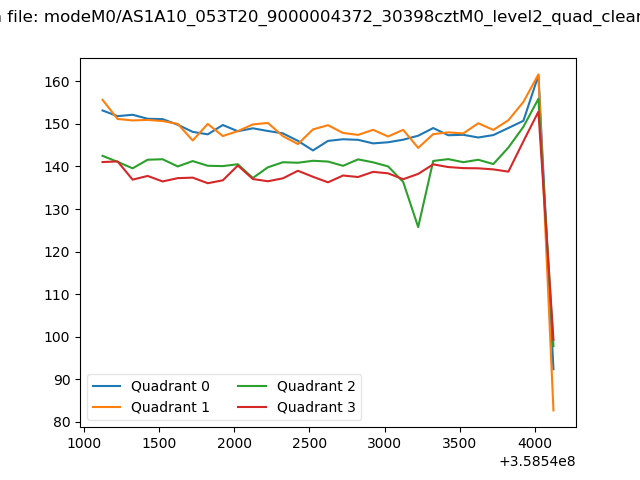 |
|
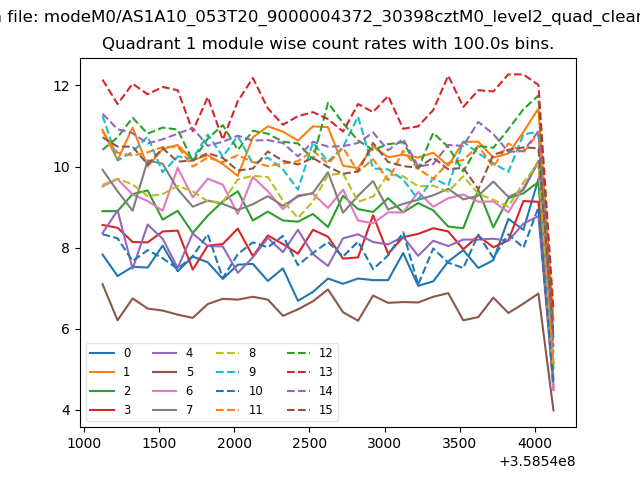
| Module-wise count rates for Quadrant A Data is divided into 100 sec bins |
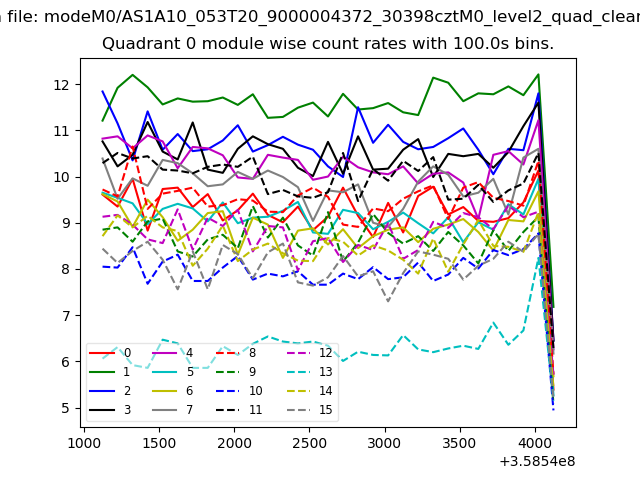 |
 |
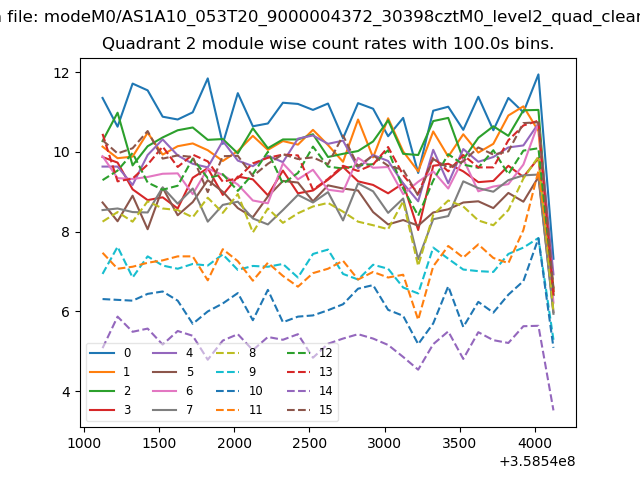
| Module-wise count rates for Quadrant B Data is divided into 100 sec bins |
 |
 |
| Module-wise count rates for Quadrant C Data is divided into 100 sec bins |
 |
 |
| Module-wise count rates for Quadrant D Data is divided into 100 sec bins |
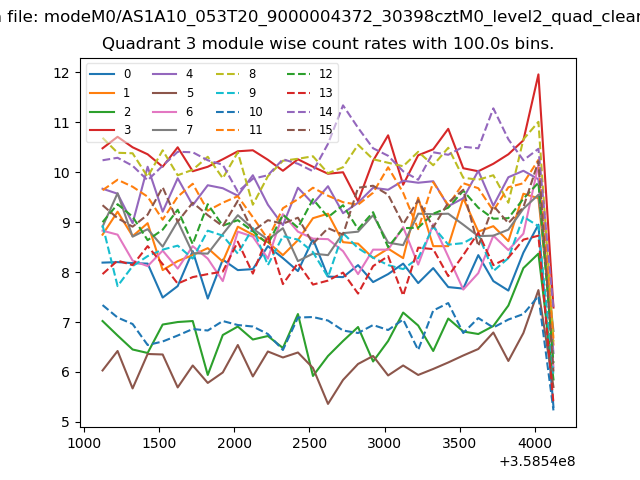 |
 |
| Parameter | Plot |
|---|---|
| CZT HV Monitor | 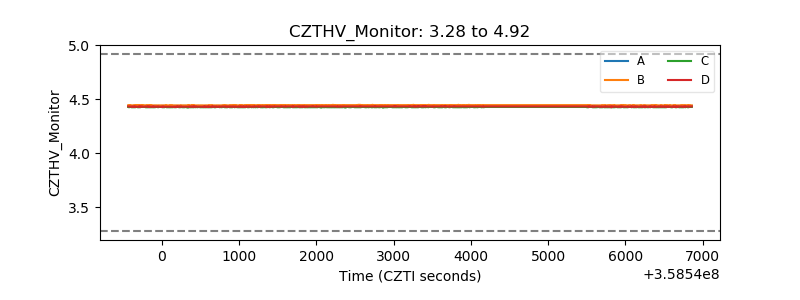 |
| D_VDD | 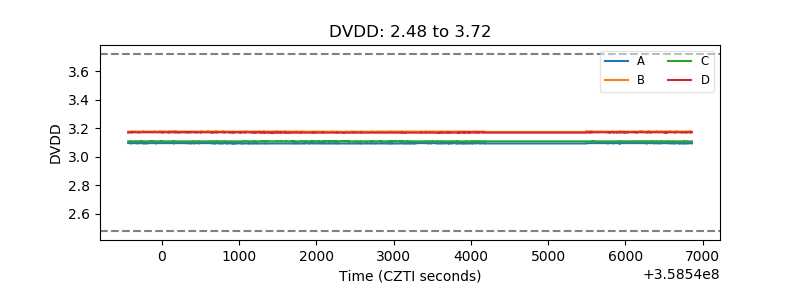 |
| Temperature 1 | 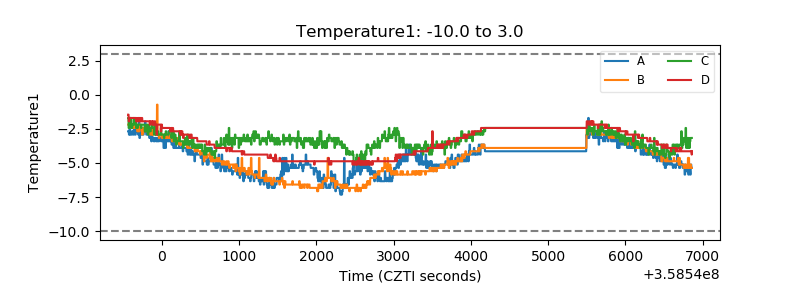 |
| Veto HV Monitor | 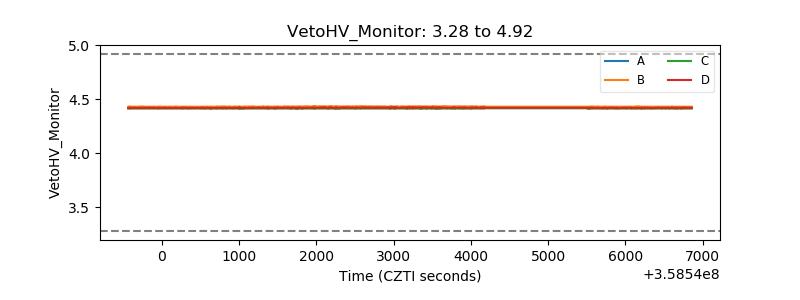 |
| Veto LLD | 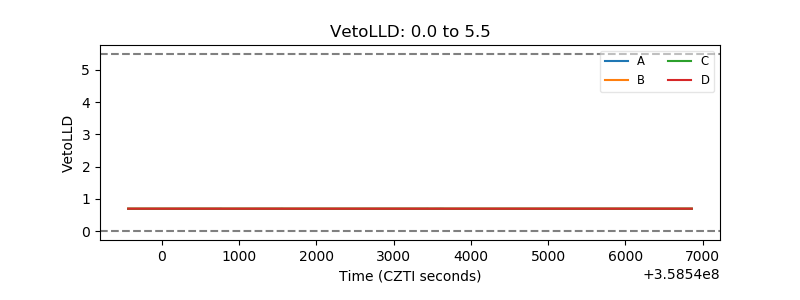 |
| Alpha Counter |  |
| _CPM_Rate | 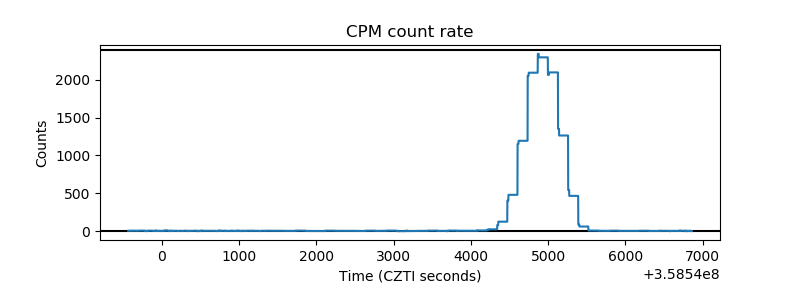 |
| CZT Counter |  |
| +2.5 Volts monitor |  |
| +5 Volts monitor |  |
| _ROLL_ROT | 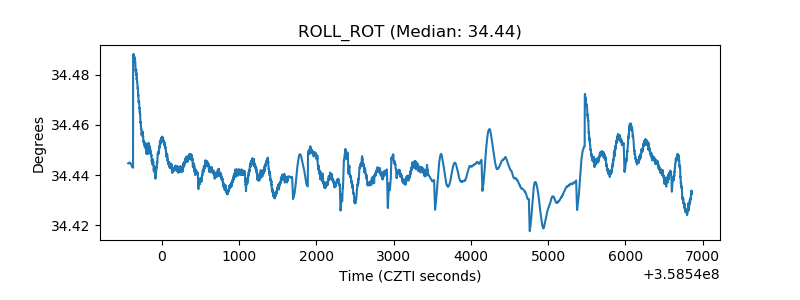 |
| _Roll_DEC | 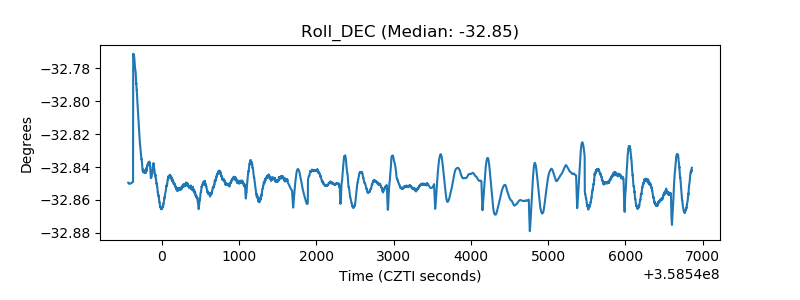 |
| _Roll_RA |  |
| Veto Counter | 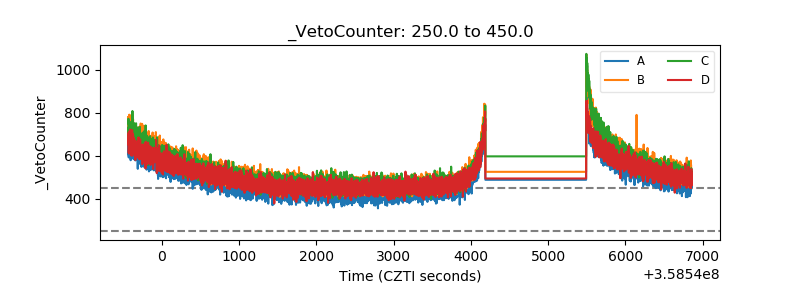 |