| Param | Original file | Final file |
|---|---|---|
| Filename | modeM0/AS1A10_053T20_9000004372_30399cztM0_level2.evt | modeM0/AS1A10_053T20_9000004372_30399cztM0_level2_quad_clean.evt |
| Size (bytes) | 538,416,000 | 86,077,440 |
| Size | 513.5 MB | 82.1 MB |
| Events in quadrant A | 3,353,221 | 553,318 |
| Events in quadrant B | 5,302,362 | 555,234 |
| Events in quadrant C | 3,521,282 | 528,478 |
| Events in quadrant D | 3,699,547 | 527,230 |
| Mode M0 | |||
|---|---|---|---|
| Quadrant | BADHDUFLAG | Total packets | Discarded packets |
| A | 0 | 13775 | 3 |
| B | 0 | 19616 | 2 |
| C | 0 | 14148 | 2 |
| D | 0 | 14963 | 2 |
| Mode M9 | |||
|---|---|---|---|
| Quadrant | BADHDUFLAG | Total packets | Discarded packets |
| A | 0 | 13 | 0 |
| B | 0 | 14 | 0 |
| C | 0 | 14 | 0 |
| D | 0 | 14 | 0 |
| Mode SS | |||
|---|---|---|---|
| Quadrant | BADHDUFLAG | Total packets | Discarded packets |
| A | 0 | 128 | 0 |
| B | 0 | 128 | 0 |
| C | 0 | 128 | 0 |
| D | 0 | 128 | 0 |
| Quadrant | Total seconds | Saturated seconds | Saturation percentage |
|---|---|---|---|
| A | 6340 | 106 | 1.671924% |
| B | 6340 | 200 | 3.154574% |
| C | 6340 | 203 | 3.201893% |
| D | 6340 | 206 | 3.249211% |
Noise dominated data is calculated using 1-second bins in cleaned event files. If a bin has >2000 counts, and if more than 50% of those come from <1% of pixels, then it is considered to be noise-dominated and hence unusable.
| Quadrant | # 1 sec bins | Bins with >0 counts | Bins with >2000 counts | High rate bins dominated by noise | Noise dominated (total time) | Noise dominated (detector-on time) | Marked lightcurve |
|---|---|---|---|---|---|---|---|
| A | 7560 | 6340 | 2 | 2 | 0.03% | 0.03% | 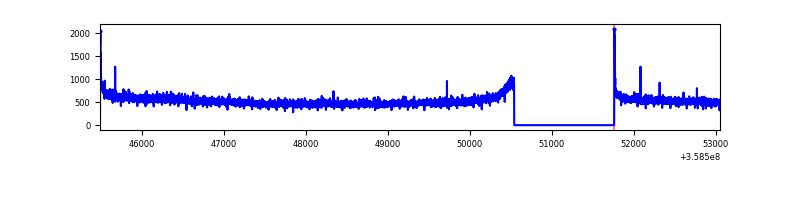 |
| B | 7560 | 6340 | 16 | 16 | 0.21% | 0.25% | 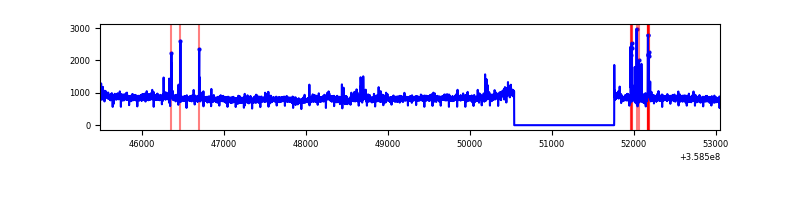 |
| C | 7560 | 6340 | 1 | 1 | 0.01% | 0.02% | 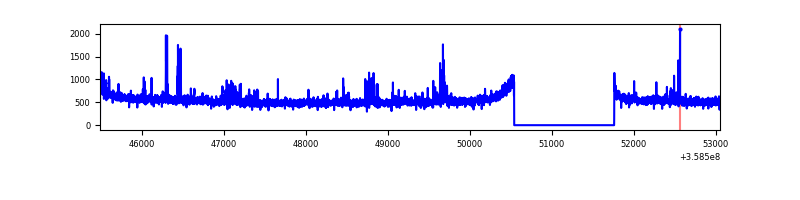 |
| D | 7560 | 6340 | 140 | 140 | 1.85% | 2.21% | 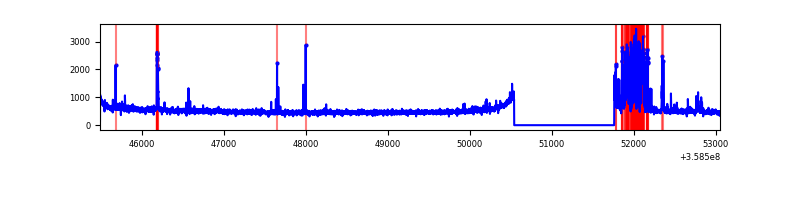 |
Top three noisy pixels from each quadrant. If the there are fewer than three noisy pixels in the level2.evt file, extra rows are filled as -1
| Pixel properties | Quadrant properties | ||||||
|---|---|---|---|---|---|---|---|
| Quadrant | DetID | PixID | Counts | Sigma | Mean | Median | Sigma |
| A | 8 | 192 | 25292 | 143.2 | 860 | 844 | 170.7 |
| A | 13 | 254 | 12302 | 67.11 | 860 | 844 | 170.7 |
| A | 11 | 242 | 8502 | 44.85 | 860 | 844 | 170.7 |
| B | 6 | 159 | 1810499 | 11230.23 | 849 | 828 | 161.1 |
| B | 0 | 229 | 79767 | 489.87 | 849 | 828 | 161.1 |
| B | 5 | 172 | 71437 | 438.18 | 849 | 828 | 161.1 |
| C | 14 | 238 | 169262 | 891.02 | 818 | 825 | 189.0 |
| C | 10 | 22 | 72907 | 381.31 | 818 | 825 | 189.0 |
| C | 14 | 254 | 52361 | 272.62 | 818 | 825 | 189.0 |
| D | 13 | 104 | 480762 | 2484.18 | 822 | 801 | 193.2 |
| D | 8 | 195 | 37933 | 192.19 | 822 | 801 | 193.2 |
| D | 13 | 249 | 37174 | 188.26 | 822 | 801 | 193.2 |
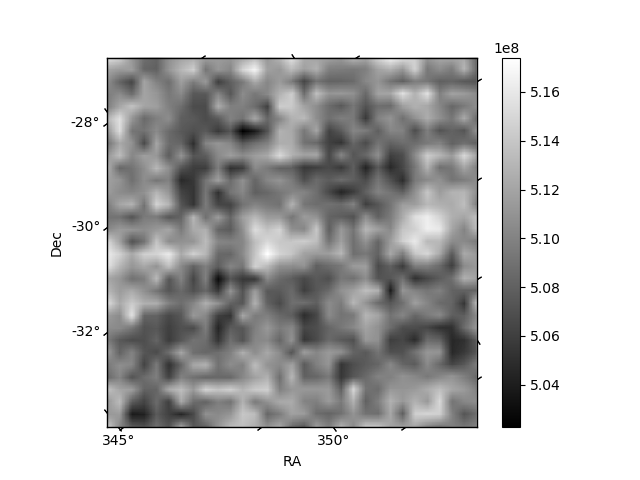
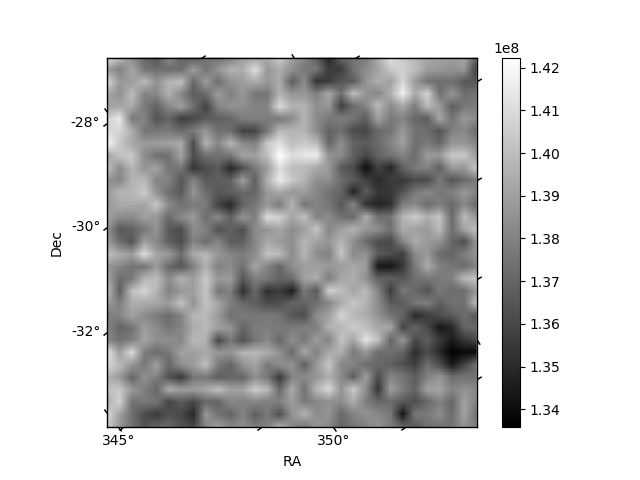
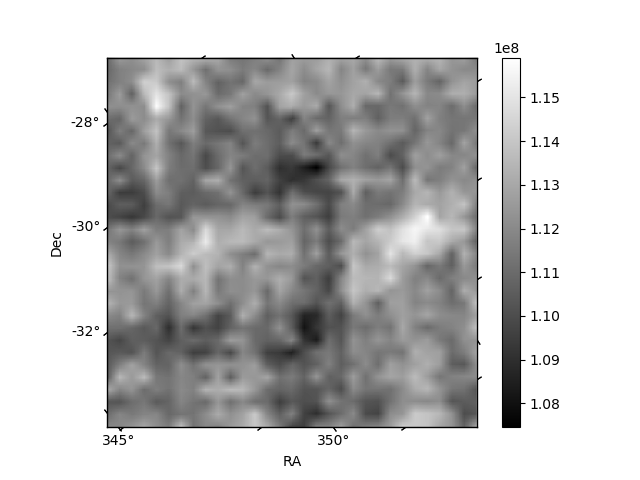
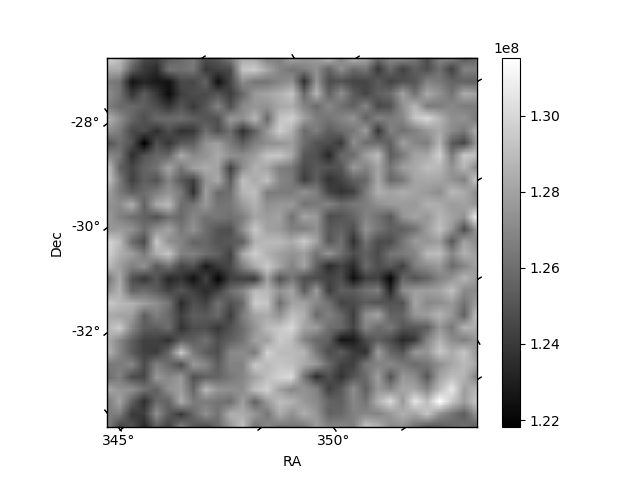
Histogram calculated using DETX and DETY for each event in the final _common_clean file
| Quadrant A |  |
 |
Quadrant B |
|---|---|---|---|
| Quadrant D |  |
 |
Quadrant C |
| Plot type | Count rate plots | Images |
|---|---|---|
| Comparison with Poisson distribution Blue bars denote a histogram of data divided into 1 sec bins. Red curve is a Poisson curve with rate = median count rate of data. |
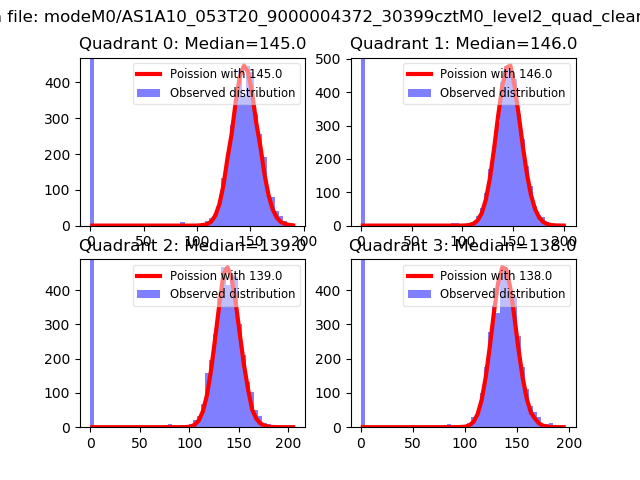 |
 |
| Quadrant-wise count rates Data is divided into 100 sec bins |
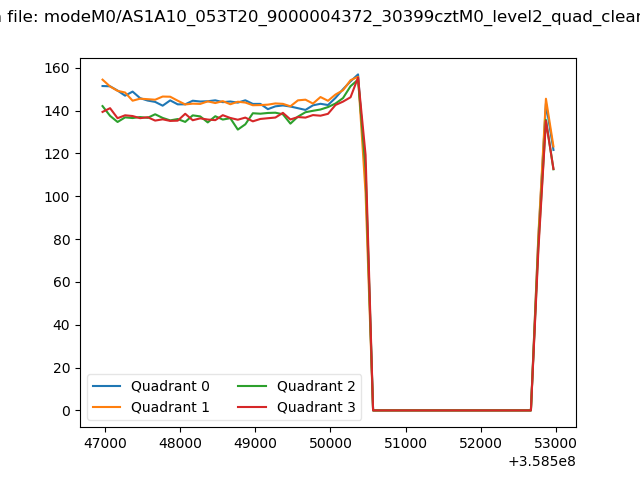 |
|
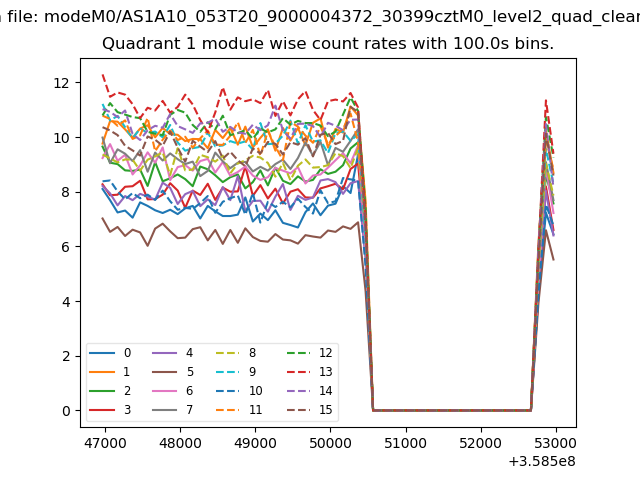
| Module-wise count rates for Quadrant A Data is divided into 100 sec bins |
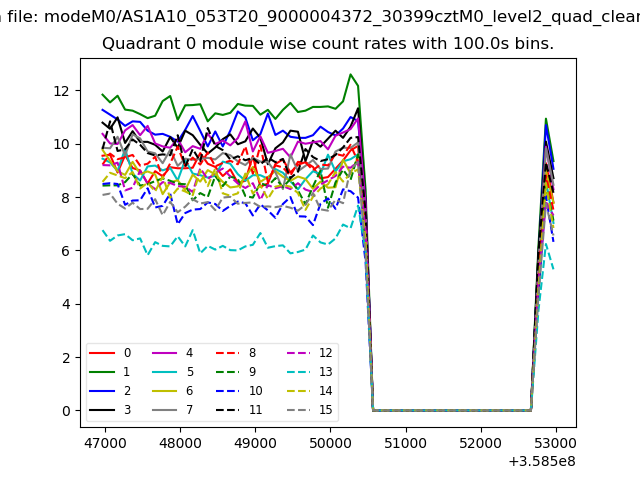 |
 |
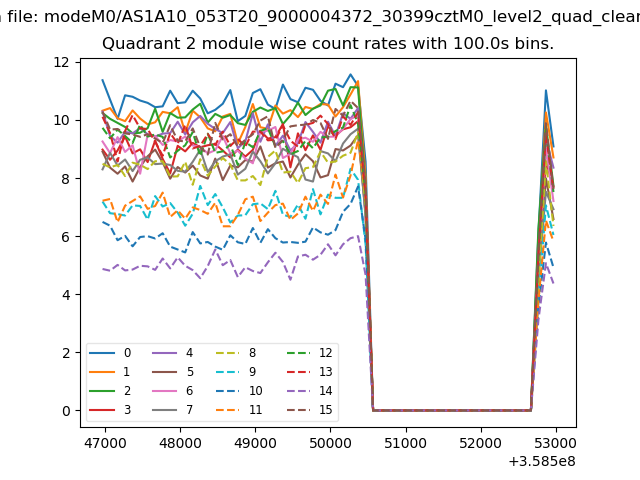
| Module-wise count rates for Quadrant B Data is divided into 100 sec bins |
 |
 |
| Module-wise count rates for Quadrant C Data is divided into 100 sec bins |
 |
 |
| Module-wise count rates for Quadrant D Data is divided into 100 sec bins |
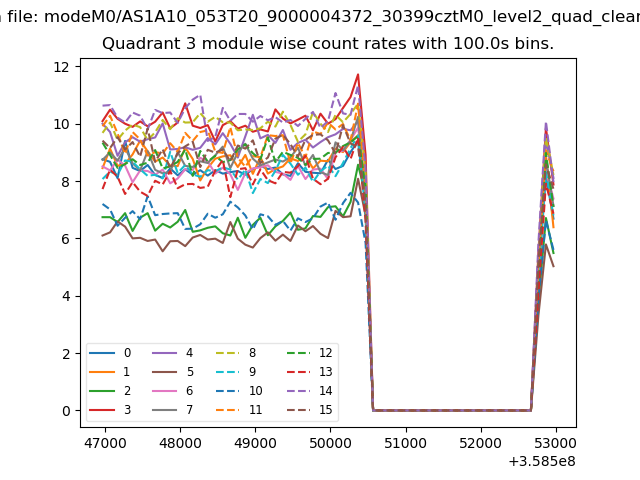 |
 |
| Parameter | Plot |
|---|---|
| CZT HV Monitor | 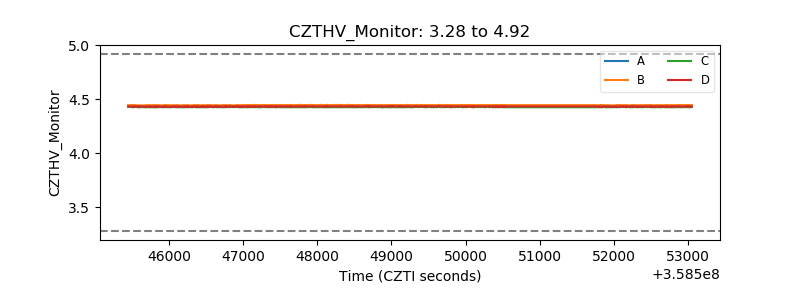 |
| D_VDD | 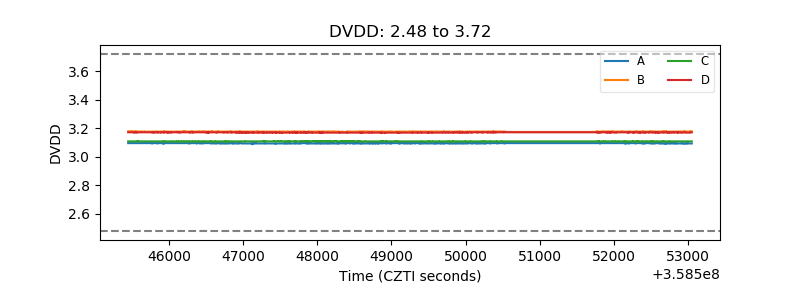 |
| Temperature 1 | 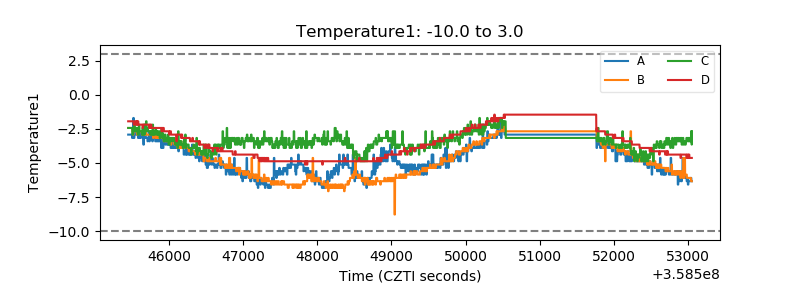 |
| Veto HV Monitor |  |
| Veto LLD | 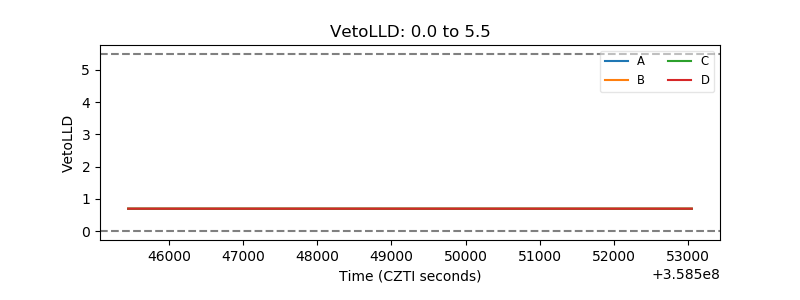 |
| Alpha Counter | 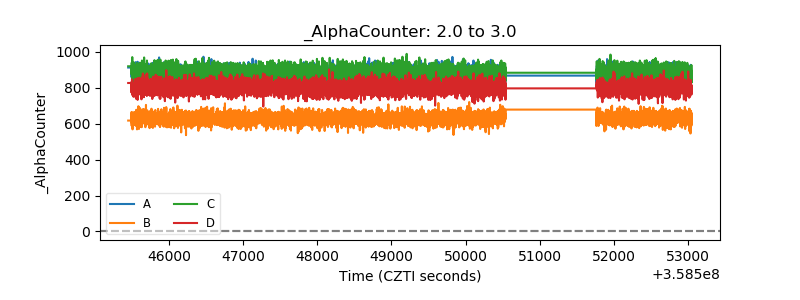 |
| _CPM_Rate | 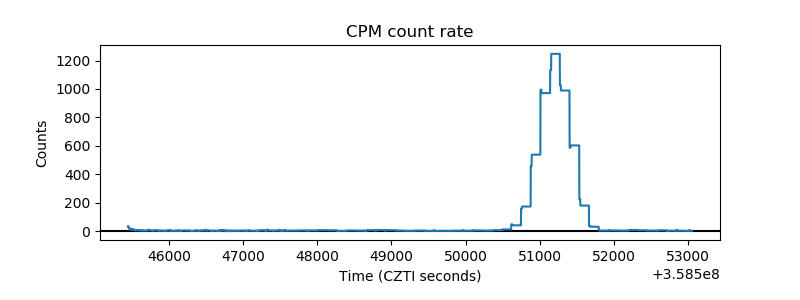 |
| CZT Counter | 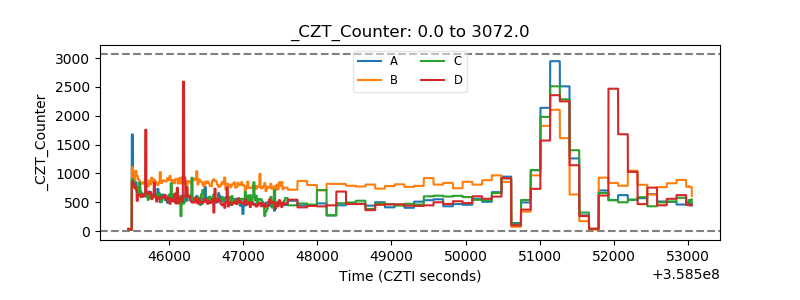 |
| +2.5 Volts monitor |  |
| +5 Volts monitor |  |
| _ROLL_ROT | 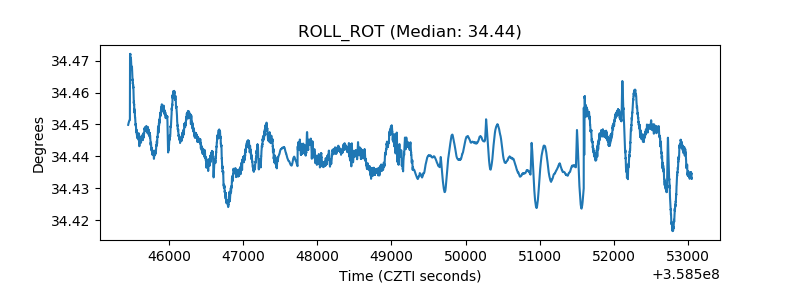 |
| _Roll_DEC | 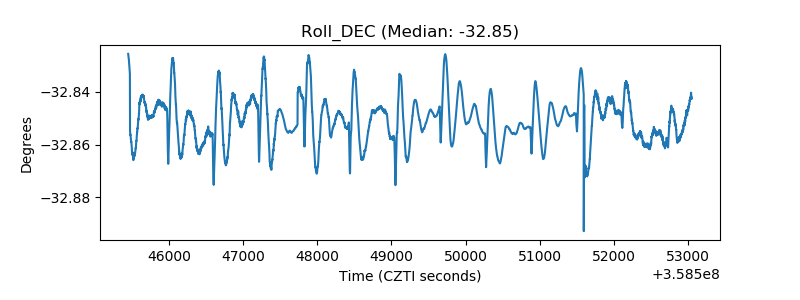 |
| _Roll_RA | 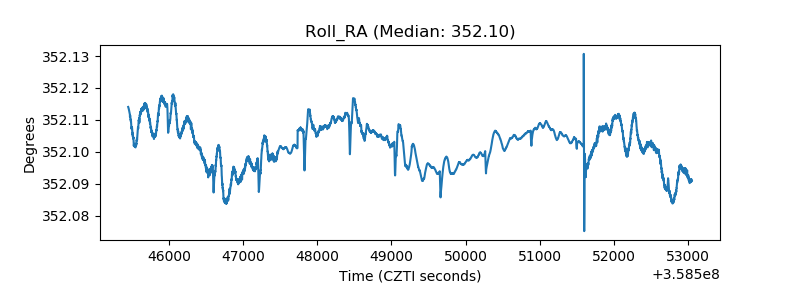 |
| Veto Counter | 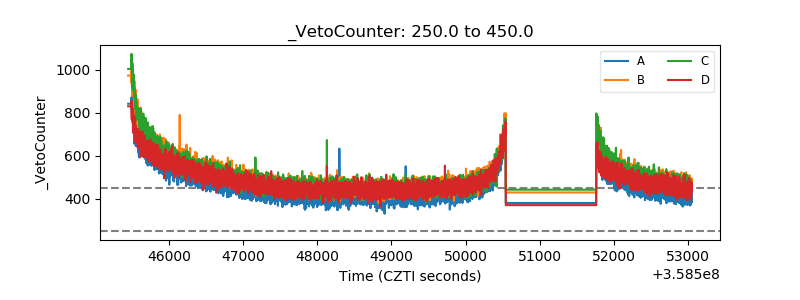 |