| Param | Original file | Final file |
|---|---|---|
| Filename | modeM0/AS1A10_053T20_9000004372_30400cztM0_level2.evt | modeM0/AS1A10_053T20_9000004372_30400cztM0_level2_quad_clean.evt |
| Size (bytes) | 346,250,880 | 68,342,400 |
| Size | 330.2 MB | 65.2 MB |
| Events in quadrant A | 2,089,682 | 449,242 |
| Events in quadrant B | 3,474,022 | 453,397 |
| Events in quadrant C | 2,177,321 | 433,262 |
| Events in quadrant D | 2,450,060 | 428,499 |
| Mode M0 | |||
|---|---|---|---|
| Quadrant | BADHDUFLAG | Total packets | Discarded packets |
| A | 0 | 8902 | 1 |
| B | 0 | 13196 | 1 |
| C | 0 | 9010 | 1 |
| D | 0 | 10208 | 1 |
| Mode M9 | |||
|---|---|---|---|
| Quadrant | BADHDUFLAG | Total packets | Discarded packets |
| A | 0 | 4 | 0 |
| B | 0 | 5 | 0 |
| C | 0 | 5 | 0 |
| D | 0 | 5 | 0 |
| Mode SS | |||
|---|---|---|---|
| Quadrant | BADHDUFLAG | Total packets | Discarded packets |
| A | 0 | 86 | 0 |
| B | 0 | 86 | 0 |
| C | 0 | 86 | 0 |
| D | 0 | 86 | 0 |
| Quadrant | Total seconds | Saturated seconds | Saturation percentage |
|---|---|---|---|
| A | 4337 | 17 | 0.391976% |
| B | 4337 | 40 | 0.922297% |
| C | 4337 | 37 | 0.853124% |
| D | 4337 | 163 | 3.758358% |
Noise dominated data is calculated using 1-second bins in cleaned event files. If a bin has >2000 counts, and if more than 50% of those come from <1% of pixels, then it is considered to be noise-dominated and hence unusable.
| Quadrant | # 1 sec bins | Bins with >0 counts | Bins with >2000 counts | High rate bins dominated by noise | Noise dominated (total time) | Noise dominated (detector-on time) | Marked lightcurve |
|---|---|---|---|---|---|---|---|
| A | 4337 | 4337 | 1 | 1 | 0.02% | 0.02% | 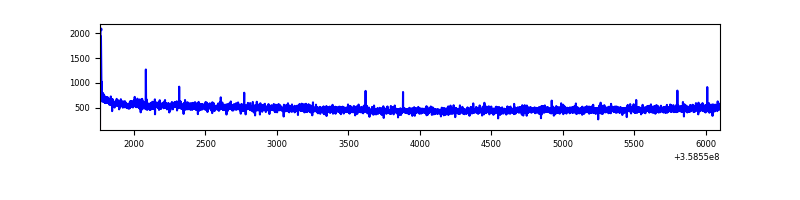 |
| B | 4337 | 4337 | 13 | 13 | 0.30% | 0.30% | 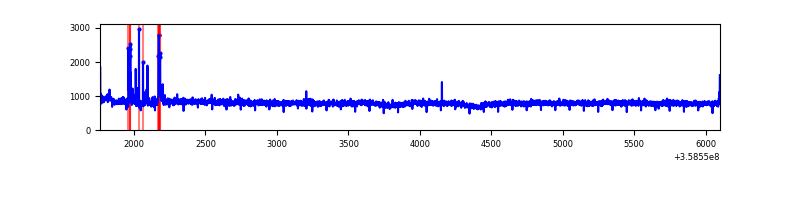 |
| C | 4337 | 4337 | 1 | 1 | 0.02% | 0.02% | 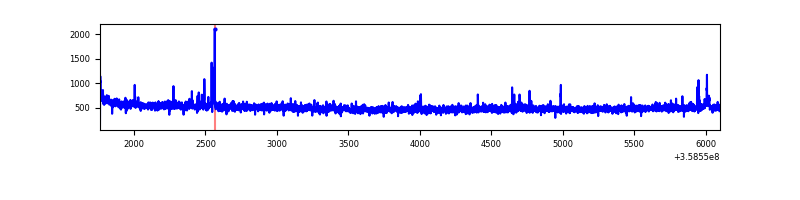 |
| D | 4337 | 4337 | 128 | 128 | 2.95% | 2.95% | 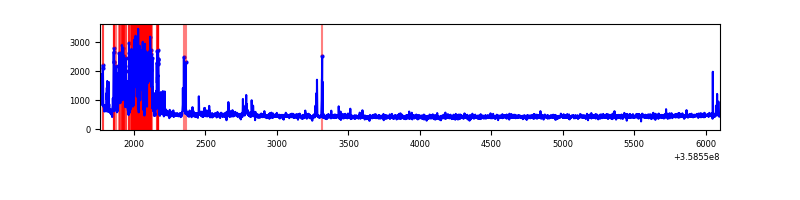 |
Top three noisy pixels from each quadrant. If the there are fewer than three noisy pixels in the level2.evt file, extra rows are filled as -1
| Pixel properties | Quadrant properties | ||||||
|---|---|---|---|---|---|---|---|
| Quadrant | DetID | PixID | Counts | Sigma | Mean | Median | Sigma |
| A | 8 | 192 | 13783 | 123.44 | 536 | 527 | 107.4 |
| A | 13 | 254 | 8537 | 74.59 | 536 | 527 | 107.4 |
| A | 3 | 137 | 5071 | 42.31 | 536 | 527 | 107.4 |
| B | 6 | 159 | 1306580 | 12934.76 | 532 | 518 | 101.0 |
| B | 5 | 172 | 59332 | 582.47 | 532 | 518 | 101.0 |
| B | 0 | 229 | 21582 | 208.61 | 532 | 518 | 101.0 |
| C | 14 | 238 | 91019 | 740.17 | 520 | 523 | 122.3 |
| C | 10 | 22 | 25235 | 202.12 | 520 | 523 | 122.3 |
| C | 3 | 233 | 16718 | 132.46 | 520 | 523 | 122.3 |
| D | 13 | 104 | 453140 | 3710.43 | 514 | 502 | 122.0 |
| D | 8 | 195 | 22823 | 182.97 | 514 | 502 | 122.0 |
| D | 2 | 250 | 17747 | 141.36 | 514 | 502 | 122.0 |
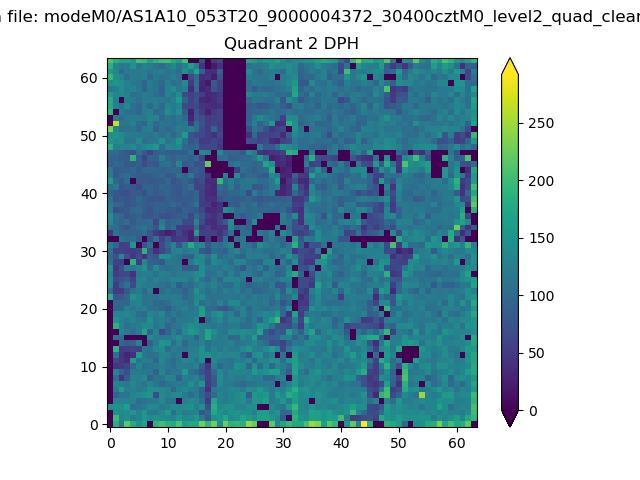
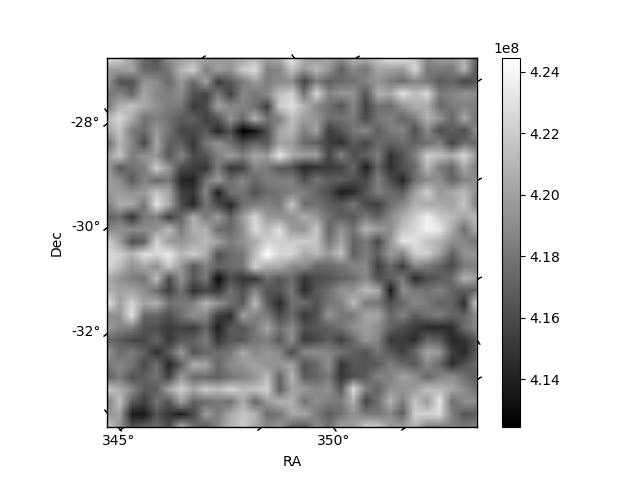
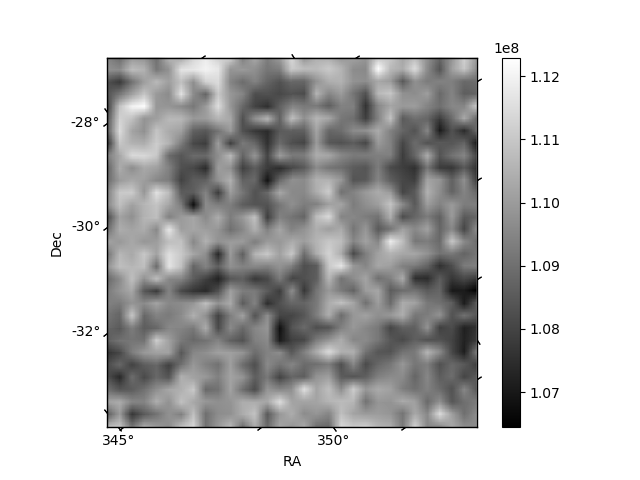
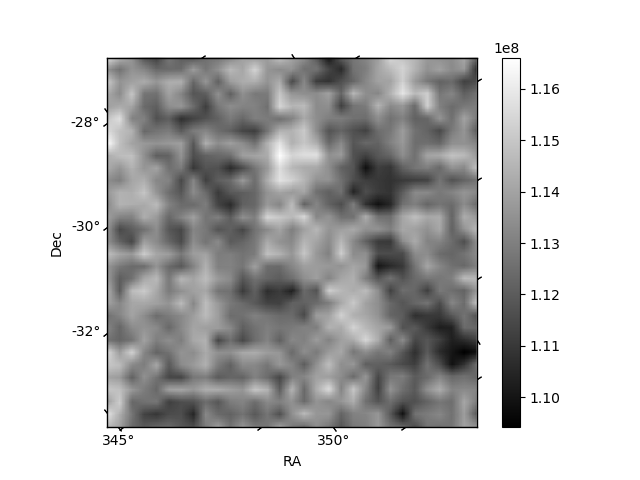
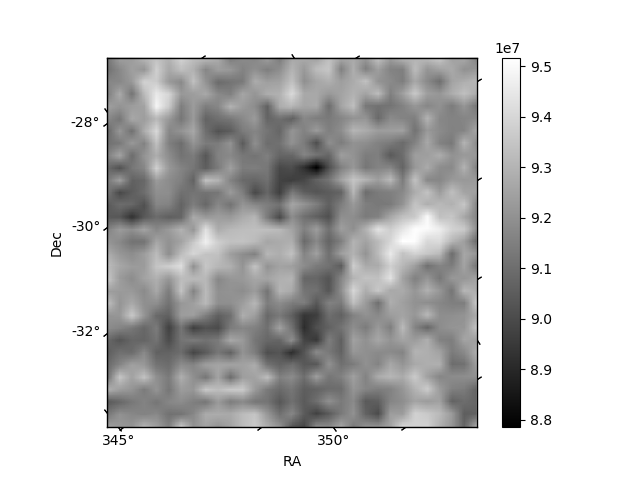
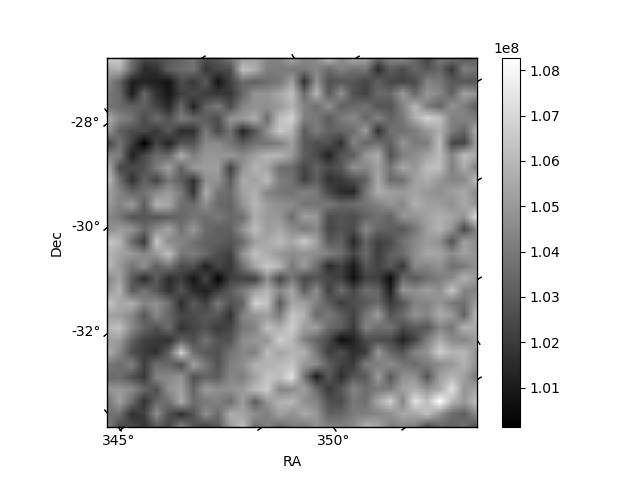
Histogram calculated using DETX and DETY for each event in the final _common_clean file
| Quadrant A | 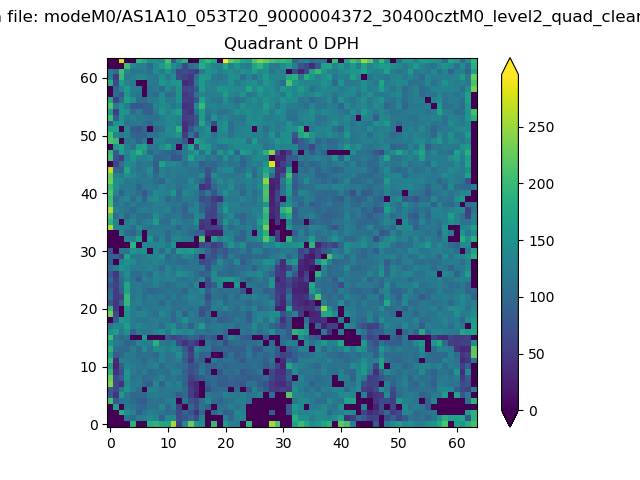 |
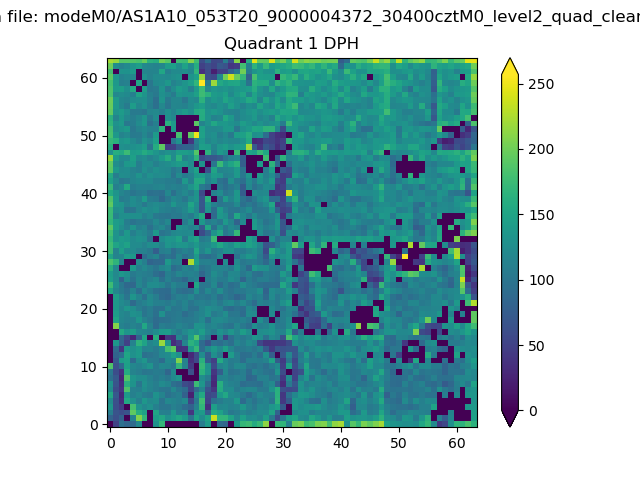 |
Quadrant B |
|---|---|---|---|
| Quadrant D | 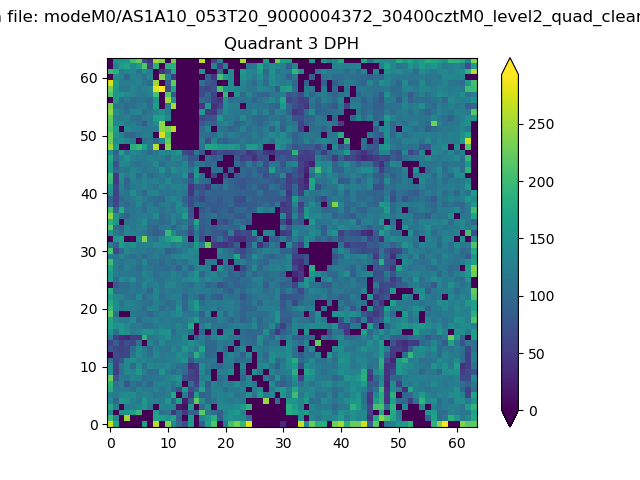 |
 |
Quadrant C |
| Plot type | Count rate plots | Images |
|---|---|---|
| Comparison with Poisson distribution Blue bars denote a histogram of data divided into 1 sec bins. Red curve is a Poisson curve with rate = median count rate of data. |
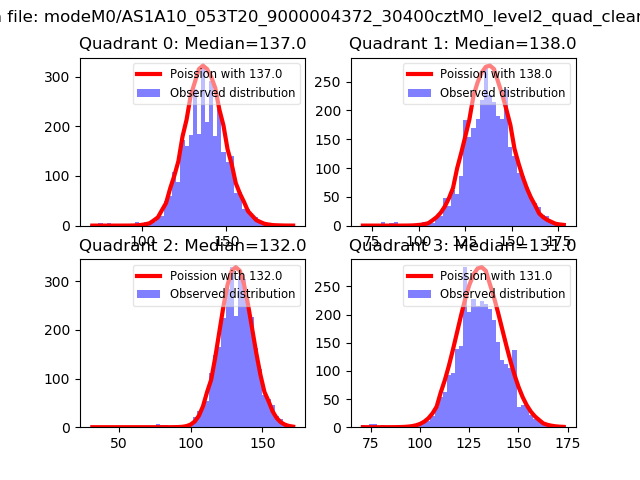 |
 |
| Quadrant-wise count rates Data is divided into 100 sec bins |
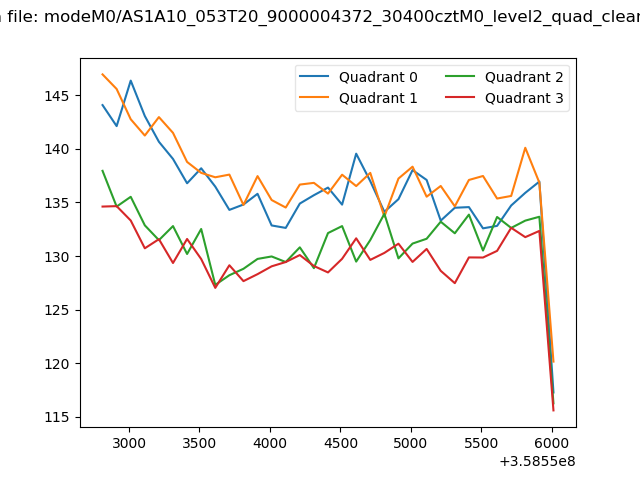 |
|
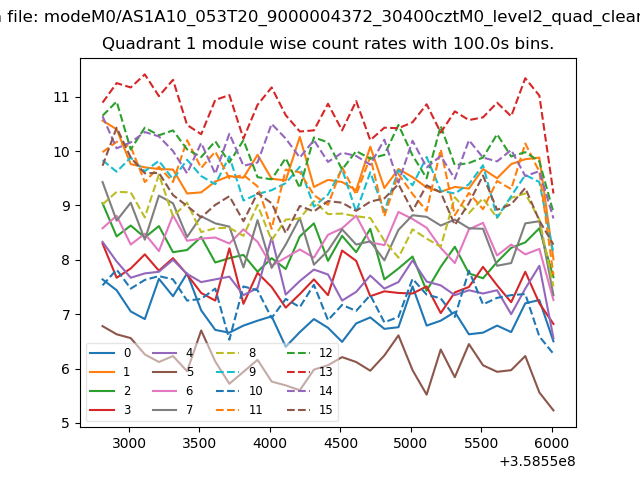
| Module-wise count rates for Quadrant A Data is divided into 100 sec bins |
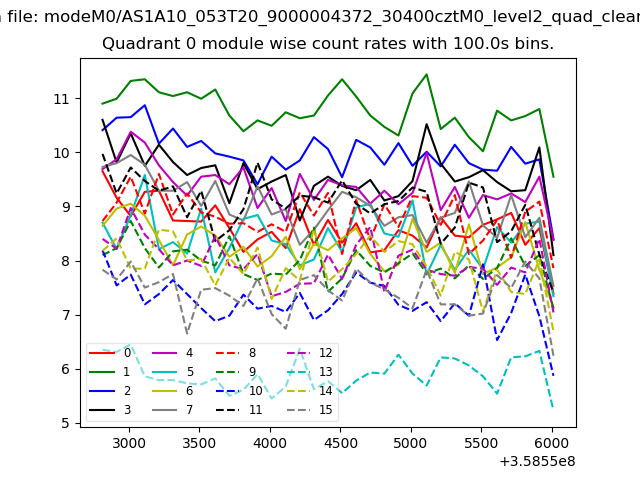 |
 |
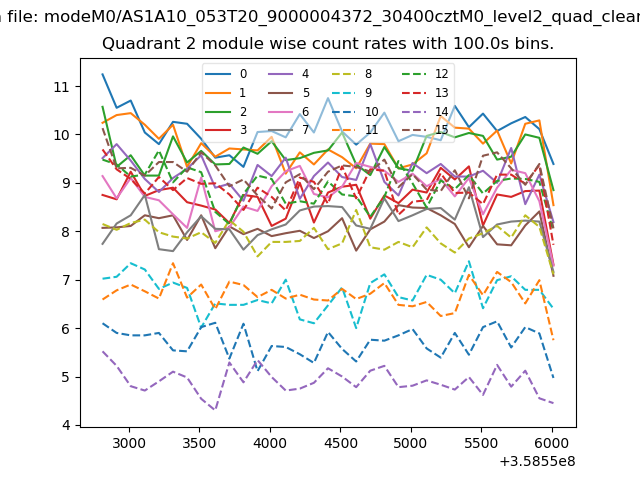
| Module-wise count rates for Quadrant B Data is divided into 100 sec bins |
 |
 |
| Module-wise count rates for Quadrant C Data is divided into 100 sec bins |
 |
 |
| Module-wise count rates for Quadrant D Data is divided into 100 sec bins |
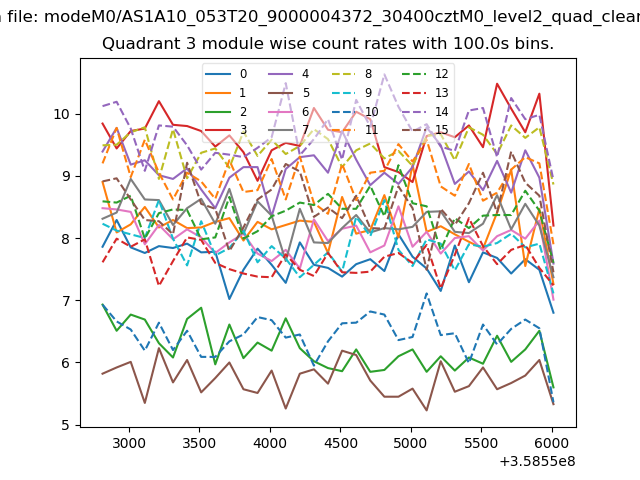 |
 |
| Parameter | Plot |
|---|---|
| CZT HV Monitor | 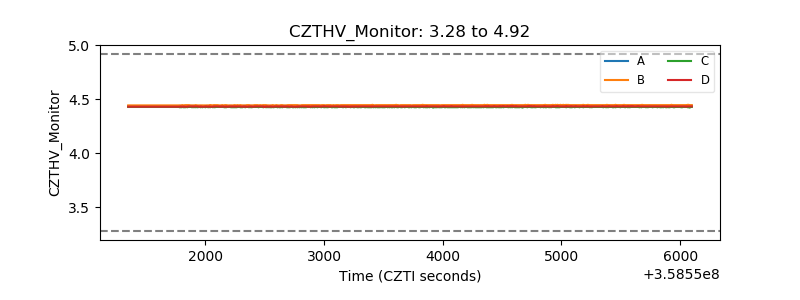 |
| D_VDD | 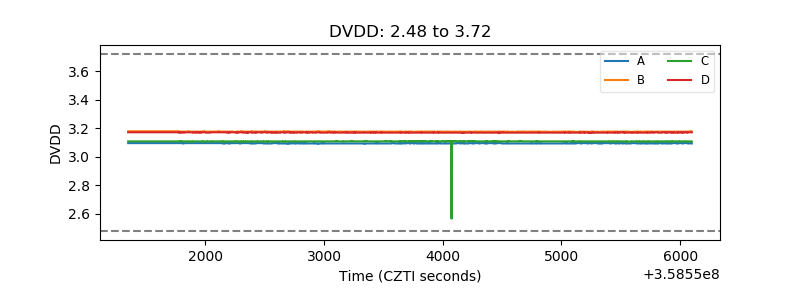 |
| Temperature 1 | 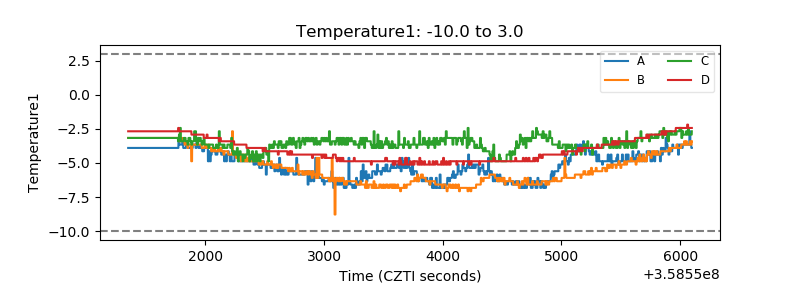 |
| Veto HV Monitor | 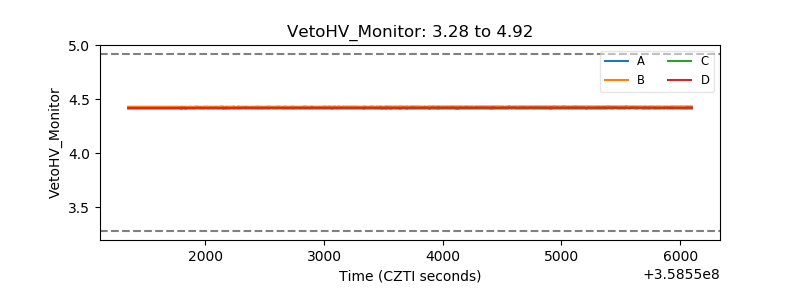 |
| Veto LLD | 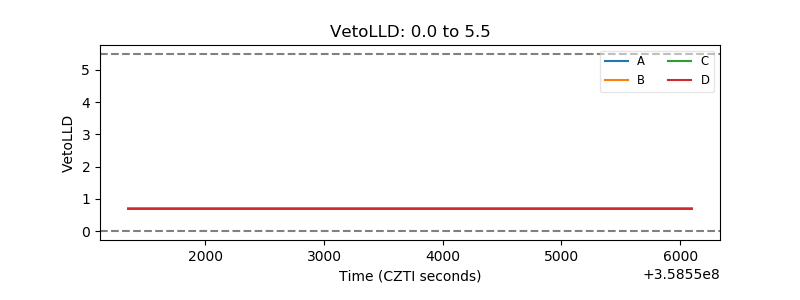 |
| Alpha Counter | 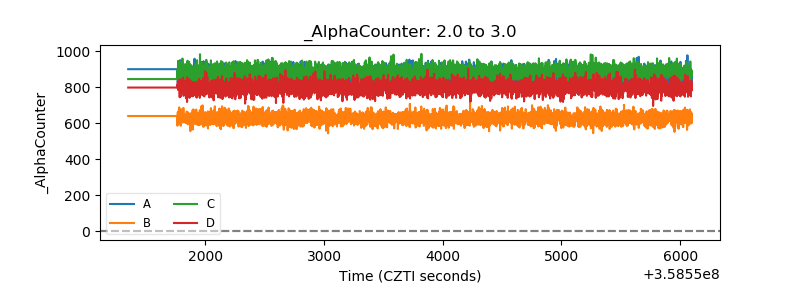 |
| _CPM_Rate | 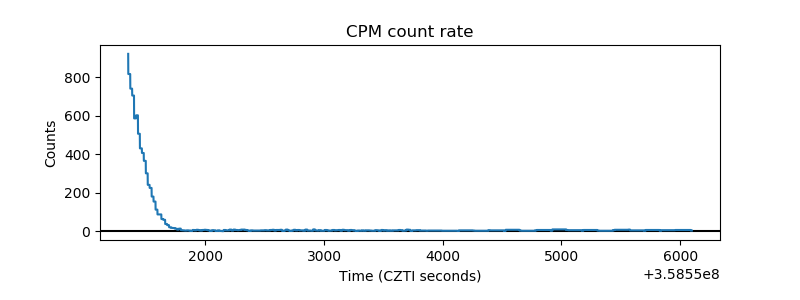 |
| CZT Counter | 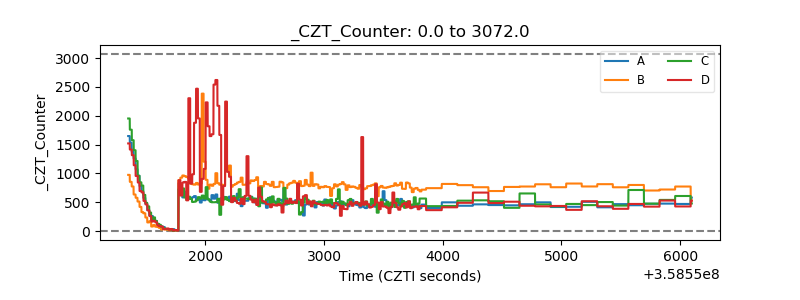 |
| +2.5 Volts monitor |  |
| +5 Volts monitor |  |
| _ROLL_ROT | 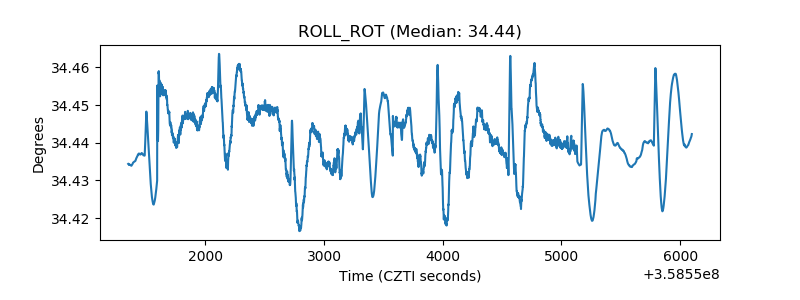 |
| _Roll_DEC | 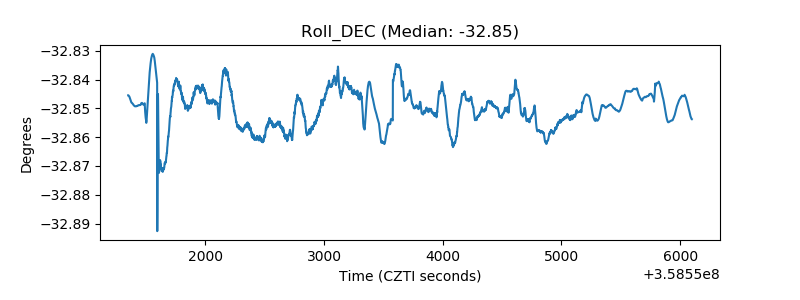 |
| _Roll_RA | 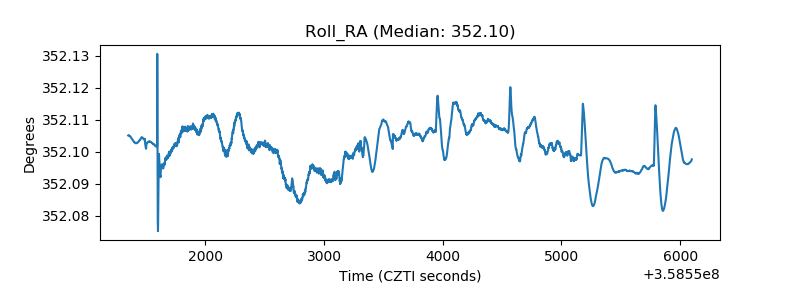 |
| Veto Counter | 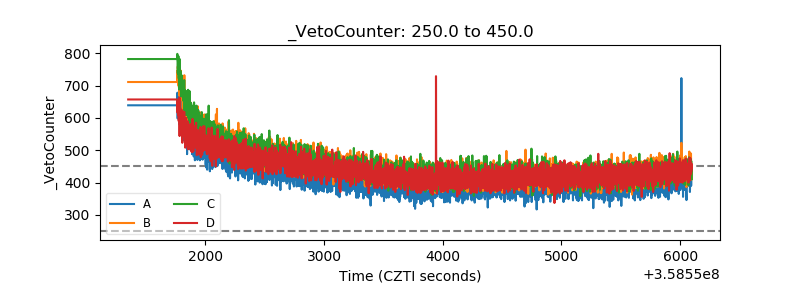 |