| Param | Original file | Final file |
|---|---|---|
| Filename | modeM0/AS1T04_002T01_9000004374cztM0_level2.fits | modeM0/AS1T04_002T01_9000004374cztM0_level2_quad_clean.evt |
| Size (bytes) | 217,794,240 | 241,758,720 |
| Size | 207.7 MB | 230.6 MB |
| Events in quadrant A | 1,335,020 | 1,519,068 |
| Events in quadrant B | 1,259,818 | 1,496,511 |
| Events in quadrant C | 1,271,296 | 1,421,485 |
| Events in quadrant D | 1,123,478 | 1,278,912 |
| Mode M9 | |||
|---|---|---|---|
| Quadrant | BADHDUFLAG | Total packets | Discarded packets |
| A | 0 | 17 | 0 |
| B | 0 | 17 | 0 |
| C | 0 | 17 | 0 |
| D | 0 | 17 | 0 |
| Mode M0 | |||
|---|---|---|---|
| Quadrant | BADHDUFLAG | Total packets | Discarded packets |
| A | 0 | 47818 | 0 |
| B | 0 | 71800 | 0 |
| C | 0 | 50509 | 0 |
| D | 0 | 57318 | 0 |
| Mode SS | |||
|---|---|---|---|
| Quadrant | BADHDUFLAG | Total packets | Discarded packets |
| A | 0 | 476 | 0 |
| B | 0 | 476 | 0 |
| C | 0 | 476 | 0 |
| D | 0 | 476 | 0 |
| Quadrant | Total seconds | Saturated seconds | Saturation percentage |
|---|---|---|---|
| A | 23332 | 194 | 0.831476% |
| B | 23332 | 458 | 1.962969% |
| C | 23332 | 1563 | 6.698954% |
| D | 23332 | 940 | 4.028802% |
Noise dominated data is calculated using 1-second bins in cleaned event files. If a bin has >2000 counts, and if more than 50% of those come from <1% of pixels, then it is considered to be noise-dominated and hence unusable.
| Quadrant | # 1 sec bins | Bins with >0 counts | Bins with >2000 counts | High rate bins dominated by noise | Noise dominated (total time) | Noise dominated (detector-on time) | Marked lightcurve |
|---|---|---|---|---|---|---|---|
| A | 29364 | 23330 | 0 | 0 | 0.00% | 0.00% | 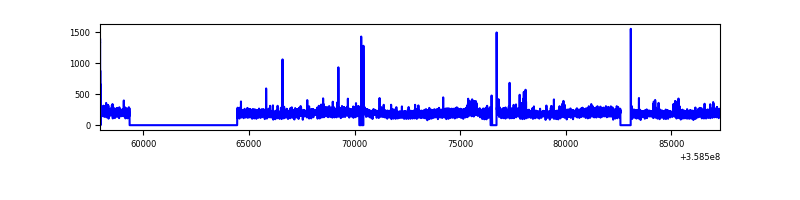 |
| B | 29364 | 23327 | 0 | 0 | 0.00% | 0.00% |  |
| C | 29364 | 23297 | 0 | 0 | 0.00% | 0.00% | 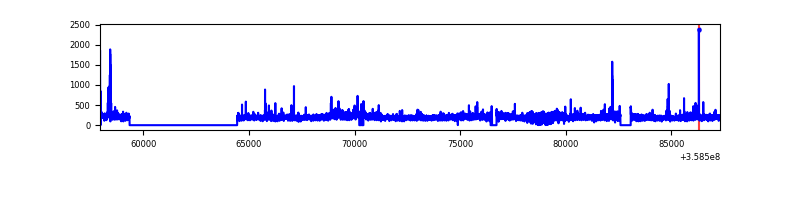 |
| D | 29364 | 23278 | 0 | 0 | 0.00% | 0.00% |  |
Top three noisy pixels from each quadrant. If the there are fewer than three noisy pixels in the level2.evt file, extra rows are filled as -1
| Pixel properties | Quadrant properties | ||||||
|---|---|---|---|---|---|---|---|
| Quadrant | DetID | PixID | Counts | Sigma | Mean | Median | Sigma |
| A | 0 | 29 | 1152 | 9.31 | 348 | 327 | 88.7 |
| A | 7 | 110 | 1062 | 8.29 | 348 | 327 | 88.7 |
| A | 9 | 19 | 1028 | 7.91 | 348 | 327 | 88.7 |
| B | 2 | 9 | 1063 | 11.04 | 333 | 318 | 67.5 |
| B | 14 | 254 | 880 | 8.33 | 333 | 318 | 67.5 |
| B | 5 | 255 | 851 | 7.9 | 333 | 318 | 67.5 |
| C | 12 | 241 | 892 | 6.72 | 336 | 314 | 86.1 |
| C | 2 | 191 | 869 | 6.45 | 336 | 314 | 86.1 |
| C | 12 | 250 | 866 | 6.41 | 336 | 314 | 86.1 |
| D | 3 | 14 | 904 | 7.1 | 320 | 291 | 86.3 |
| D | 15 | 46 | 847 | 6.44 | 320 | 291 | 86.3 |
| D | 10 | 189 | 831 | 6.26 | 320 | 291 | 86.3 |
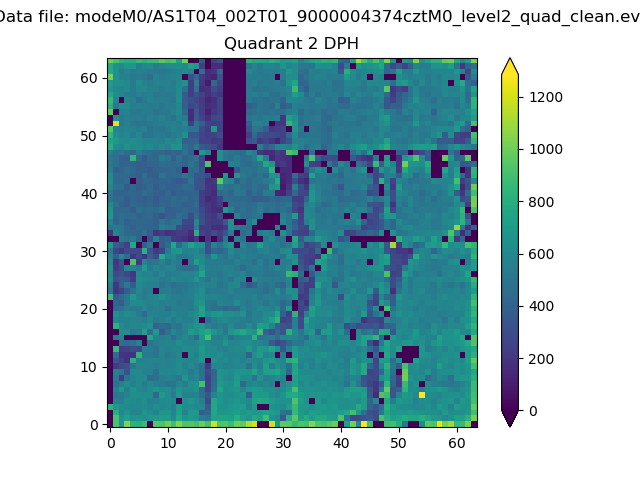
Histogram calculated using DETX and DETY for each event in the final _common_clean file
| Quadrant A | 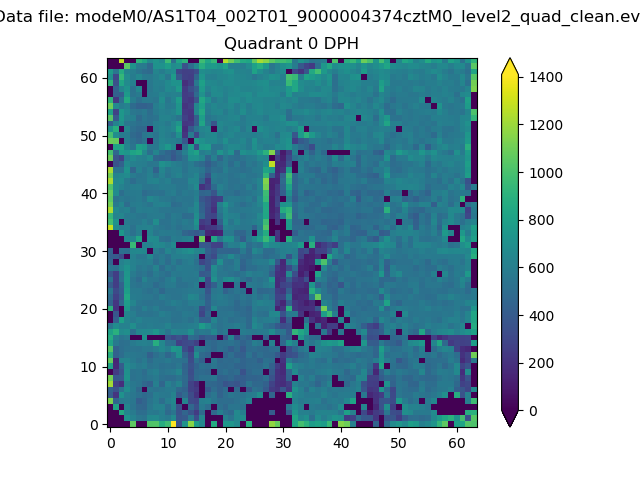 |
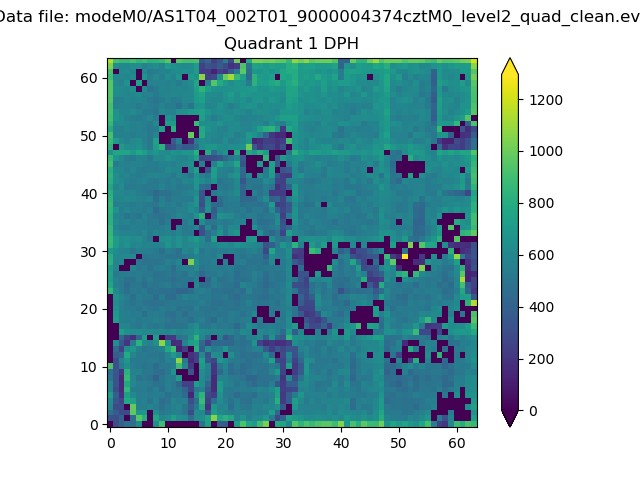 |
Quadrant B |
|---|---|---|---|
| Quadrant D |  |
 |
Quadrant C |
| Plot type | Count rate plots | Images |
|---|---|---|
| Comparison with Poisson distribution Blue bars denote a histogram of data divided into 1 sec bins. Red curve is a Poisson curve with rate = median count rate of data. |
 |
 |
| Quadrant-wise count rates Data is divided into 100 sec bins |
 |
|
| Module-wise count rates for Quadrant A Data is divided into 100 sec bins |
 |
 |
| Module-wise count rates for Quadrant B Data is divided into 100 sec bins |
 |
 |
| Module-wise count rates for Quadrant C Data is divided into 100 sec bins |
 |
 |
| Module-wise count rates for Quadrant D Data is divided into 100 sec bins |
 |
 |
| Parameter | Plot |
|---|---|
| CZT HV Monitor |  |
| D_VDD | 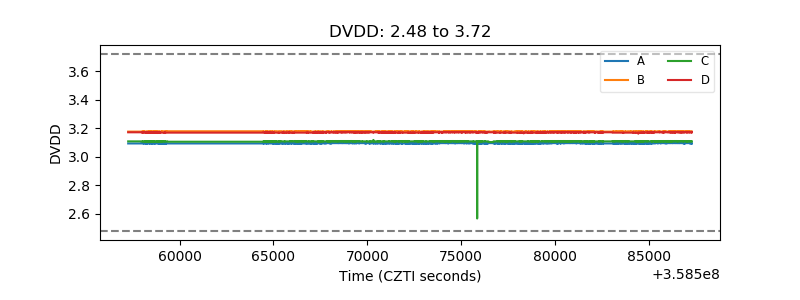 |
| Temperature 1 | 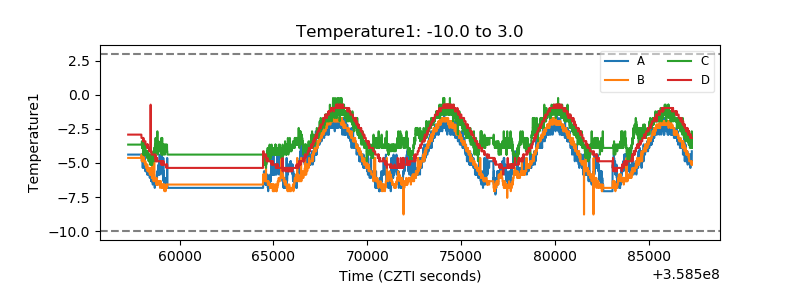 |
| Veto HV Monitor | 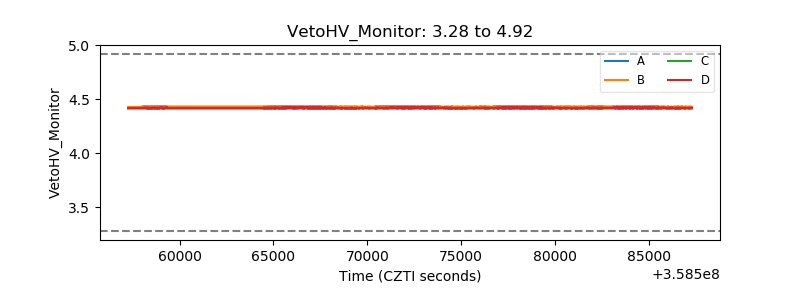 |
| Veto LLD |  |
| Alpha Counter |  |
| _CPM_Rate |  |
| CZT Counter |  |
| +2.5 Volts monitor | 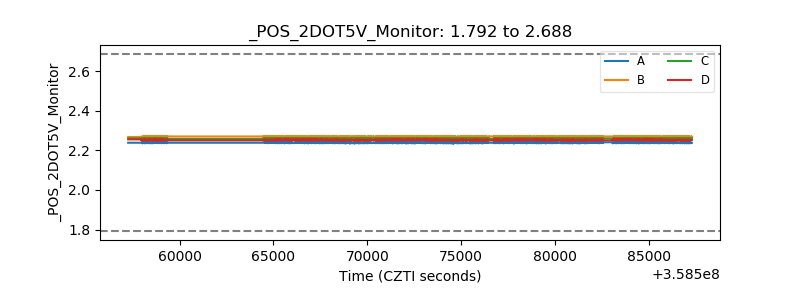 |
| +5 Volts monitor |  |
| _ROLL_ROT |  |
| _Roll_DEC |  |
| _Roll_RA |  |
| Veto Counter |  |