| Param | Original file | Final file |
|---|---|---|
| Filename | modeM0/AS1T04_002T01_9000004374_30402cztM0_level2.evt | modeM0/AS1T04_002T01_9000004374_30402cztM0_level2_quad_clean.evt |
| Size (bytes) | 581,495,040 | 114,102,720 |
| Size | 554.6 MB | 108.8 MB |
| Events in quadrant A | 3,450,694 | 746,065 |
| Events in quadrant B | 5,830,911 | 745,776 |
| Events in quadrant C | 3,635,128 | 731,706 |
| Events in quadrant D | 4,188,479 | 713,004 |
| Mode M9 | |||
|---|---|---|---|
| Quadrant | BADHDUFLAG | Total packets | Discarded packets |
| A | 0 | 2 | 0 |
| B | 0 | 2 | 0 |
| C | 0 | 2 | 0 |
| D | 0 | 2 | 0 |
| Mode M0 | |||
|---|---|---|---|
| Quadrant | BADHDUFLAG | Total packets | Discarded packets |
| A | 0 | 15353 | 2 |
| B | 0 | 22924 | 1 |
| C | 0 | 15850 | 1 |
| D | 0 | 17886 | 1 |
| Mode SS | |||
|---|---|---|---|
| Quadrant | BADHDUFLAG | Total packets | Discarded packets |
| A | 0 | 154 | 0 |
| B | 0 | 154 | 0 |
| C | 0 | 154 | 0 |
| D | 0 | 154 | 0 |
| Quadrant | Total seconds | Saturated seconds | Saturation percentage |
|---|---|---|---|
| A | 7454 | 72 | 0.965924% |
| B | 7455 | 191 | 2.562039% |
| C | 7455 | 151 | 2.025486% |
| D | 7455 | 195 | 2.615694% |
Noise dominated data is calculated using 1-second bins in cleaned event files. If a bin has >2000 counts, and if more than 50% of those come from <1% of pixels, then it is considered to be noise-dominated and hence unusable.
| Quadrant | # 1 sec bins | Bins with >0 counts | Bins with >2000 counts | High rate bins dominated by noise | Noise dominated (total time) | Noise dominated (detector-on time) | Marked lightcurve |
|---|---|---|---|---|---|---|---|
| A | 7619 | 7456 | 0 | 0 | 0.00% | 0.00% | 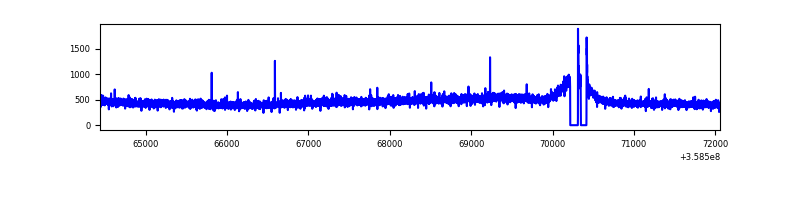 |
| B | 7620 | 7455 | 1 | 1 | 0.01% | 0.01% | 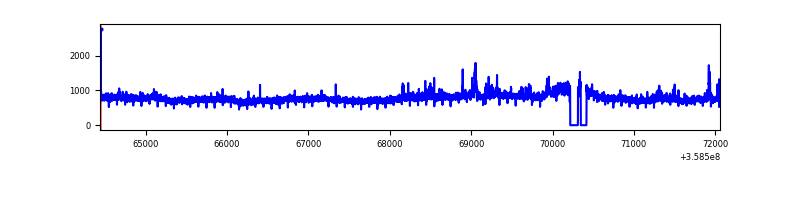 |
| C | 7620 | 7457 | 1 | 1 | 0.01% | 0.01% | 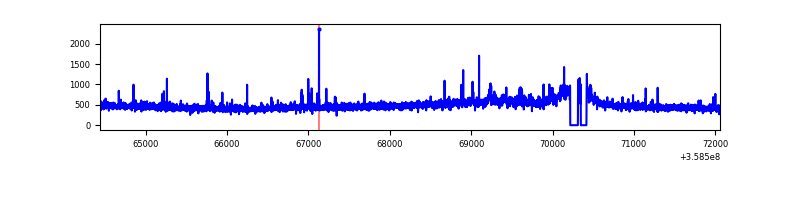 |
| D | 7620 | 7457 | 115 | 115 | 1.51% | 1.54% | 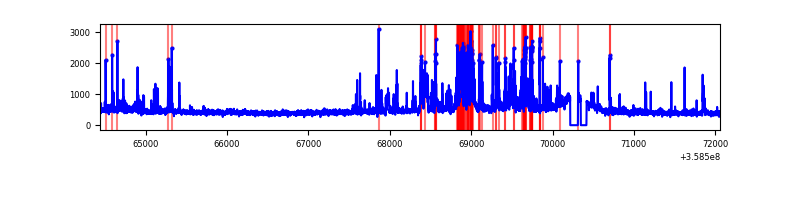 |
Top three noisy pixels from each quadrant. If the there are fewer than three noisy pixels in the level2.evt file, extra rows are filled as -1
| Pixel properties | Quadrant properties | ||||||
|---|---|---|---|---|---|---|---|
| Quadrant | DetID | PixID | Counts | Sigma | Mean | Median | Sigma |
| A | 8 | 192 | 16726 | 88.54 | 888 | 869 | 179.1 |
| A | 13 | 254 | 14996 | 78.88 | 888 | 869 | 179.1 |
| A | 3 | 137 | 9099 | 45.95 | 888 | 869 | 179.1 |
| B | 6 | 159 | 2116882 | 12497.45 | 881 | 858 | 169.3 |
| B | 0 | 229 | 230589 | 1356.81 | 881 | 858 | 169.3 |
| B | 12 | 111 | 21027 | 119.12 | 881 | 858 | 169.3 |
| C | 14 | 238 | 147185 | 731.77 | 854 | 859 | 200.0 |
| C | 3 | 233 | 119665 | 594.15 | 854 | 859 | 200.0 |
| C | 2 | 114 | 17132 | 81.38 | 854 | 859 | 200.0 |
| D | 13 | 249 | 248889 | 1212.87 | 851 | 825 | 204.5 |
| D | 2 | 250 | 234843 | 1144.2 | 851 | 825 | 204.5 |
| D | 13 | 104 | 221926 | 1081.04 | 851 | 825 | 204.5 |
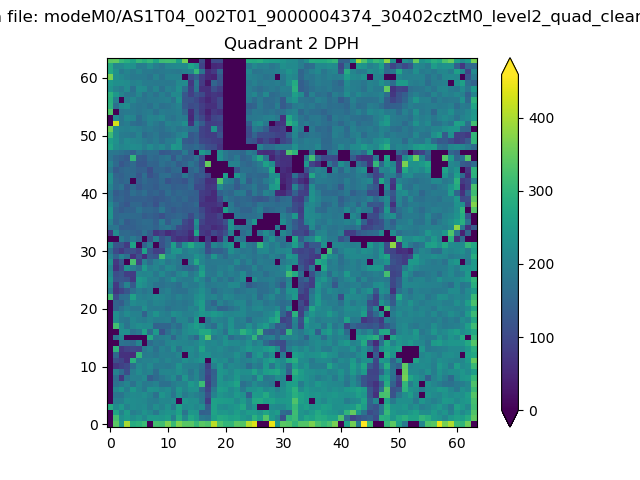
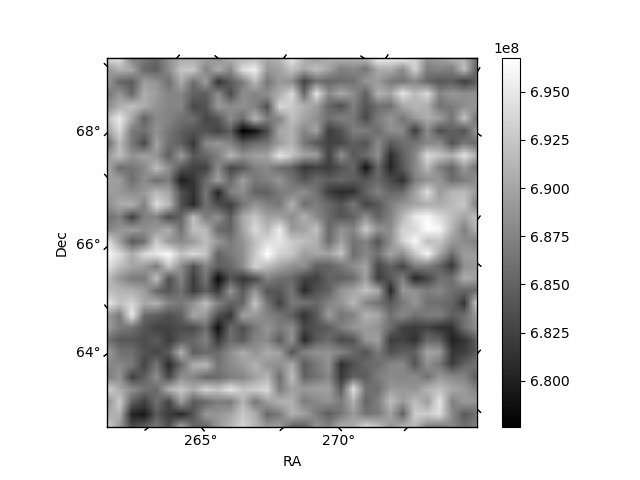
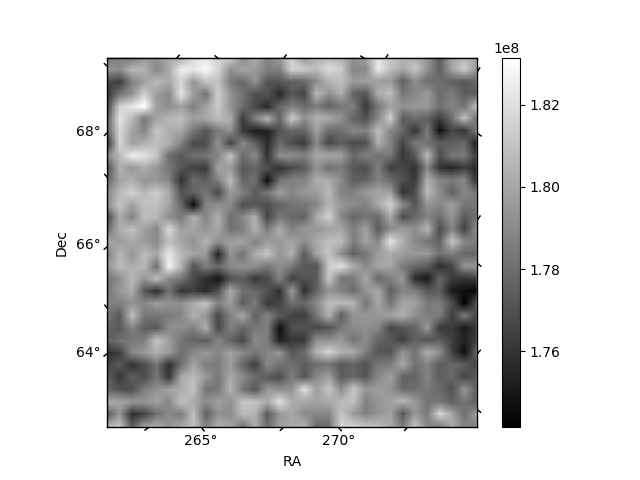
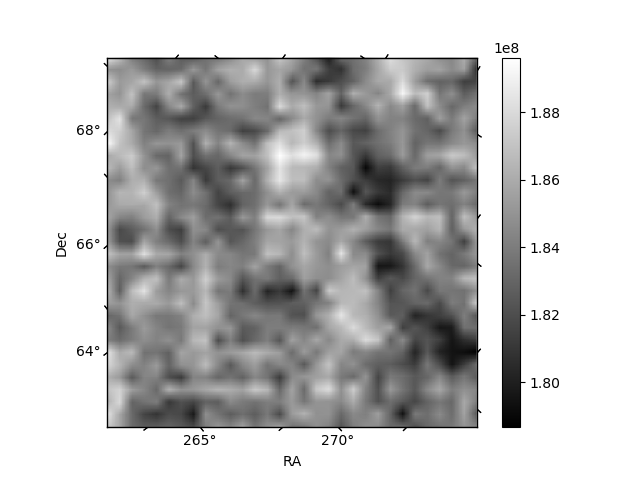
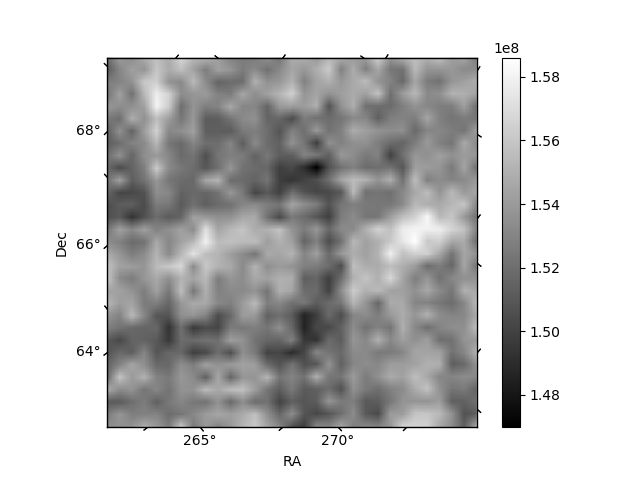
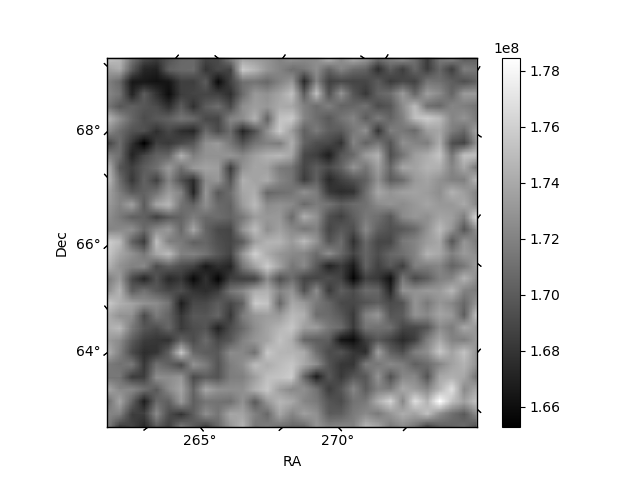
Histogram calculated using DETX and DETY for each event in the final _common_clean file
| Quadrant A | 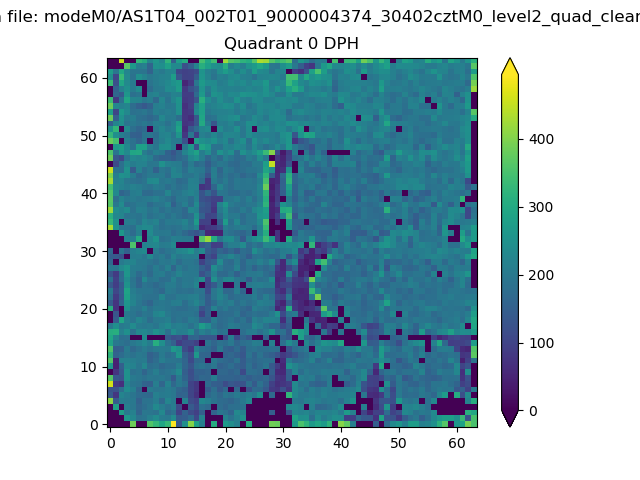 |
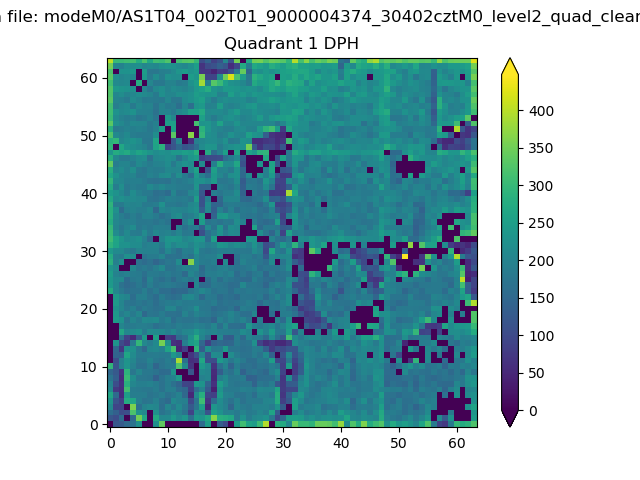 |
Quadrant B |
|---|---|---|---|
| Quadrant D | 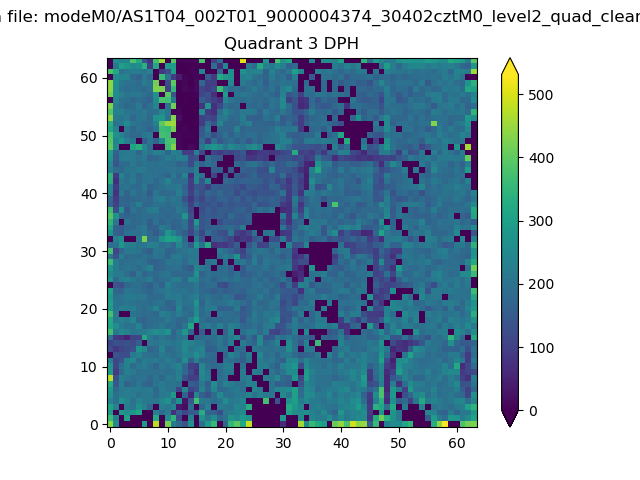 |
 |
Quadrant C |
| Plot type | Count rate plots | Images |
|---|---|---|
| Comparison with Poisson distribution Blue bars denote a histogram of data divided into 1 sec bins. Red curve is a Poisson curve with rate = median count rate of data. |
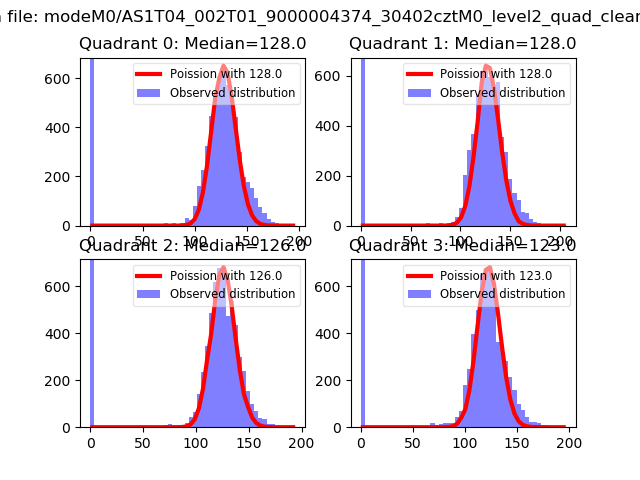 |
 |
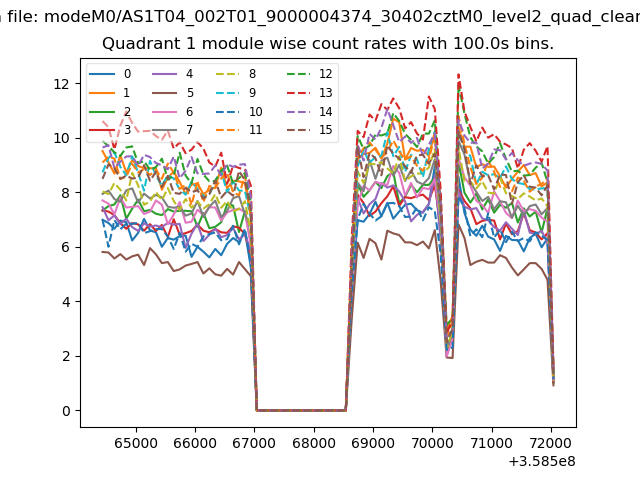
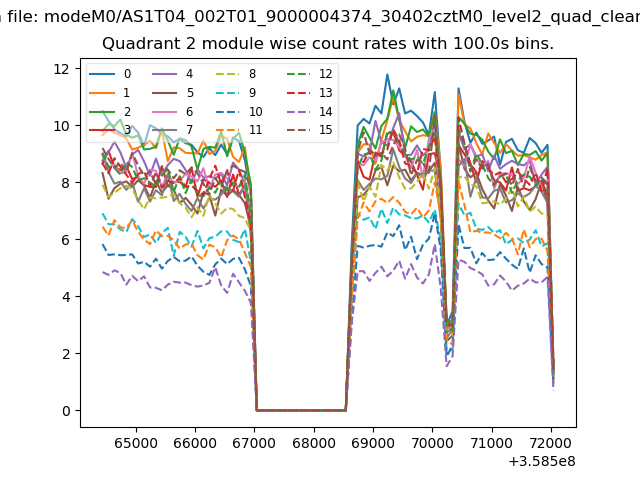
| Quadrant-wise count rates Data is divided into 100 sec bins |
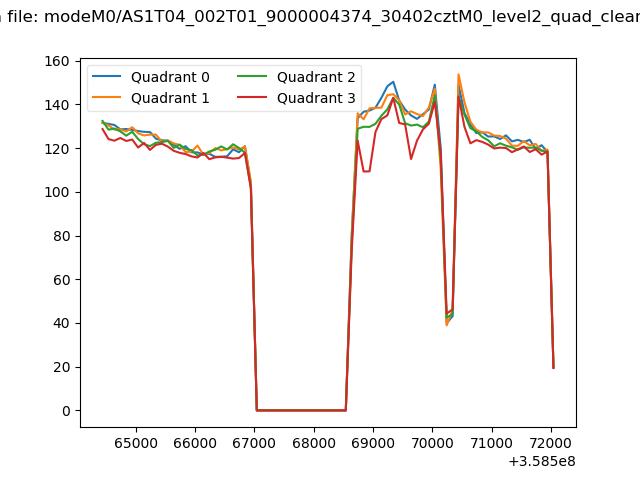 |
|
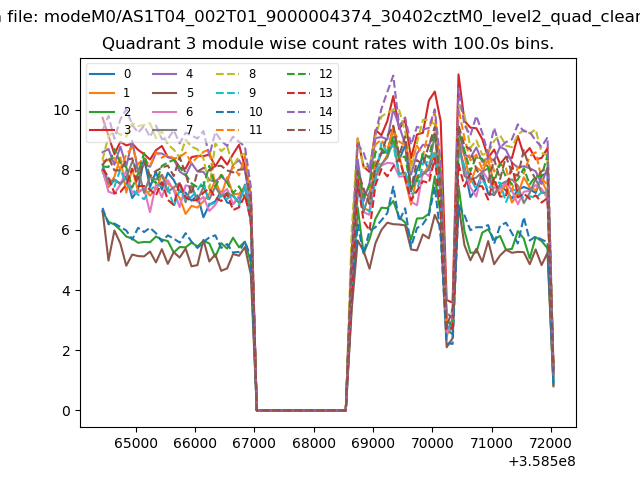
| Module-wise count rates for Quadrant A Data is divided into 100 sec bins |
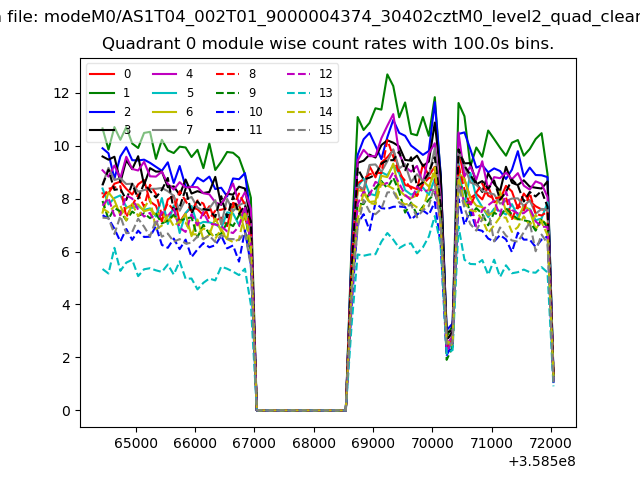 |
 |
| Module-wise count rates for Quadrant B Data is divided into 100 sec bins |
 |
 |
| Module-wise count rates for Quadrant C Data is divided into 100 sec bins |
 |
 |
| Module-wise count rates for Quadrant D Data is divided into 100 sec bins |
 |
 |
| Parameter | Plot |
|---|---|
| CZT HV Monitor | 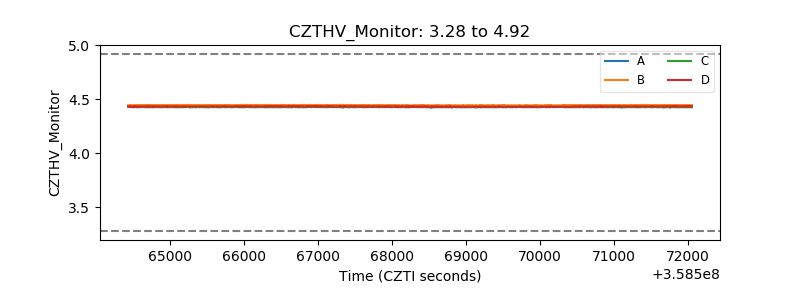 |
| D_VDD | 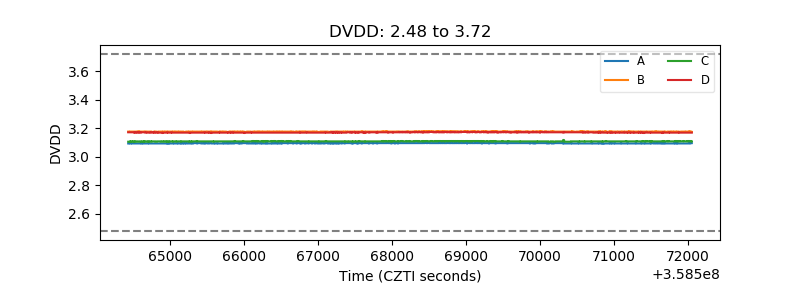 |
| Temperature 1 | 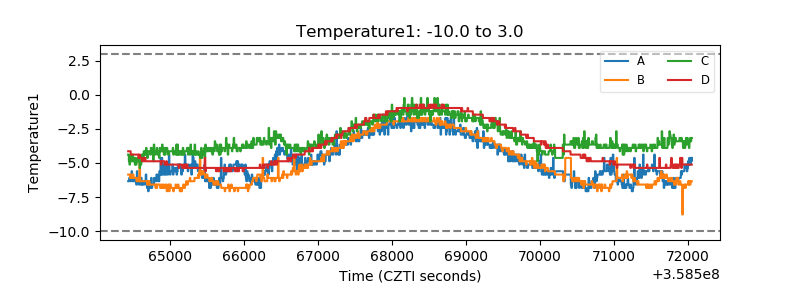 |
| Veto HV Monitor |  |
| Veto LLD | 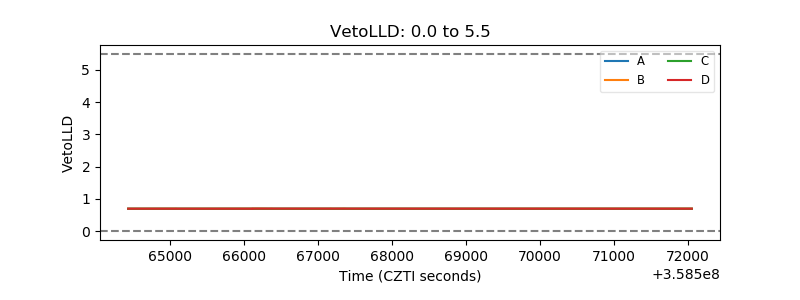 |
| Alpha Counter | 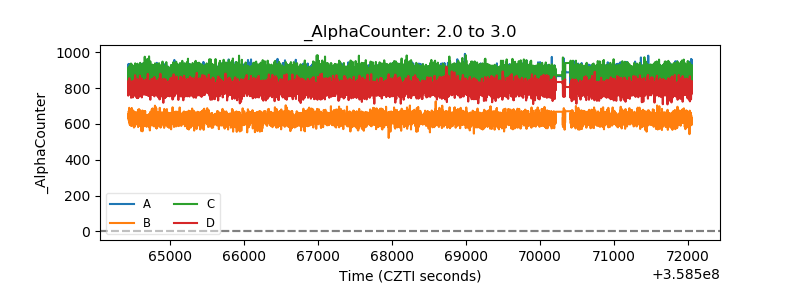 |
| _CPM_Rate | 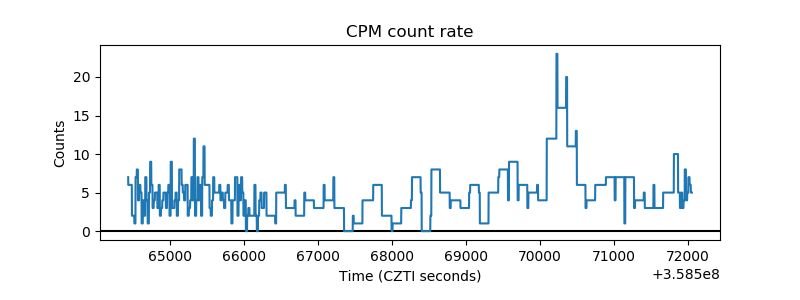 |
| CZT Counter | 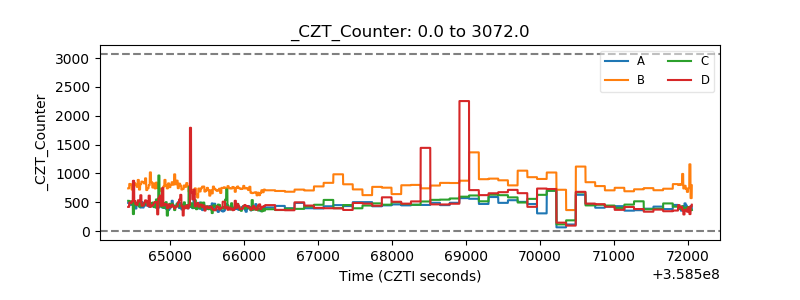 |
| +2.5 Volts monitor | 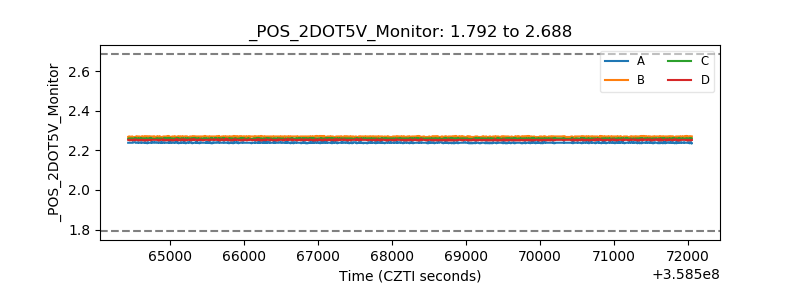 |
| +5 Volts monitor |  |
| _ROLL_ROT | 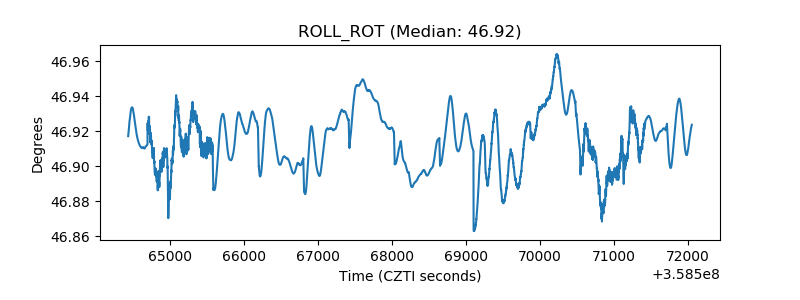 |
| _Roll_DEC | 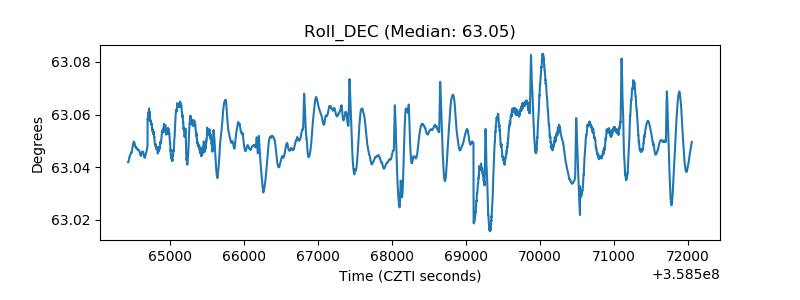 |
| _Roll_RA | 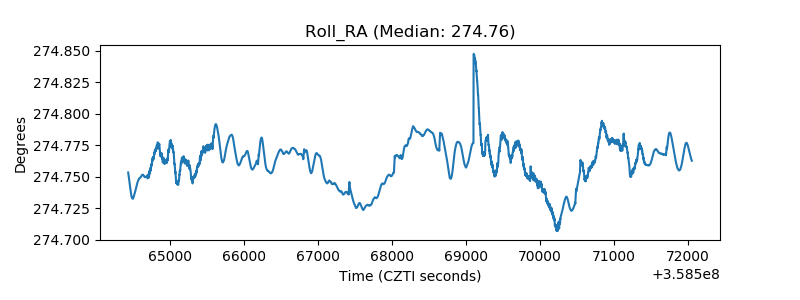 |
| Veto Counter | 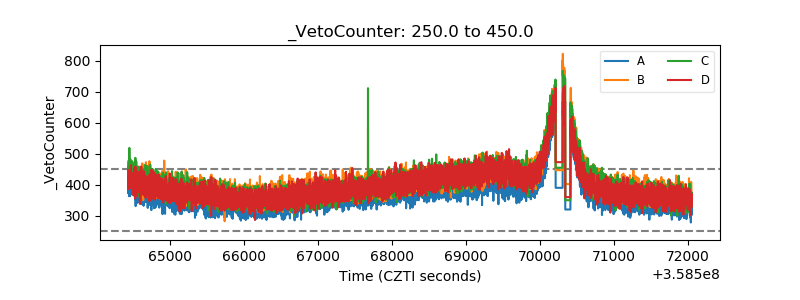 |