| Param | Original file | Final file |
|---|---|---|
| Filename | modeM0/AS1T04_002T01_9000004374_30403cztM0_level2.evt | modeM0/AS1T04_002T01_9000004374_30403cztM0_level2_quad_clean.evt |
| Size (bytes) | 637,712,640 | 125,150,400 |
| Size | 608.2 MB | 119.4 MB |
| Events in quadrant A | 3,814,852 | 822,910 |
| Events in quadrant B | 6,452,073 | 821,639 |
| Events in quadrant C | 4,056,128 | 801,257 |
| Events in quadrant D | 4,443,216 | 783,109 |
| Mode M9 | |||
|---|---|---|---|
| Quadrant | BADHDUFLAG | Total packets | Discarded packets |
| A | 0 | 5 | 0 |
| B | 0 | 5 | 0 |
| C | 0 | 5 | 0 |
| D | 0 | 5 | 0 |
| Mode M0 | |||
|---|---|---|---|
| Quadrant | BADHDUFLAG | Total packets | Discarded packets |
| A | 0 | 16886 | 2 |
| B | 0 | 25050 | 2 |
| C | 0 | 17375 | 2 |
| D | 0 | 19222 | 2 |
| Mode SS | |||
|---|---|---|---|
| Quadrant | BADHDUFLAG | Total packets | Discarded packets |
| A | 0 | 168 | 0 |
| B | 0 | 168 | 0 |
| C | 0 | 168 | 0 |
| D | 0 | 168 | 0 |
| Quadrant | Total seconds | Saturated seconds | Saturation percentage |
|---|---|---|---|
| A | 8078 | 135 | 1.671206% |
| B | 8079 | 281 | 3.478153% |
| C | 8079 | 389 | 4.814952% |
| D | 8079 | 253 | 3.131576% |
Noise dominated data is calculated using 1-second bins in cleaned event files. If a bin has >2000 counts, and if more than 50% of those come from <1% of pixels, then it is considered to be noise-dominated and hence unusable.
| Quadrant | # 1 sec bins | Bins with >0 counts | Bins with >2000 counts | High rate bins dominated by noise | Noise dominated (total time) | Noise dominated (detector-on time) | Marked lightcurve |
|---|---|---|---|---|---|---|---|
| A | 8508 | 8080 | 0 | 0 | 0.00% | 0.00% | 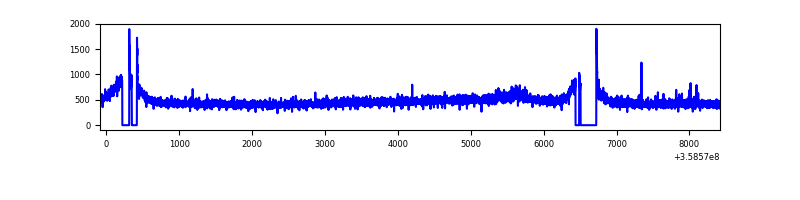 |
| B | 8509 | 8079 | 0 | 0 | 0.00% | 0.00% | 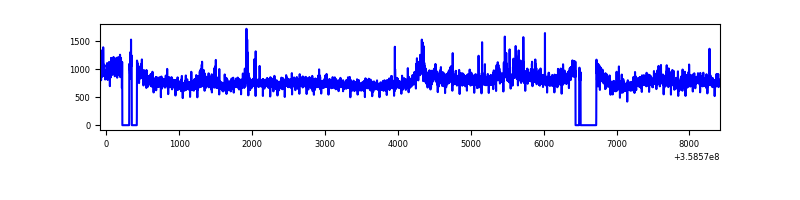 |
| C | 8508 | 8081 | 0 | 0 | 0.00% | 0.00% | 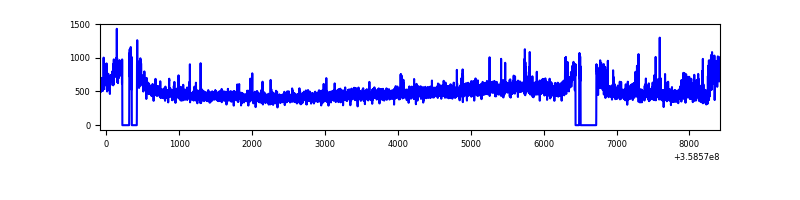 |
| D | 8509 | 8082 | 166 | 166 | 1.95% | 2.05% | 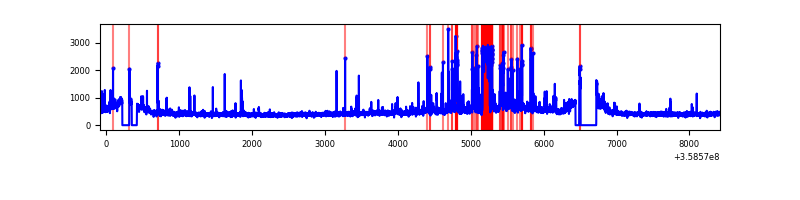 |
Top three noisy pixels from each quadrant. If the there are fewer than three noisy pixels in the level2.evt file, extra rows are filled as -1
| Pixel properties | Quadrant properties | ||||||
|---|---|---|---|---|---|---|---|
| Quadrant | DetID | PixID | Counts | Sigma | Mean | Median | Sigma |
| A | 8 | 192 | 30926 | 152.19 | 973 | 952 | 196.9 |
| A | 14 | 239 | 28975 | 142.29 | 973 | 952 | 196.9 |
| A | 13 | 254 | 14740 | 70.01 | 973 | 952 | 196.9 |
| B | 6 | 159 | 2289255 | 12177.12 | 967 | 938 | 187.9 |
| B | 0 | 229 | 347164 | 1842.42 | 967 | 938 | 187.9 |
| B | 12 | 111 | 23571 | 120.44 | 967 | 938 | 187.9 |
| C | 14 | 238 | 228606 | 1051.08 | 928 | 933 | 216.6 |
| C | 14 | 254 | 112461 | 514.88 | 928 | 933 | 216.6 |
| C | 3 | 233 | 77843 | 355.06 | 928 | 933 | 216.6 |
| D | 13 | 249 | 485602 | 1985.59 | 922 | 905 | 244.1 |
| D | 13 | 104 | 130177 | 529.57 | 922 | 905 | 244.1 |
| D | 8 | 195 | 126308 | 513.72 | 922 | 905 | 244.1 |
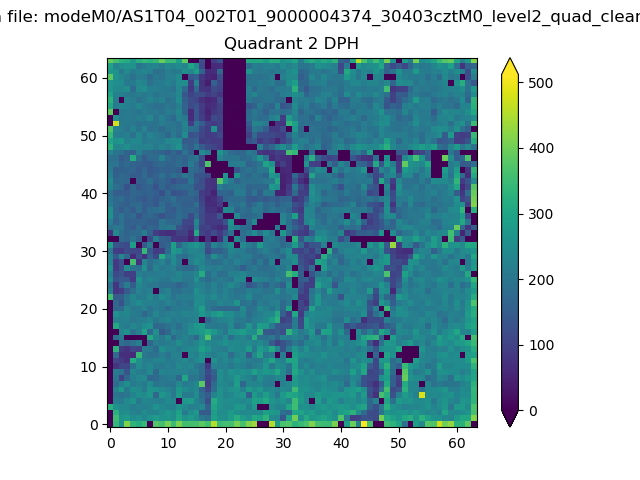
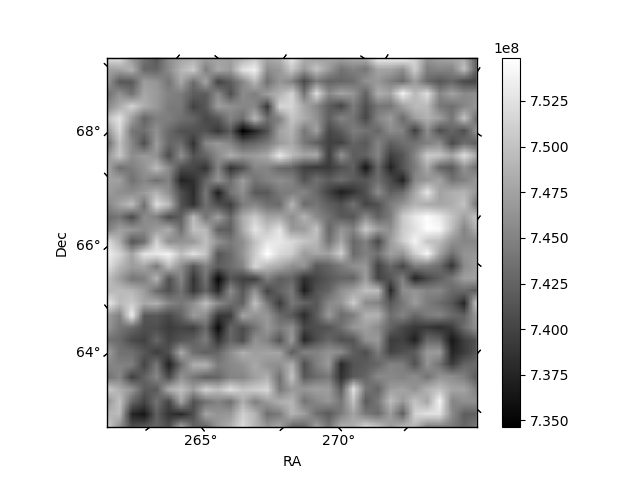
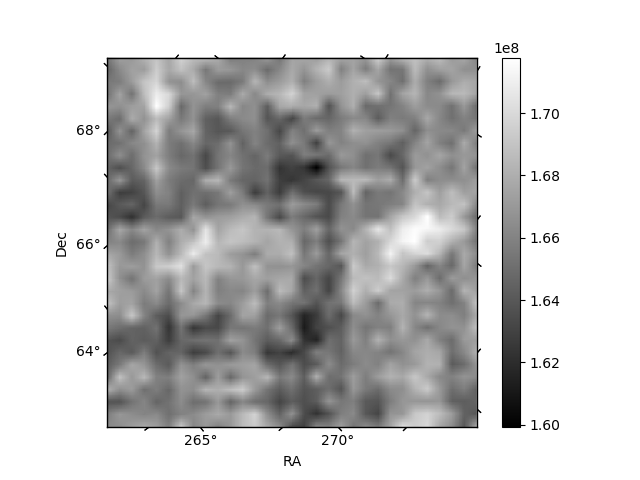
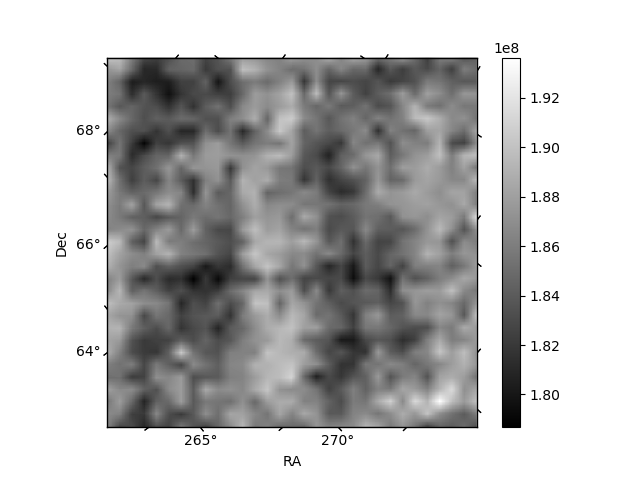
Histogram calculated using DETX and DETY for each event in the final _common_clean file
| Quadrant A | 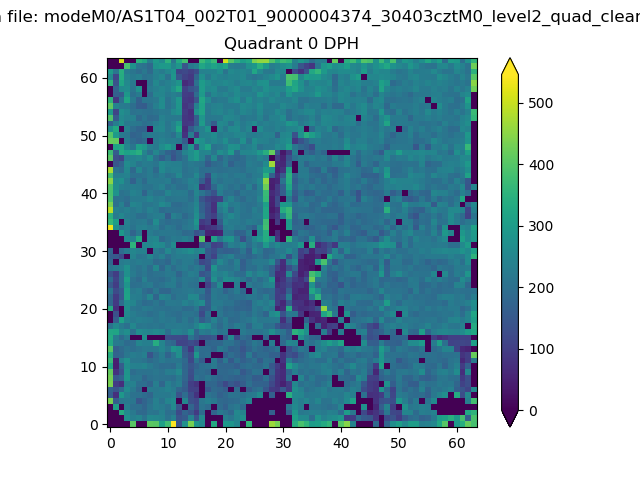 |
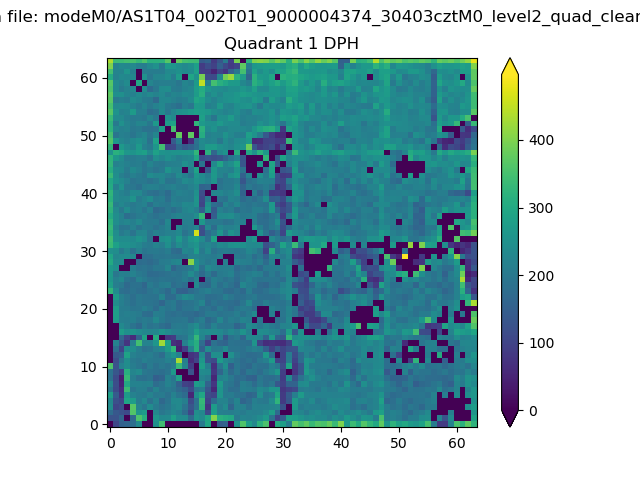 |
Quadrant B |
|---|---|---|---|
| Quadrant D | 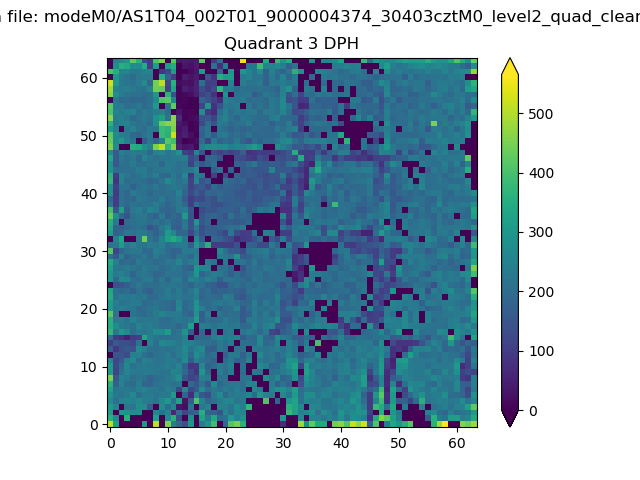 |
 |
Quadrant C |
| Plot type | Count rate plots | Images |
|---|---|---|
| Comparison with Poisson distribution Blue bars denote a histogram of data divided into 1 sec bins. Red curve is a Poisson curve with rate = median count rate of data. |
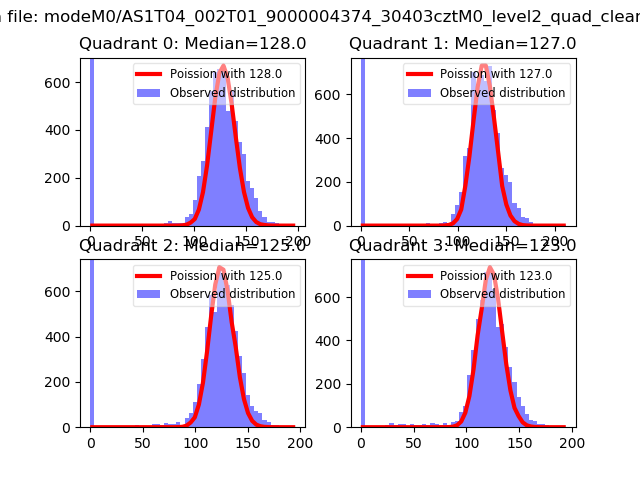 |
 |
| Quadrant-wise count rates Data is divided into 100 sec bins |
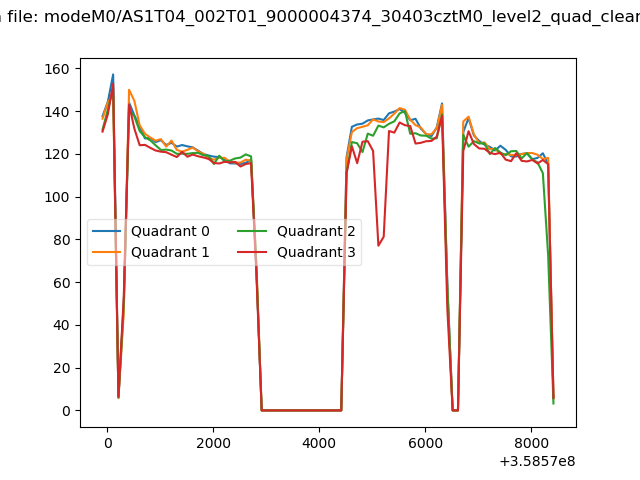 |
|
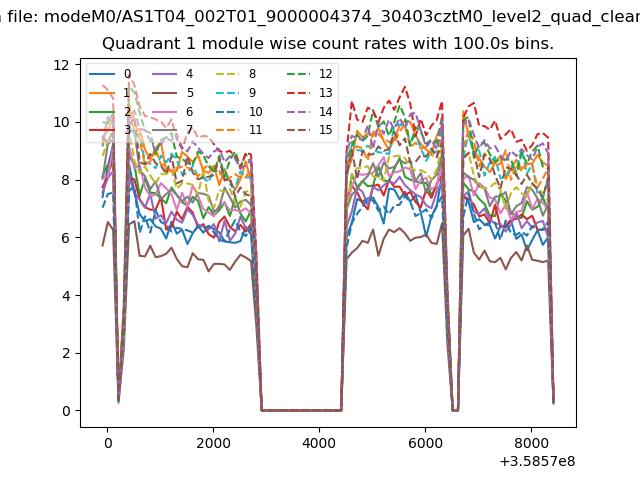
| Module-wise count rates for Quadrant A Data is divided into 100 sec bins |
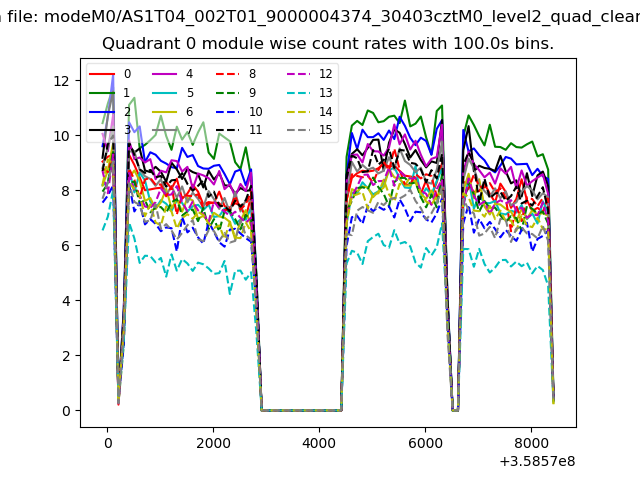 |
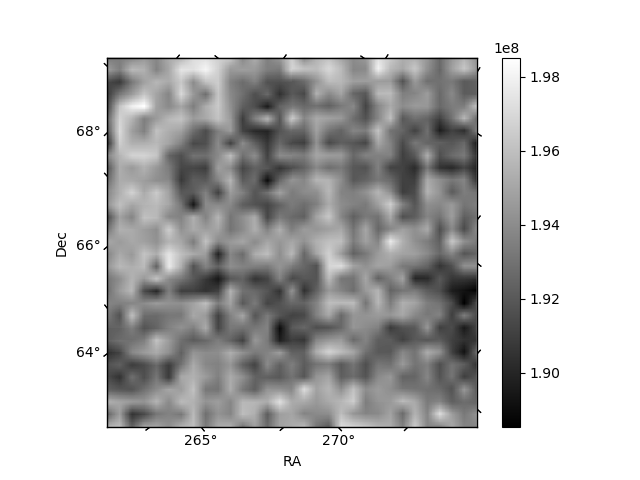 |
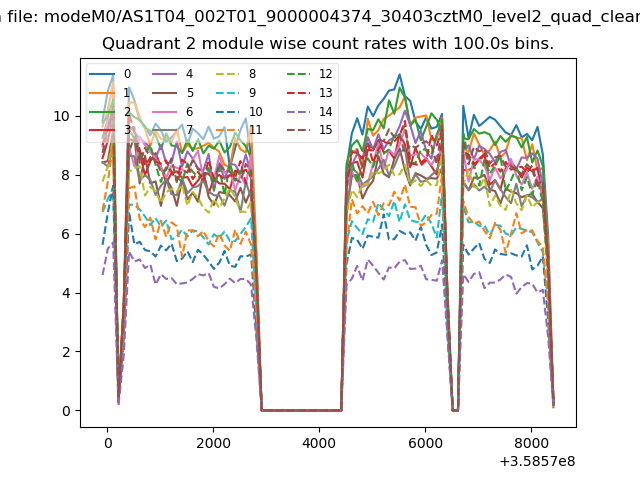
| Module-wise count rates for Quadrant B Data is divided into 100 sec bins |
 |
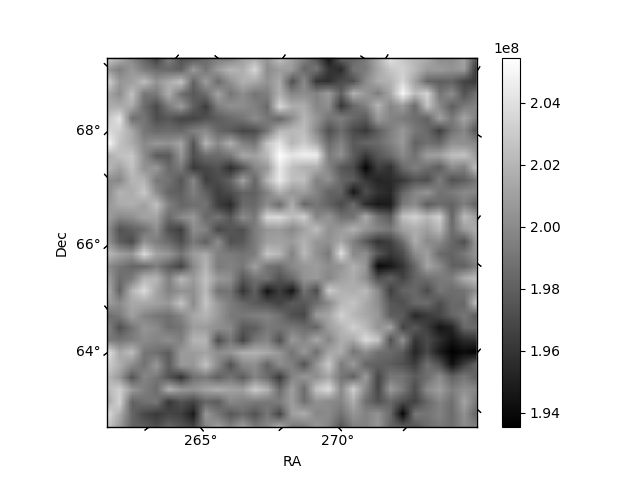 |
| Module-wise count rates for Quadrant C Data is divided into 100 sec bins |
 |
 |
| Module-wise count rates for Quadrant D Data is divided into 100 sec bins |
 |
 |
| Parameter | Plot |
|---|---|
| CZT HV Monitor | 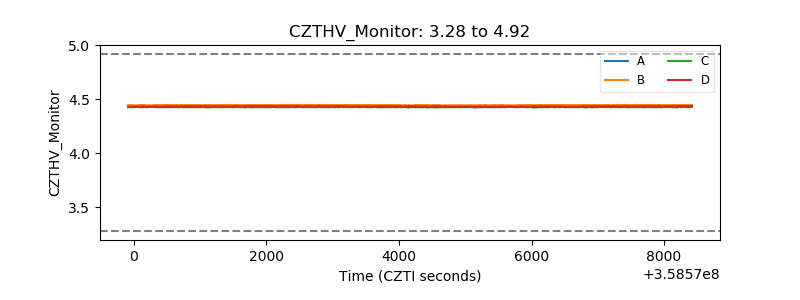 |
| D_VDD | 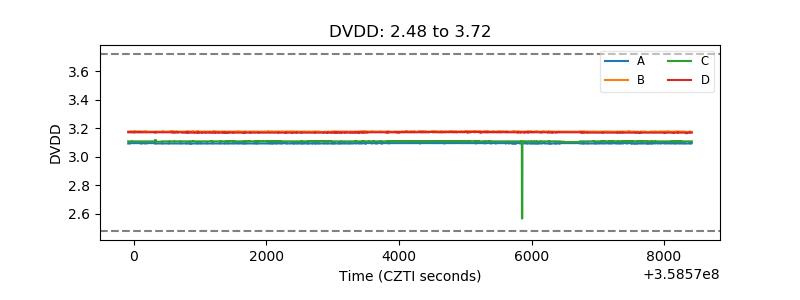 |
| Temperature 1 | 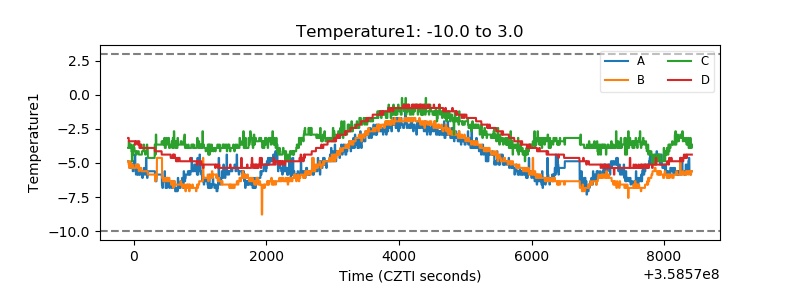 |
| Veto HV Monitor | 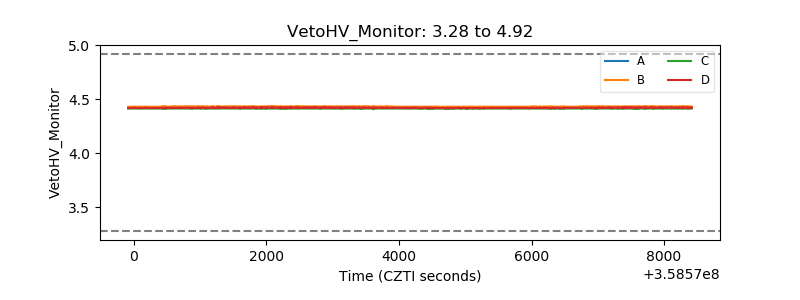 |
| Veto LLD |  |
| Alpha Counter | 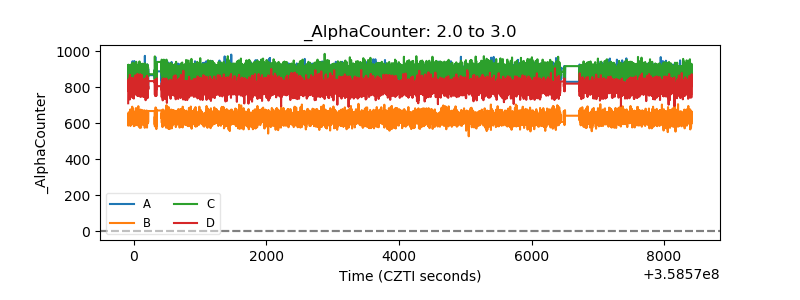 |
| _CPM_Rate | 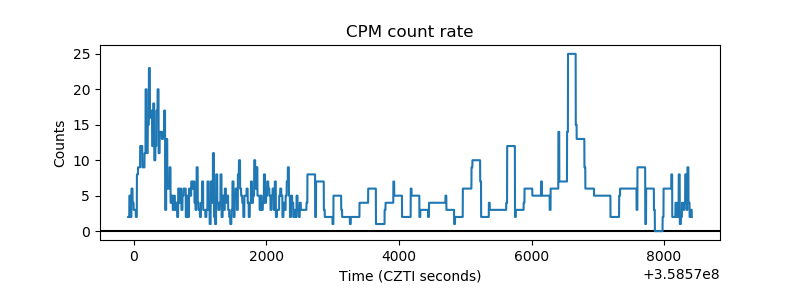 |
| CZT Counter | 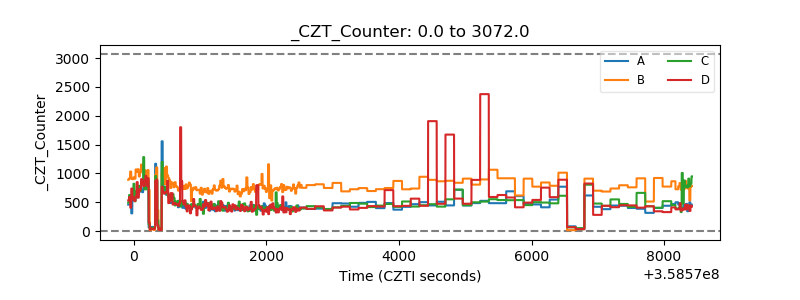 |
| +2.5 Volts monitor |  |
| +5 Volts monitor |  |
| _ROLL_ROT | 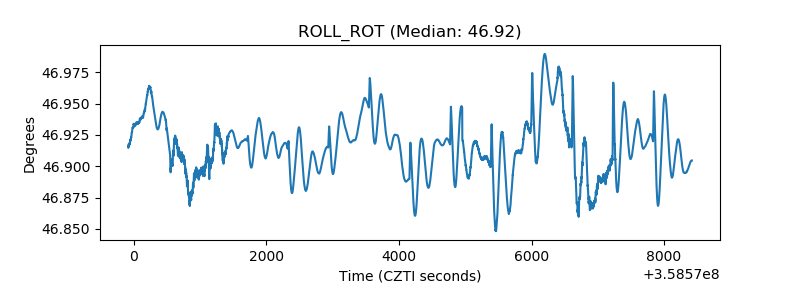 |
| _Roll_DEC | 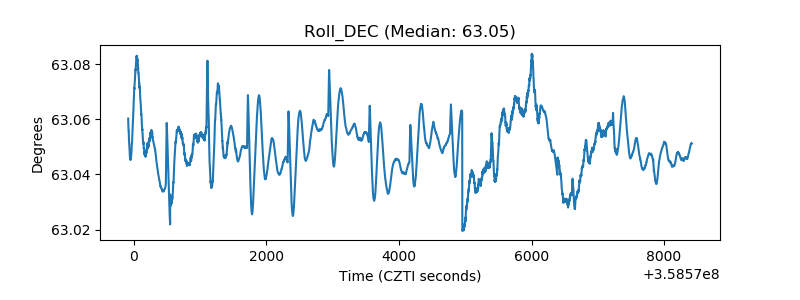 |
| _Roll_RA | 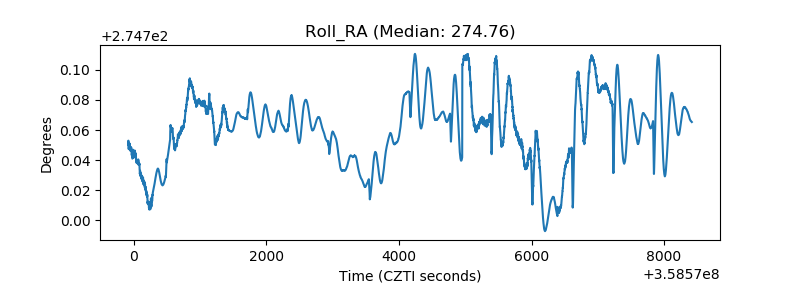 |
| Veto Counter | 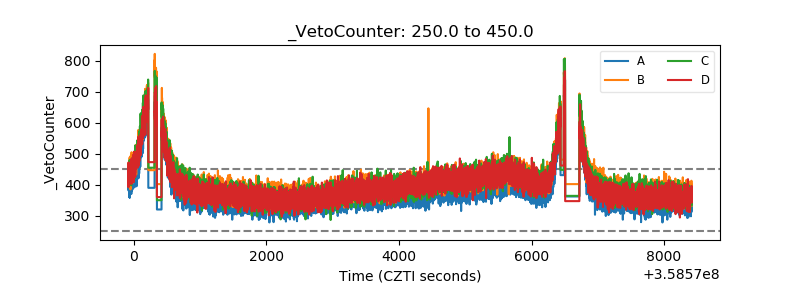 |