| Param | Original file | Final file |
|---|---|---|
| Filename | modeM0/AS1T04_002T01_9000004374_30406cztM0_level2.evt | modeM0/AS1T04_002T01_9000004374_30406cztM0_level2_quad_clean.evt |
| Size (bytes) | 786,867,840 | 126,751,680 |
| Size | 750.4 MB | 120.9 MB |
| Events in quadrant A | 4,428,992 | 818,682 |
| Events in quadrant B | 7,719,003 | 814,574 |
| Events in quadrant C | 5,116,442 | 776,609 |
| Events in quadrant D | 5,903,555 | 750,396 |
| Mode M9 | |||
|---|---|---|---|
| Quadrant | BADHDUFLAG | Total packets | Discarded packets |
| A | 0 | 5 | 0 |
| B | 0 | 5 | 0 |
| C | 0 | 5 | 0 |
| D | 0 | 5 | 0 |
| Mode M0 | |||
|---|---|---|---|
| Quadrant | BADHDUFLAG | Total packets | Discarded packets |
| A | 0 | 19749 | 1 |
| B | 0 | 30013 | 1 |
| C | 0 | 21414 | 1 |
| D | 0 | 24456 | 1 |
| Mode SS | |||
|---|---|---|---|
| Quadrant | BADHDUFLAG | Total packets | Discarded packets |
| A | 0 | 198 | 0 |
| B | 0 | 198 | 0 |
| C | 0 | 198 | 0 |
| D | 0 | 198 | 0 |
| Quadrant | Total seconds | Saturated seconds | Saturation percentage |
|---|---|---|---|
| A | 9781 | 37 | 0.378284% |
| B | 9781 | 103 | 1.053062% |
| C | 9781 | 1166 | 11.921071% |
| D | 9781 | 498 | 5.091504% |
Noise dominated data is calculated using 1-second bins in cleaned event files. If a bin has >2000 counts, and if more than 50% of those come from <1% of pixels, then it is considered to be noise-dominated and hence unusable.
| Quadrant | # 1 sec bins | Bins with >0 counts | Bins with >2000 counts | High rate bins dominated by noise | Noise dominated (total time) | Noise dominated (detector-on time) | Marked lightcurve |
|---|---|---|---|---|---|---|---|
| A | 10271 | 9782 | 0 | 0 | 0.00% | 0.00% | 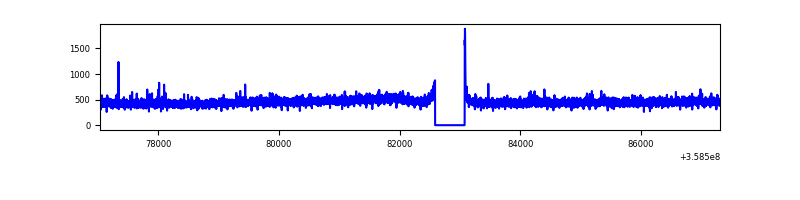 |
| B | 10271 | 9781 | 8 | 8 | 0.08% | 0.08% | 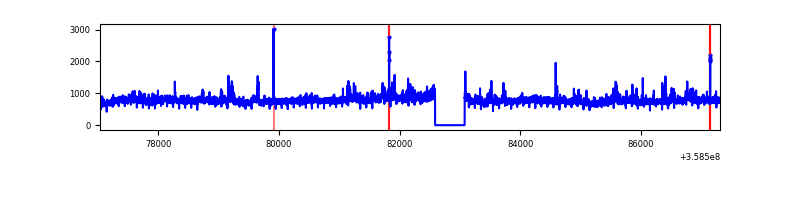 |
| C | 10271 | 9782 | 5 | 5 | 0.05% | 0.05% | 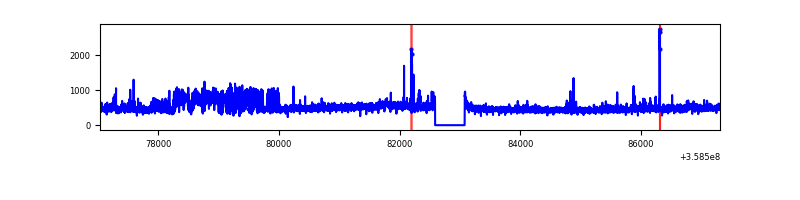 |
| D | 10271 | 9782 | 429 | 429 | 4.18% | 4.39% | 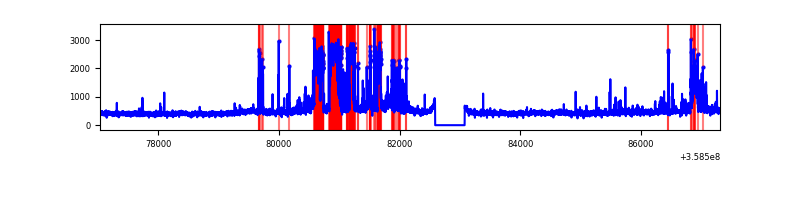 |
Top three noisy pixels from each quadrant. If the there are fewer than three noisy pixels in the level2.evt file, extra rows are filled as -1
| Pixel properties | Quadrant properties | ||||||
|---|---|---|---|---|---|---|---|
| Quadrant | DetID | PixID | Counts | Sigma | Mean | Median | Sigma |
| A | 14 | 239 | 23609 | 99.33 | 1136 | 1112 | 226.5 |
| A | 13 | 254 | 17730 | 73.37 | 1136 | 1112 | 226.5 |
| A | 8 | 192 | 15773 | 64.73 | 1136 | 1112 | 226.5 |
| B | 6 | 159 | 2743545 | 12714.03 | 1124 | 1094 | 215.7 |
| B | 0 | 229 | 541692 | 2506.22 | 1124 | 1094 | 215.7 |
| B | 12 | 111 | 26947 | 119.85 | 1124 | 1094 | 215.7 |
| C | 14 | 238 | 506780 | 2109.93 | 1029 | 1034 | 239.7 |
| C | 14 | 254 | 453905 | 1889.34 | 1029 | 1034 | 239.7 |
| C | 3 | 233 | 72731 | 299.11 | 1029 | 1034 | 239.7 |
| D | 13 | 249 | 900452 | 3241.71 | 1055 | 1035 | 277.5 |
| D | 13 | 104 | 363317 | 1305.75 | 1055 | 1035 | 277.5 |
| D | 8 | 195 | 211903 | 760.02 | 1055 | 1035 | 277.5 |
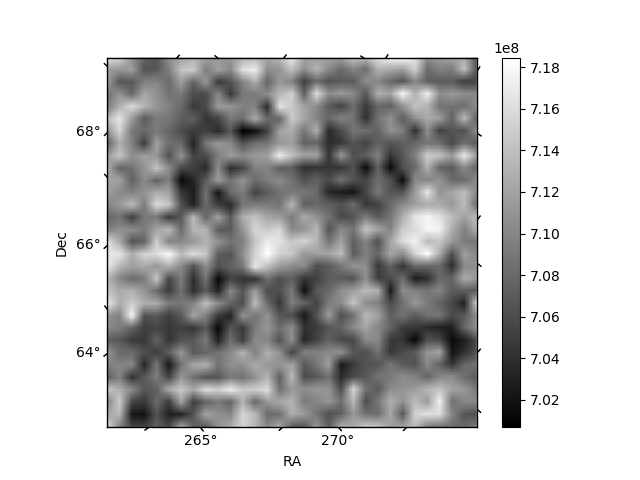
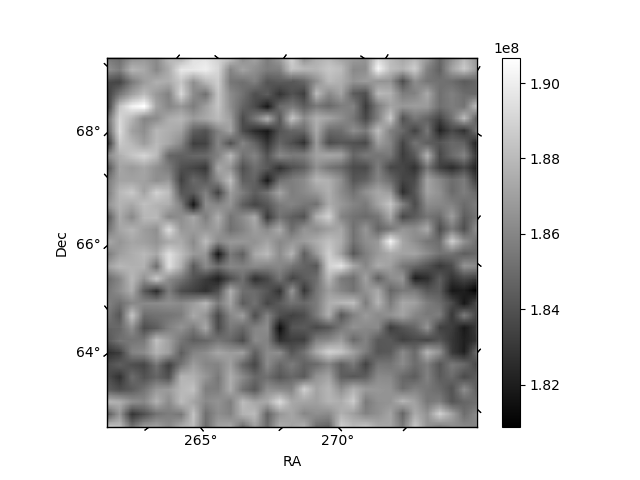
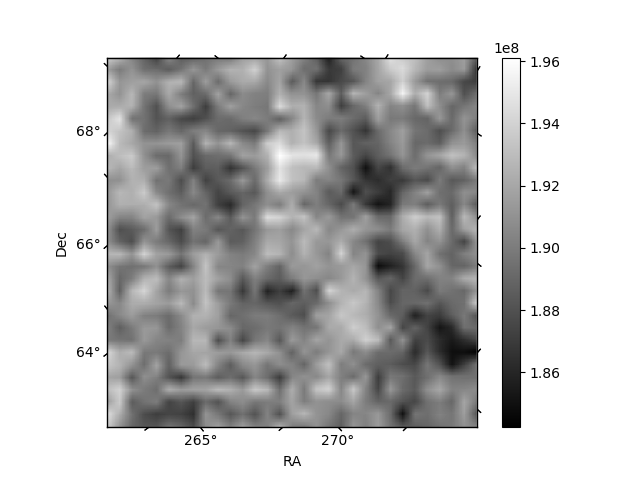
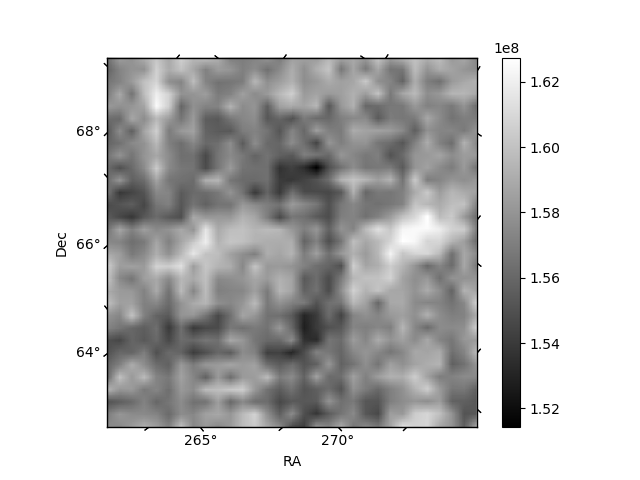
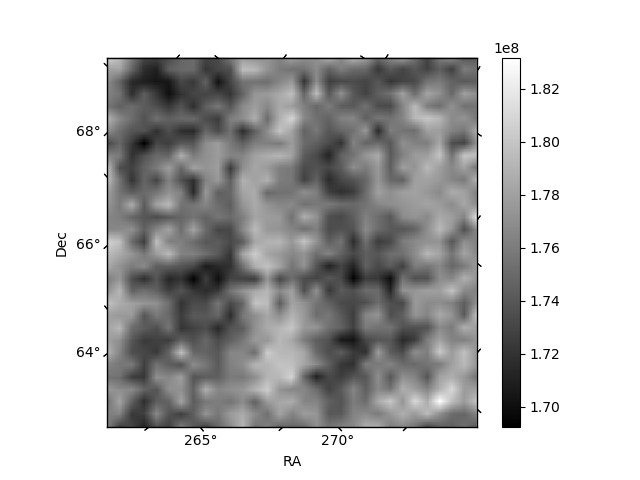
Histogram calculated using DETX and DETY for each event in the final _common_clean file
| Quadrant A | 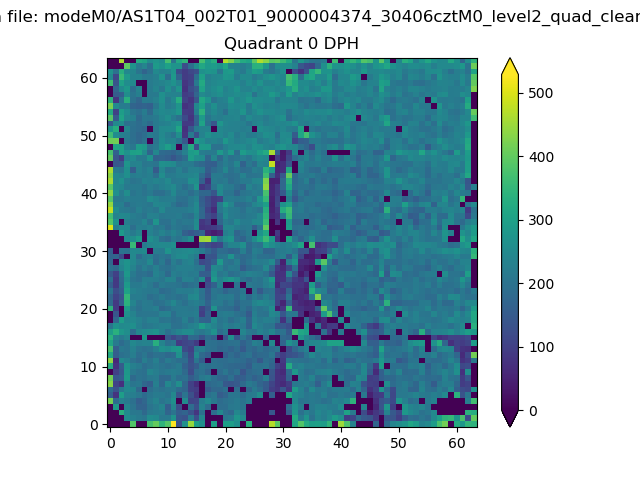 |
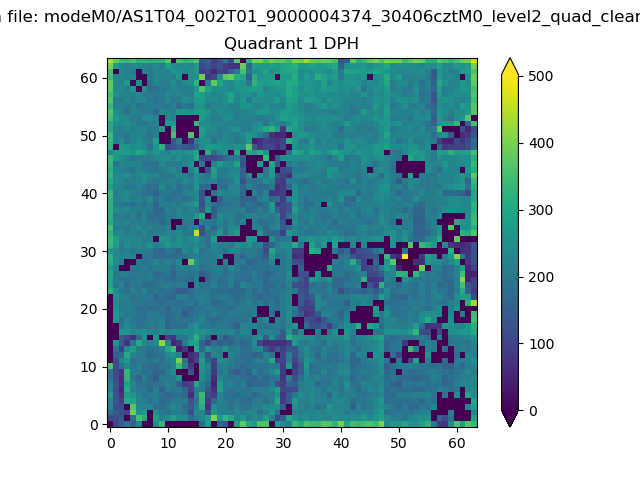 |
Quadrant B |
|---|---|---|---|
| Quadrant D | 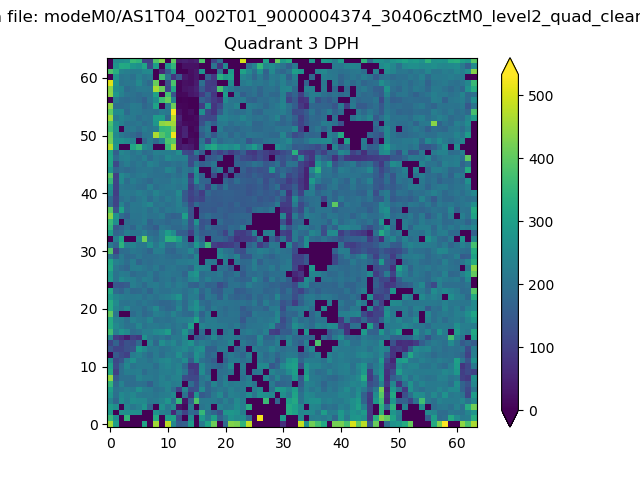 |
 |
Quadrant C |
| Plot type | Count rate plots | Images |
|---|---|---|
| Comparison with Poisson distribution Blue bars denote a histogram of data divided into 1 sec bins. Red curve is a Poisson curve with rate = median count rate of data. |
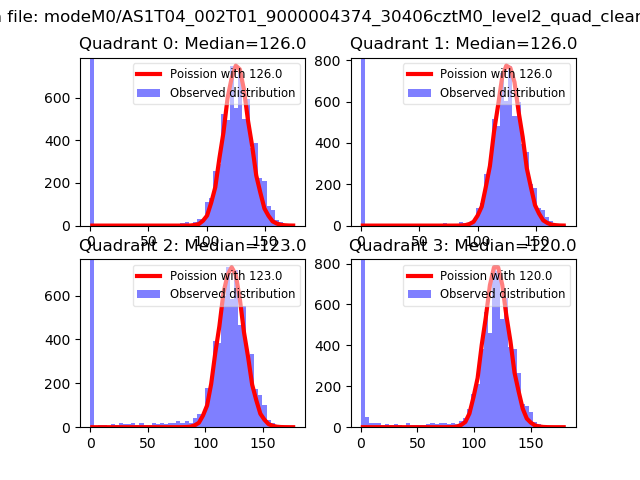 |
 |
| Quadrant-wise count rates Data is divided into 100 sec bins |
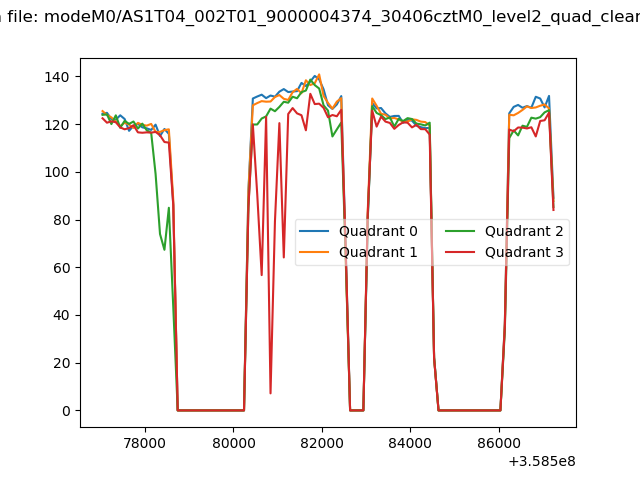 |
|
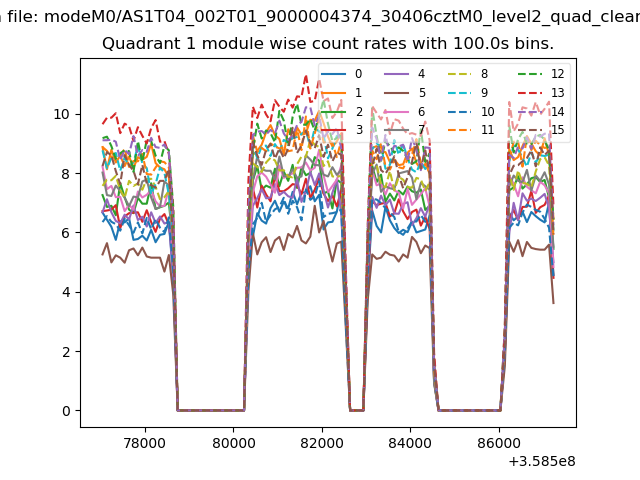
| Module-wise count rates for Quadrant A Data is divided into 100 sec bins |
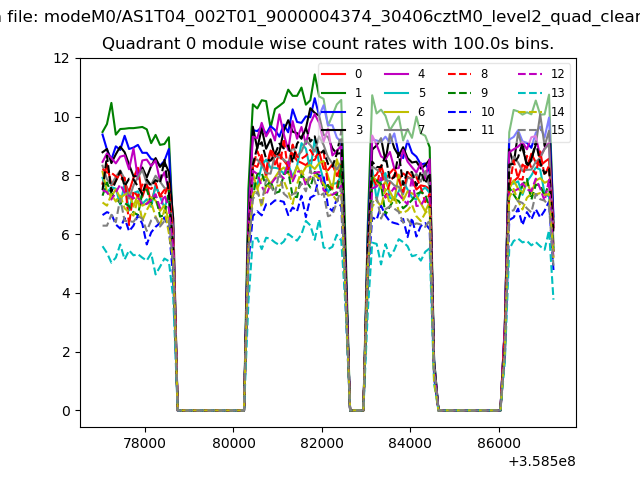 |
 |
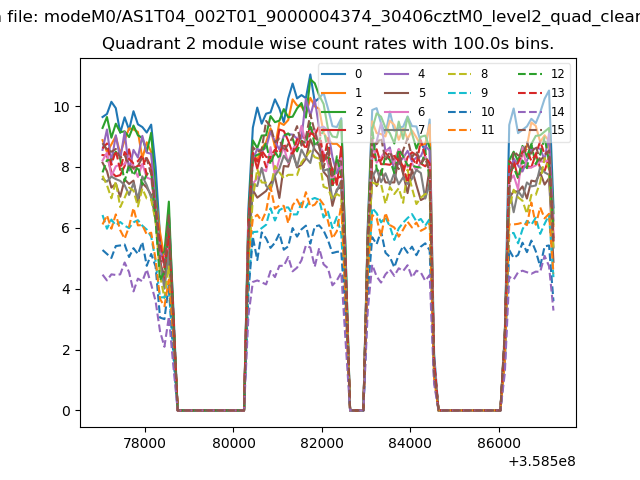
| Module-wise count rates for Quadrant B Data is divided into 100 sec bins |
 |
 |
| Module-wise count rates for Quadrant C Data is divided into 100 sec bins |
 |
 |
| Module-wise count rates for Quadrant D Data is divided into 100 sec bins |
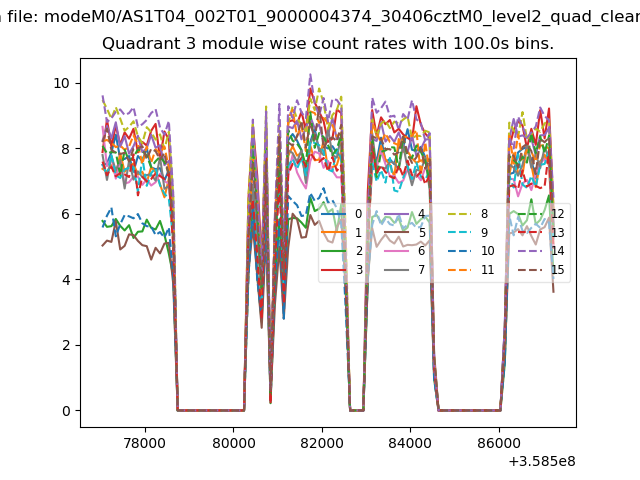 |
 |
| Parameter | Plot |
|---|---|
| CZT HV Monitor | 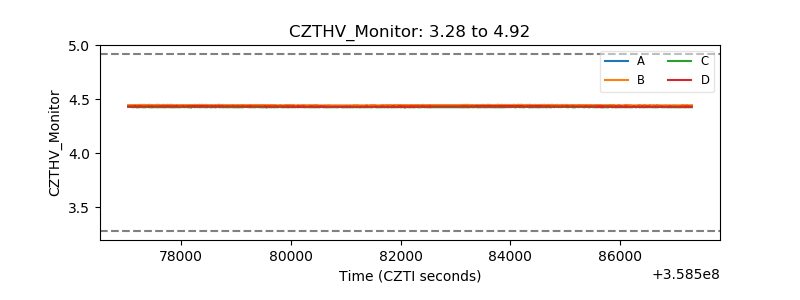 |
| D_VDD | 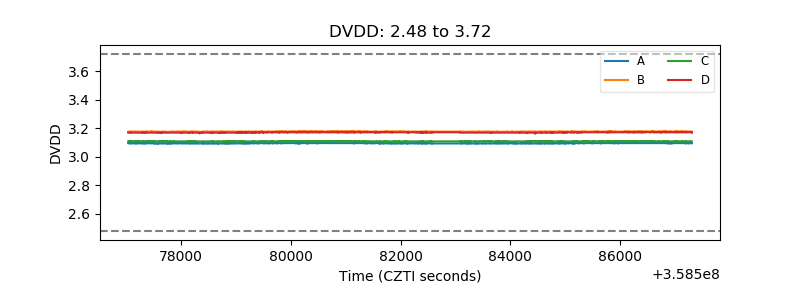 |
| Temperature 1 | 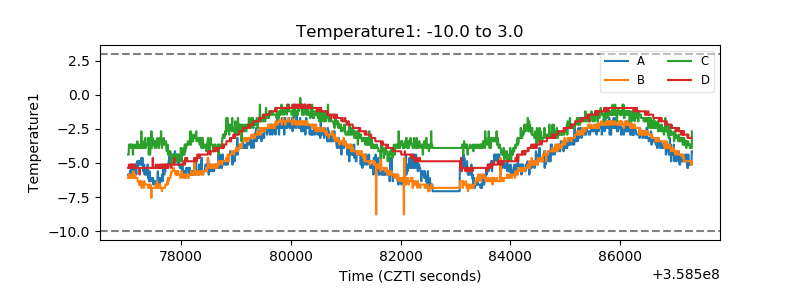 |
| Veto HV Monitor | 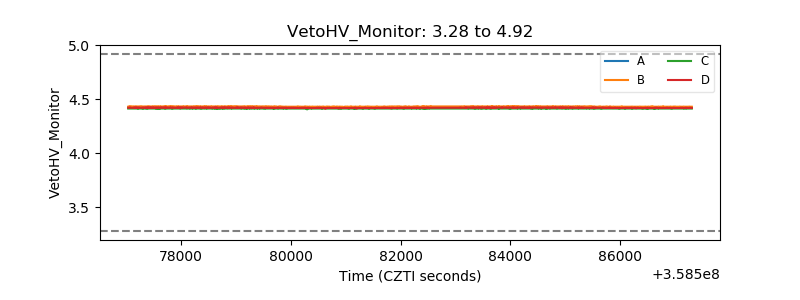 |
| Veto LLD | 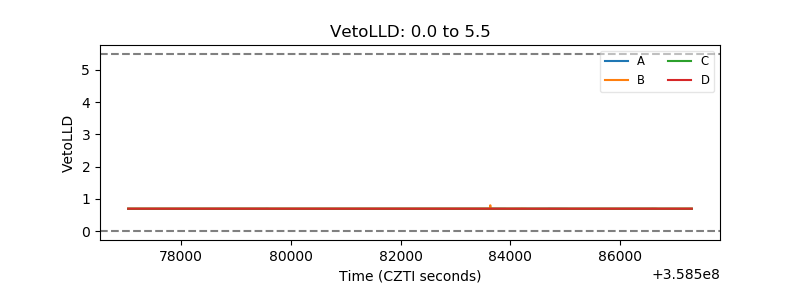 |
| Alpha Counter | 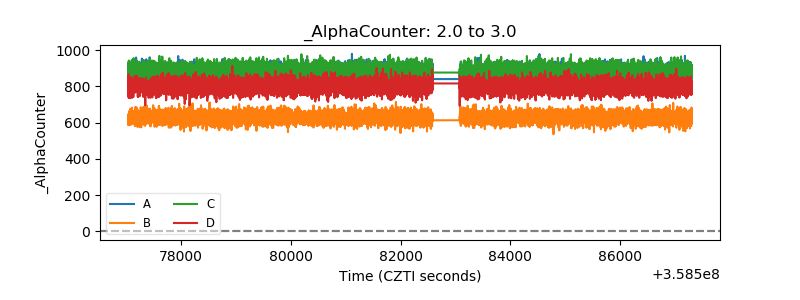 |
| _CPM_Rate | 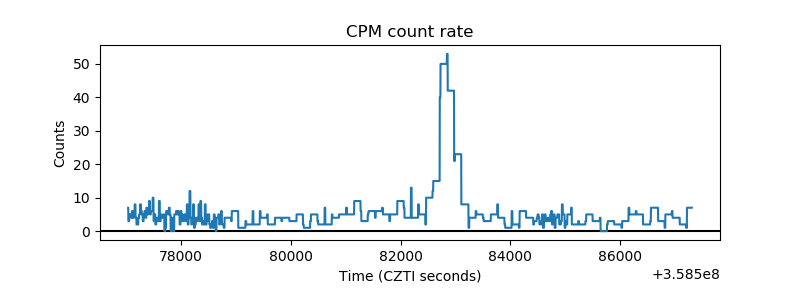 |
| CZT Counter | 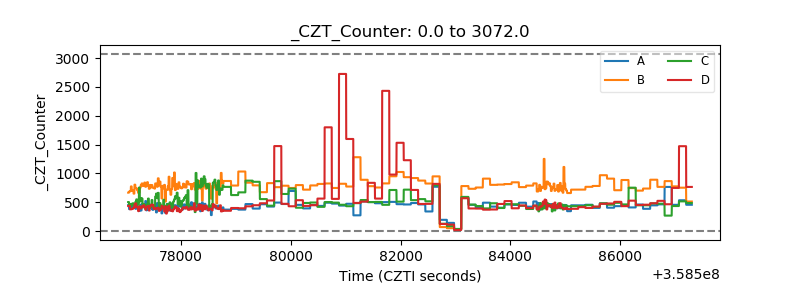 |
| +2.5 Volts monitor |  |
| +5 Volts monitor | 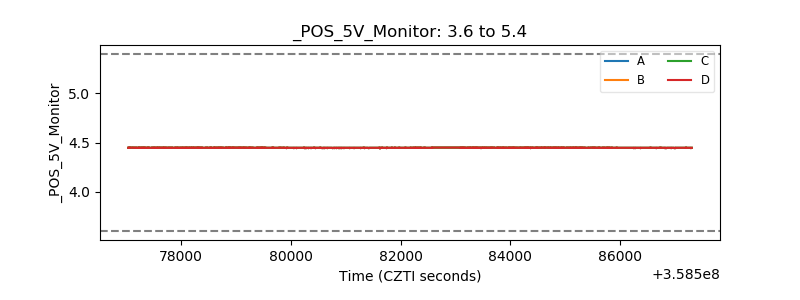 |
| _ROLL_ROT | 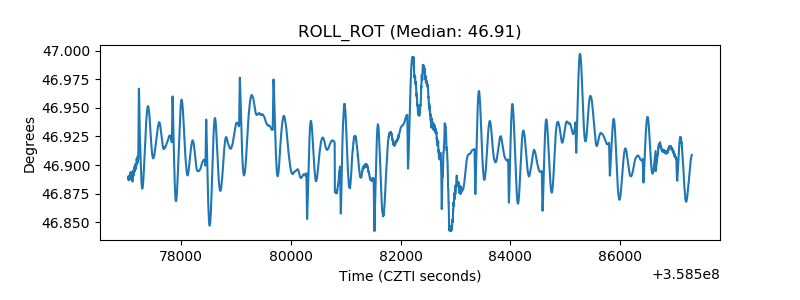 |
| _Roll_DEC | 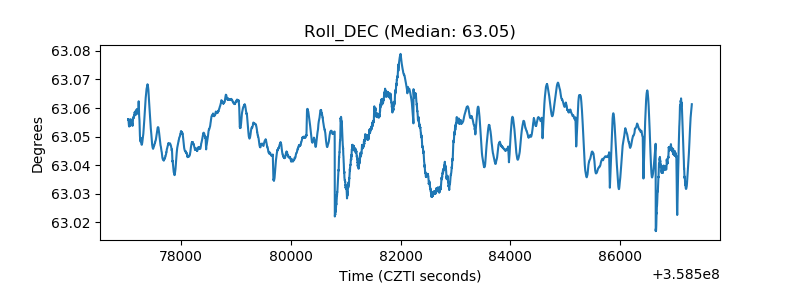 |
| _Roll_RA | 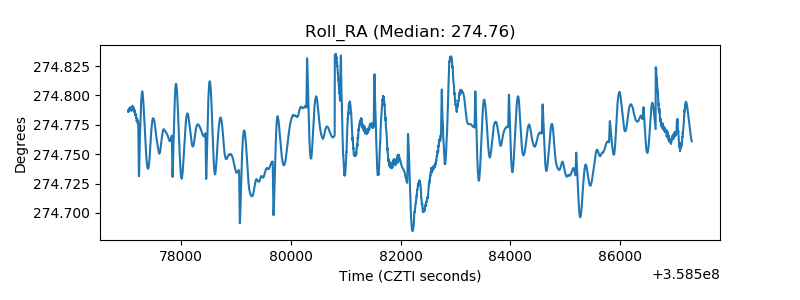 |
| Veto Counter | 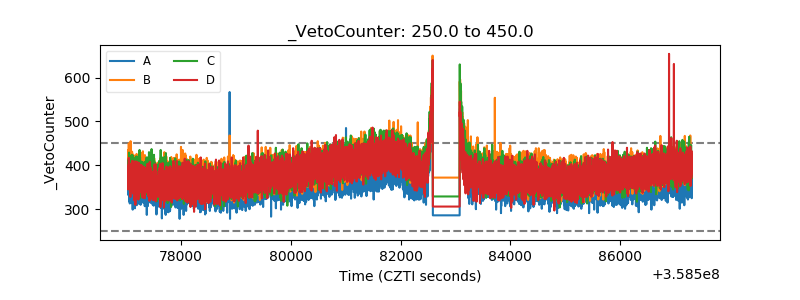 |