| Param | Original file | Final file |
|---|---|---|
| Filename | modeM0/AS1C05_019T04_9000004376cztM0_level2.fits | modeM0/AS1C05_019T04_9000004376cztM0_level2_quad_clean.evt |
| Size (bytes) | 947,629,440 | 1,033,341,120 |
| Size | 903.7 MB | 985.5 MB |
| Events in quadrant A | 5,838,098 | 6,458,943 |
| Events in quadrant B | 5,508,572 | 6,386,217 |
| Events in quadrant C | 5,746,398 | 6,220,044 |
| Events in quadrant D | 4,983,464 | 5,611,013 |
| Mode M9 | |||
|---|---|---|---|
| Quadrant | BADHDUFLAG | Total packets | Discarded packets |
| A | 0 | 157 | 0 |
| B | 0 | 157 | 0 |
| C | 0 | 157 | 0 |
| D | 0 | 157 | 0 |
| Mode SS | |||
|---|---|---|---|
| Quadrant | BADHDUFLAG | Total packets | Discarded packets |
| A | 0 | 1968 | 0 |
| B | 0 | 1968 | 0 |
| C | 0 | 1968 | 0 |
| D | 0 | 1968 | 0 |
| Mode M0 | |||
|---|---|---|---|
| Quadrant | BADHDUFLAG | Total packets | Discarded packets |
| A | 0 | 214063 | 0 |
| B | 0 | 297186 | 0 |
| C | 0 | 209200 | 0 |
| D | 0 | 244385 | 0 |
| Quadrant | Total seconds | Saturated seconds | Saturation percentage |
|---|---|---|---|
| A | 96598 | 1725 | 1.785751% |
| B | 96598 | 1988 | 2.058014% |
| C | 96598 | 2208 | 2.285762% |
| D | 96598 | 4096 | 4.240253% |
Noise dominated data is calculated using 1-second bins in cleaned event files. If a bin has >2000 counts, and if more than 50% of those come from <1% of pixels, then it is considered to be noise-dominated and hence unusable.
| Quadrant | # 1 sec bins | Bins with >0 counts | Bins with >2000 counts | High rate bins dominated by noise | Noise dominated (total time) | Noise dominated (detector-on time) | Marked lightcurve |
|---|---|---|---|---|---|---|---|
| A | 112188 | 96582 | 0 | 0 | 0.00% | 0.00% |  |
| B | 112188 | 96580 | 0 | 0 | 0.00% | 0.00% |  |
| C | 112188 | 96579 | 0 | 0 | 0.00% | 0.00% | 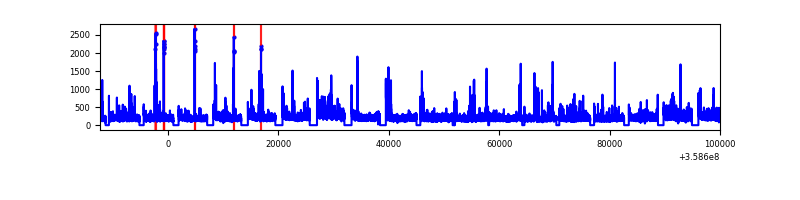 |
| D | 112188 | 96546 | 0 | 0 | 0.00% | 0.00% | 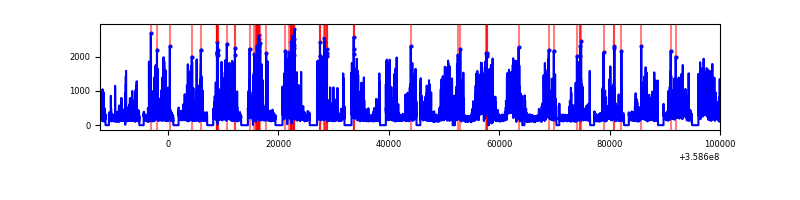 |
Top three noisy pixels from each quadrant. If the there are fewer than three noisy pixels in the level2.evt file, extra rows are filled as -1
| Pixel properties | Quadrant properties | ||||||
|---|---|---|---|---|---|---|---|
| Quadrant | DetID | PixID | Counts | Sigma | Mean | Median | Sigma |
| A | 0 | 29 | 4856 | 9.26 | 1522 | 1435 | 369.3 |
| A | 7 | 110 | 4677 | 8.78 | 1522 | 1435 | 369.3 |
| A | 9 | 19 | 4389 | 8.0 | 1522 | 1435 | 369.3 |
| B | 2 | 9 | 4537 | 11.07 | 1458 | 1395 | 283.8 |
| B | 2 | 8 | 3720 | 8.19 | 1458 | 1395 | 283.8 |
| B | 3 | 80 | 3713 | 8.17 | 1458 | 1395 | 283.8 |
| C | 12 | 241 | 3952 | 6.56 | 1520 | 1430 | 384.6 |
| C | 3 | 187 | 3916 | 6.46 | 1520 | 1430 | 384.6 |
| C | 9 | 209 | 3900 | 6.42 | 1520 | 1430 | 384.6 |
| D | 15 | 46 | 3844 | 6.73 | 1424 | 1300 | 378.2 |
| D | 4 | 246 | 3766 | 6.52 | 1424 | 1300 | 378.2 |
| D | 10 | 189 | 3522 | 5.88 | 1424 | 1300 | 378.2 |
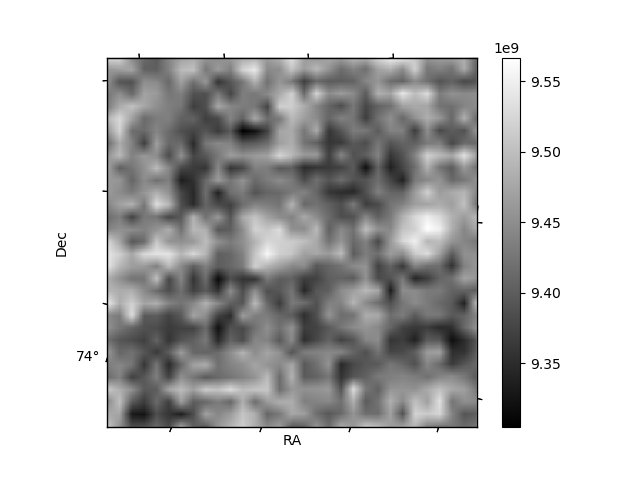
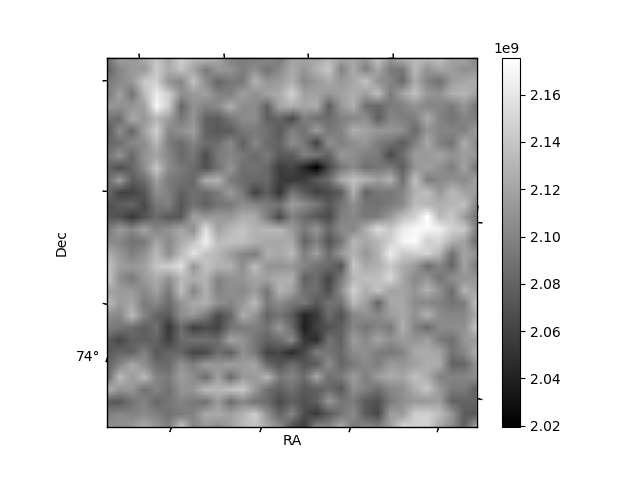
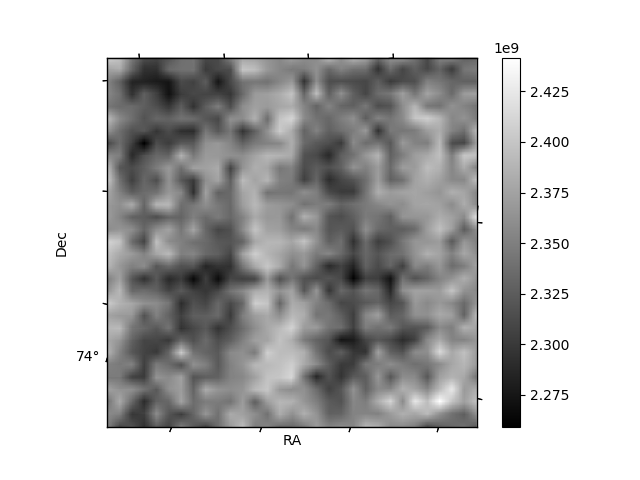
Histogram calculated using DETX and DETY for each event in the final _common_clean file
| Quadrant A | 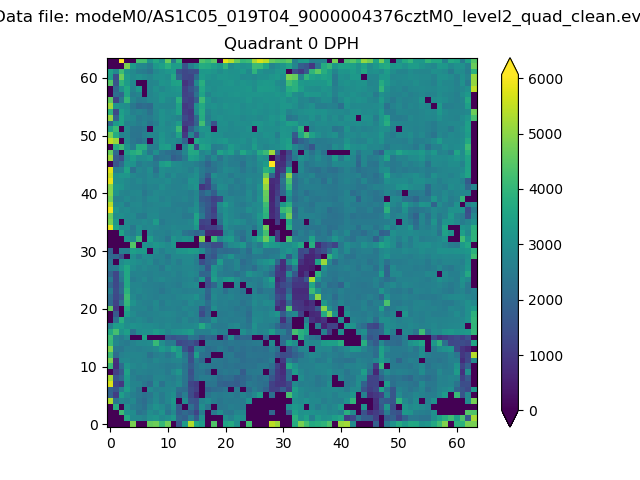 |
 |
Quadrant B |
|---|---|---|---|
| Quadrant D |  |
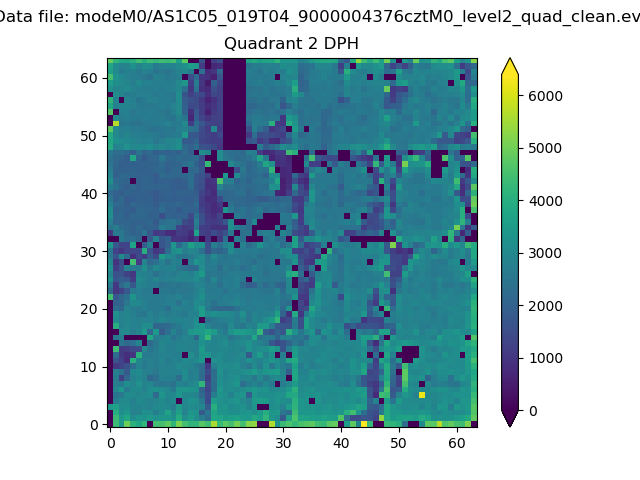 |
Quadrant C |
| Plot type | Count rate plots | Images |
|---|---|---|
| Comparison with Poisson distribution Blue bars denote a histogram of data divided into 1 sec bins. Red curve is a Poisson curve with rate = median count rate of data. |
 |
 |
| Quadrant-wise count rates Data is divided into 100 sec bins |
 |
|
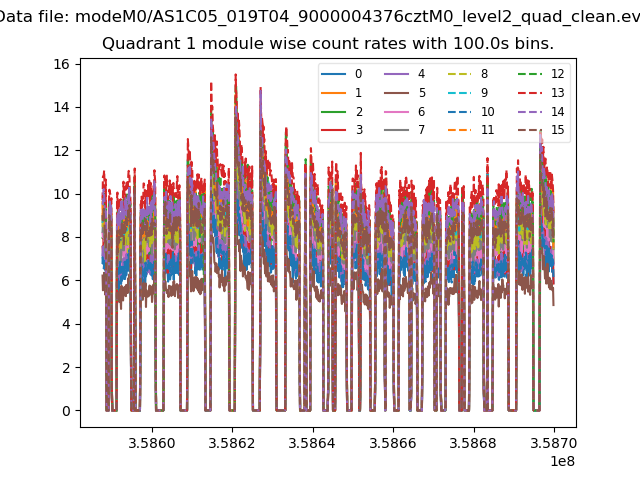
| Module-wise count rates for Quadrant A Data is divided into 100 sec bins |
 |
 |
| Module-wise count rates for Quadrant B Data is divided into 100 sec bins |
 |
 |
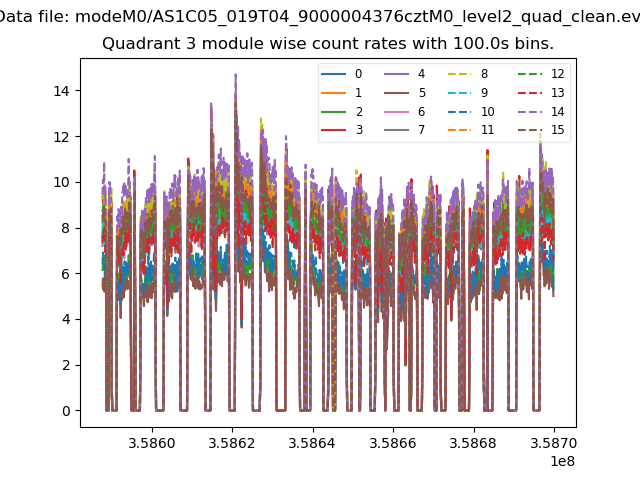
| Module-wise count rates for Quadrant C Data is divided into 100 sec bins |
 |
 |
| Module-wise count rates for Quadrant D Data is divided into 100 sec bins |
 |
 |
| Parameter | Plot |
|---|---|
| CZT HV Monitor | 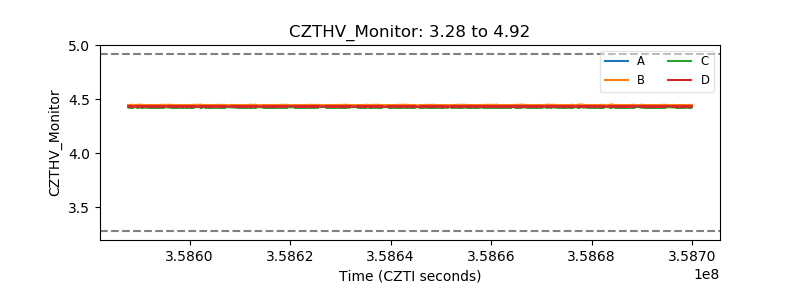 |
| D_VDD | 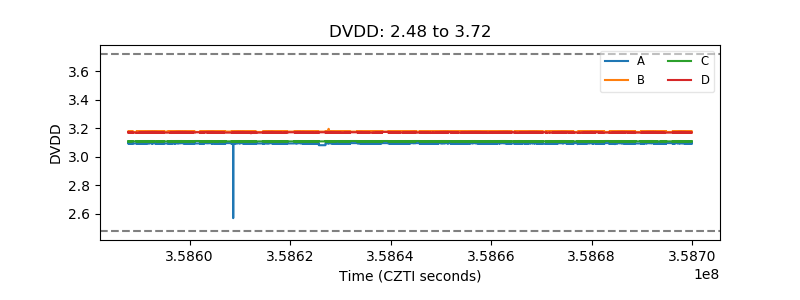 |
| Temperature 1 |  |
| Veto HV Monitor | 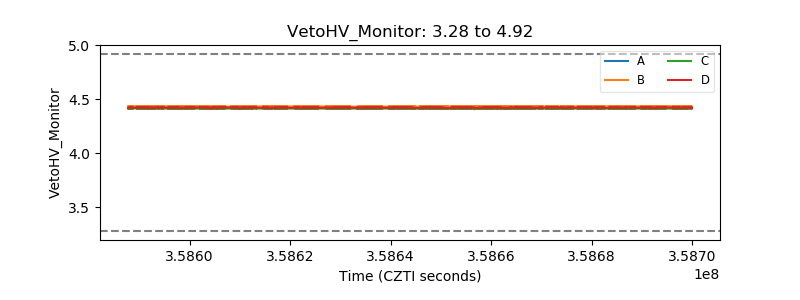 |
| Veto LLD | 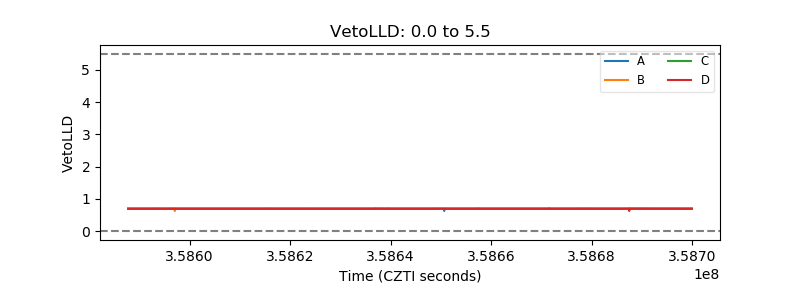 |
| Alpha Counter |  |
| _CPM_Rate |  |
| CZT Counter |  |
| +2.5 Volts monitor |  |
| +5 Volts monitor | 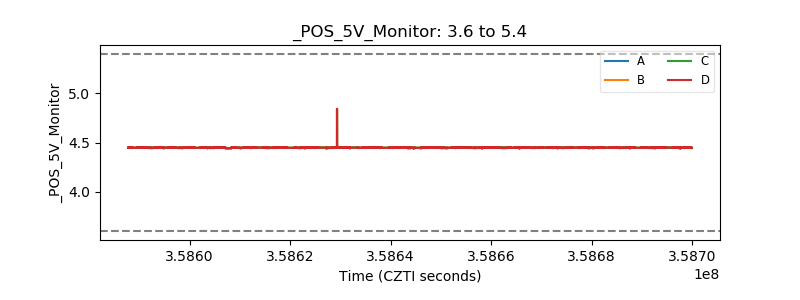 |
| _ROLL_ROT |  |
| _Roll_DEC | 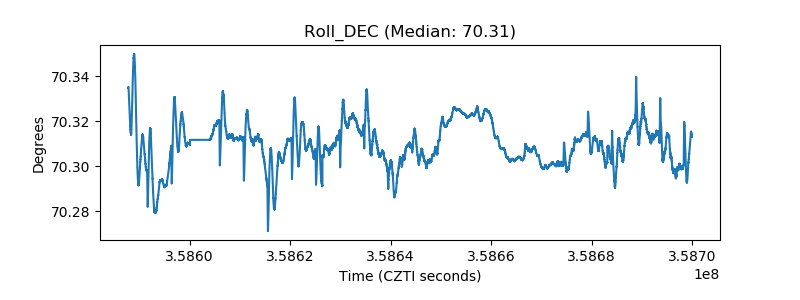 |
| _Roll_RA |  |
| Veto Counter | 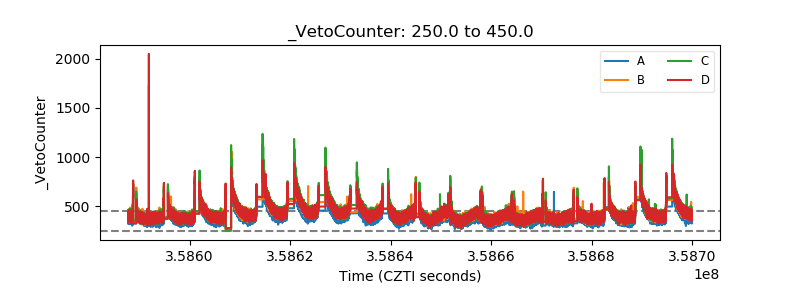 |