| Param | Original file | Final file |
|---|---|---|
| Filename | modeM0/AS1C05_019T04_9000004376_30406cztM0_level2.evt | modeM0/AS1C05_019T04_9000004376_30406cztM0_level2_quad_clean.evt |
| Size (bytes) | 619,735,680 | 109,546,560 |
| Size | 591.0 MB | 104.5 MB |
| Events in quadrant A | 3,802,578 | 704,235 |
| Events in quadrant B | 6,453,866 | 698,629 |
| Events in quadrant C | 3,953,594 | 682,232 |
| Events in quadrant D | 4,013,756 | 673,151 |
| Mode M9 | |||
|---|---|---|---|
| Quadrant | BADHDUFLAG | Total packets | Discarded packets |
| A | 0 | 14 | 0 |
| B | 0 | 14 | 0 |
| C | 0 | 14 | 0 |
| D | 0 | 14 | 0 |
| Mode SS | |||
|---|---|---|---|
| Quadrant | BADHDUFLAG | Total packets | Discarded packets |
| A | 0 | 164 | 0 |
| B | 0 | 164 | 0 |
| C | 0 | 164 | 0 |
| D | 0 | 164 | 0 |
| Mode M0 | |||
|---|---|---|---|
| Quadrant | BADHDUFLAG | Total packets | Discarded packets |
| A | 0 | 16418 | 2 |
| B | 0 | 24784 | 2 |
| C | 0 | 16610 | 2 |
| D | 0 | 17099 | 2 |
| Quadrant | Total seconds | Saturated seconds | Saturation percentage |
|---|---|---|---|
| A | 8047 | 127 | 1.578228% |
| B | 8047 | 197 | 2.448117% |
| C | 8047 | 143 | 1.777060% |
| D | 8047 | 137 | 1.702498% |
Noise dominated data is calculated using 1-second bins in cleaned event files. If a bin has >2000 counts, and if more than 50% of those come from <1% of pixels, then it is considered to be noise-dominated and hence unusable.
| Quadrant | # 1 sec bins | Bins with >0 counts | Bins with >2000 counts | High rate bins dominated by noise | Noise dominated (total time) | Noise dominated (detector-on time) | Marked lightcurve |
|---|---|---|---|---|---|---|---|
| A | 9447 | 8047 | 0 | 0 | 0.00% | 0.00% | 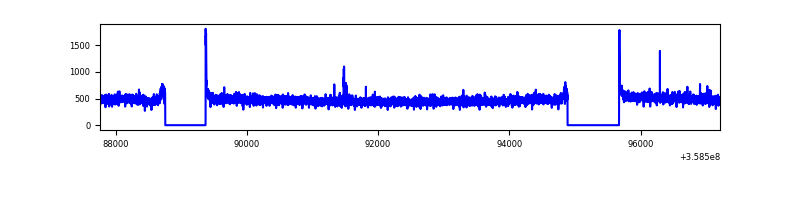 |
| B | 9447 | 8047 | 5 | 5 | 0.05% | 0.06% | 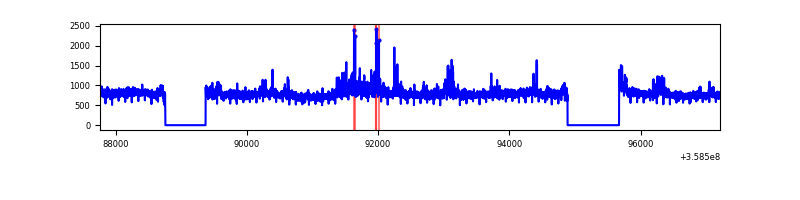 |
| C | 9447 | 8047 | 1 | 1 | 0.01% | 0.01% | 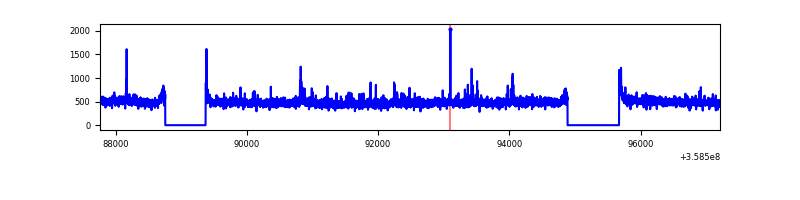 |
| D | 9447 | 8047 | 42 | 42 | 0.44% | 0.52% | 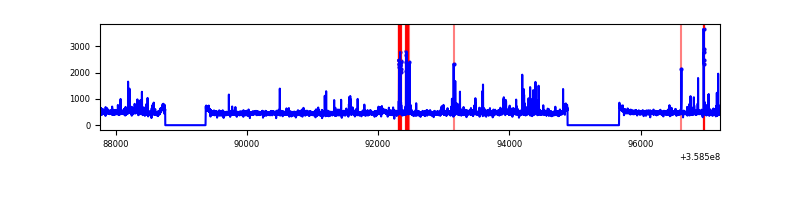 |
Top three noisy pixels from each quadrant. If the there are fewer than three noisy pixels in the level2.evt file, extra rows are filled as -1
| Pixel properties | Quadrant properties | ||||||
|---|---|---|---|---|---|---|---|
| Quadrant | DetID | PixID | Counts | Sigma | Mean | Median | Sigma |
| A | 8 | 192 | 26727 | 131.19 | 975 | 953 | 196.5 |
| A | 13 | 254 | 15327 | 73.16 | 975 | 953 | 196.5 |
| A | 14 | 239 | 11682 | 54.61 | 975 | 953 | 196.5 |
| B | 6 | 159 | 2214576 | 11868.76 | 963 | 937 | 186.5 |
| B | 0 | 229 | 418402 | 2238.3 | 963 | 937 | 186.5 |
| B | 15 | 33 | 25235 | 130.27 | 963 | 937 | 186.5 |
| C | 14 | 238 | 154643 | 708.17 | 931 | 937 | 217.0 |
| C | 3 | 233 | 121329 | 554.68 | 931 | 937 | 217.0 |
| C | 15 | 208 | 24376 | 107.99 | 931 | 937 | 217.0 |
| D | 8 | 195 | 167896 | 690.18 | 930 | 910 | 241.9 |
| D | 13 | 249 | 126142 | 517.6 | 930 | 910 | 241.9 |
| D | 2 | 250 | 101758 | 416.82 | 930 | 910 | 241.9 |
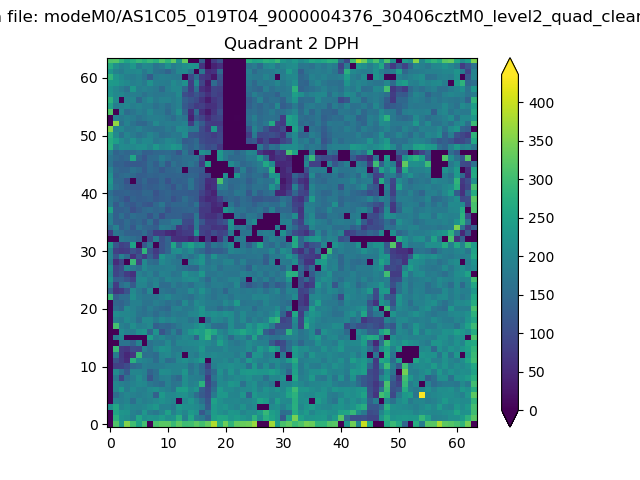
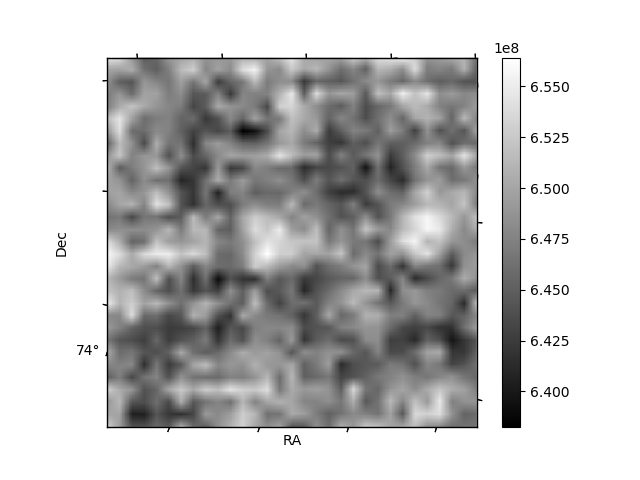
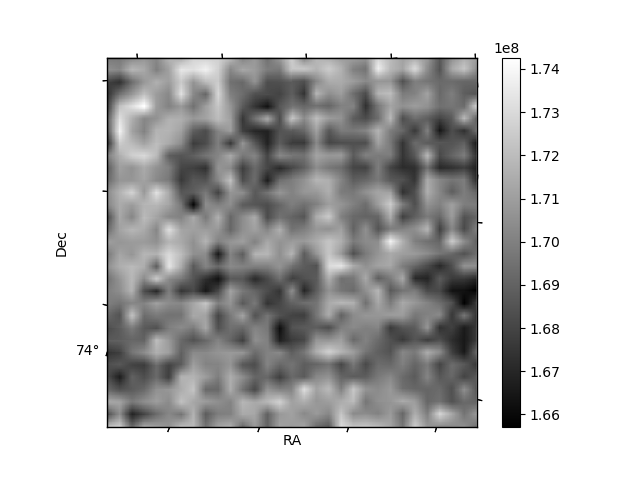
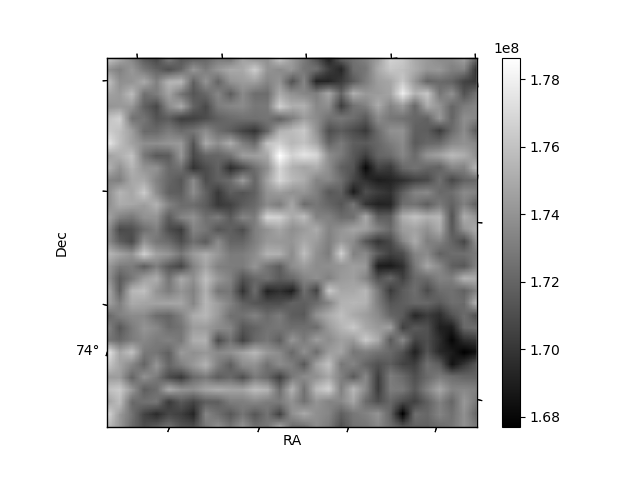
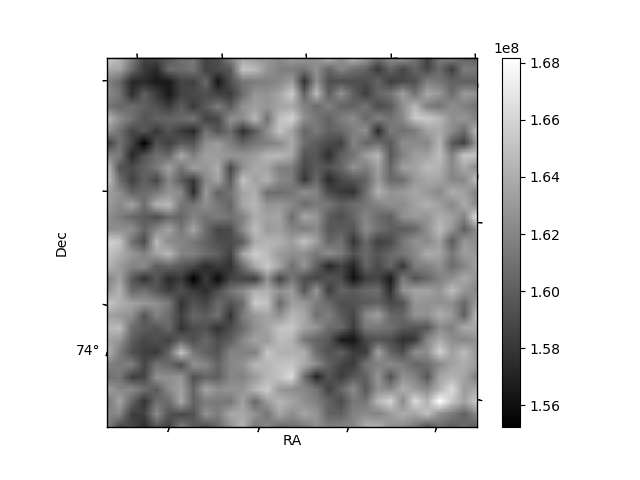
Histogram calculated using DETX and DETY for each event in the final _common_clean file
| Quadrant A | 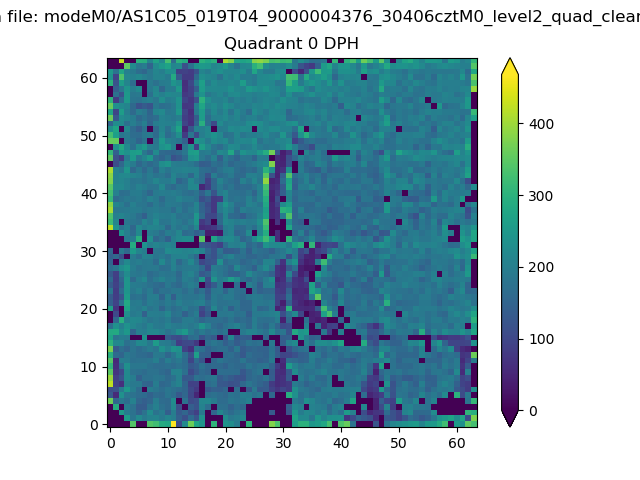 |
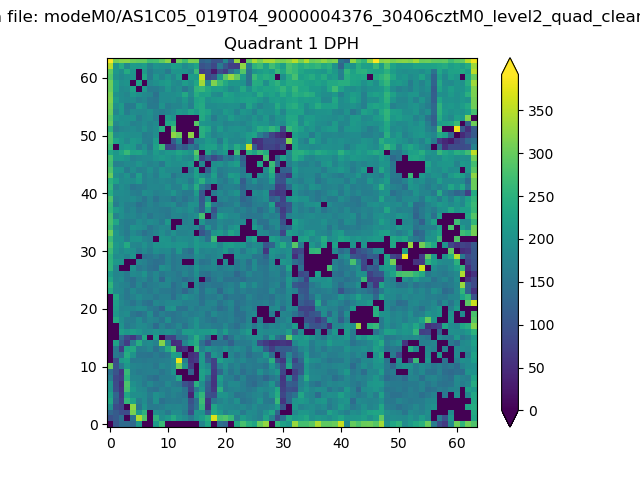 |
Quadrant B |
|---|---|---|---|
| Quadrant D | 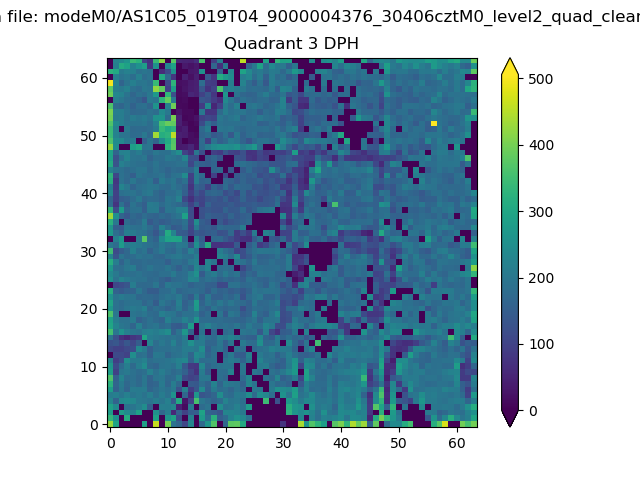 |
 |
Quadrant C |
| Plot type | Count rate plots | Images |
|---|---|---|
| Comparison with Poisson distribution Blue bars denote a histogram of data divided into 1 sec bins. Red curve is a Poisson curve with rate = median count rate of data. |
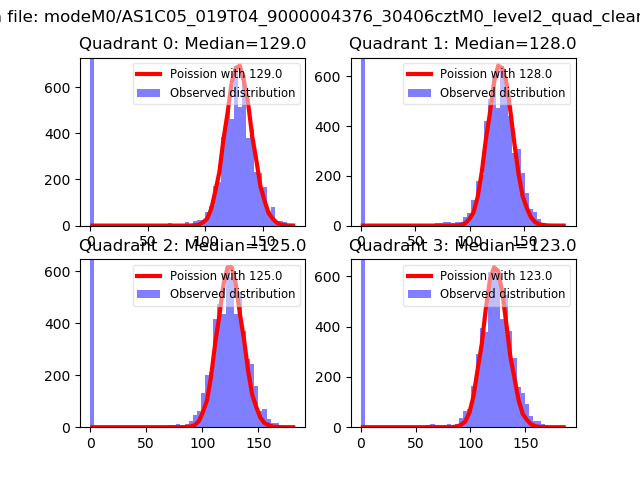 |
 |
| Quadrant-wise count rates Data is divided into 100 sec bins |
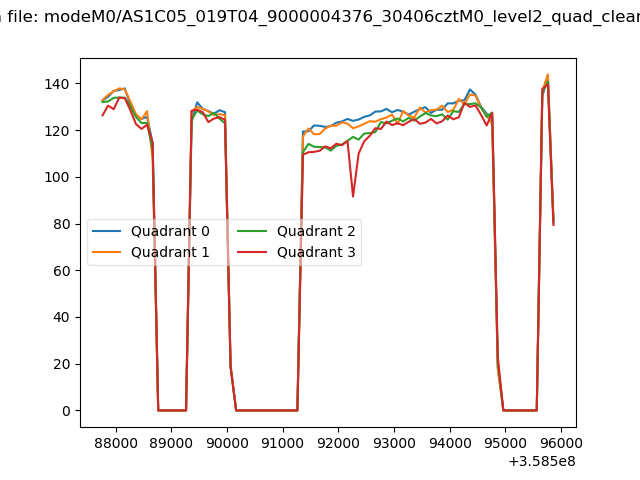 |
|
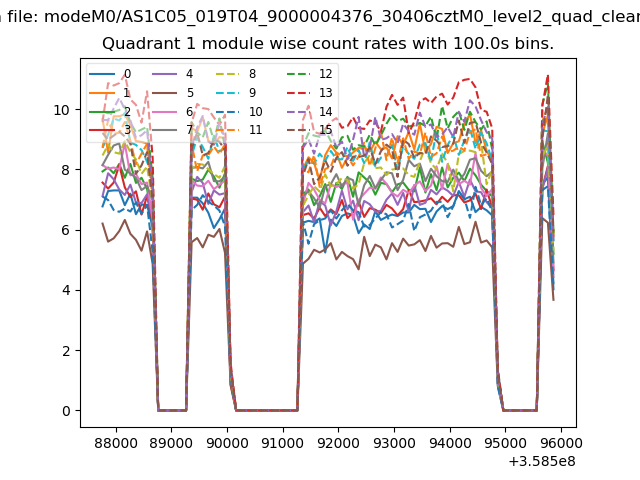
| Module-wise count rates for Quadrant A Data is divided into 100 sec bins |
 |
 |
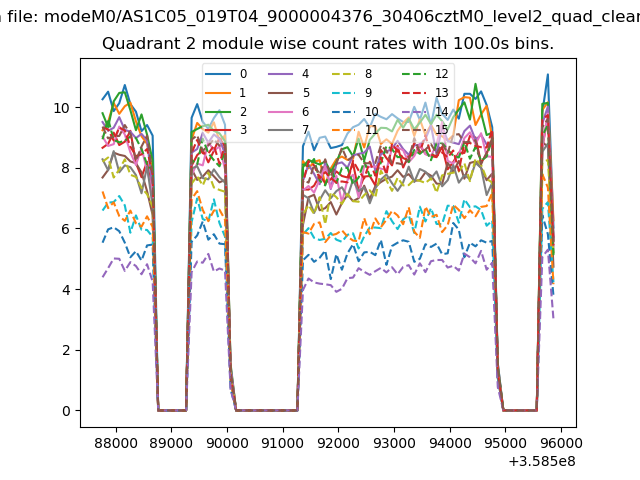
| Module-wise count rates for Quadrant B Data is divided into 100 sec bins |
 |
 |
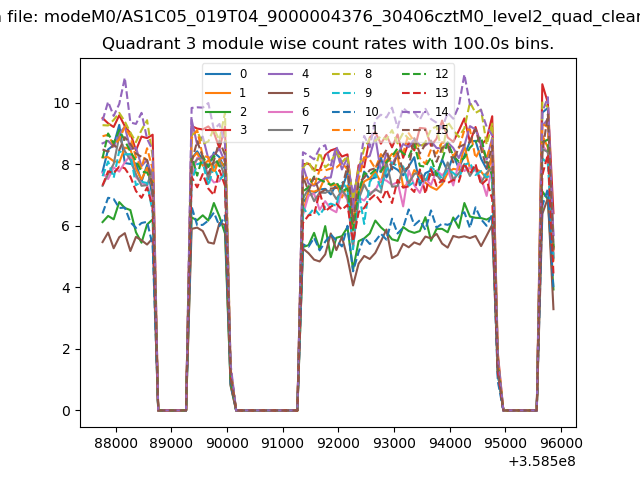
| Module-wise count rates for Quadrant C Data is divided into 100 sec bins |
 |
 |
| Module-wise count rates for Quadrant D Data is divided into 100 sec bins |
 |
 |
| Parameter | Plot |
|---|---|
| CZT HV Monitor |  |
| D_VDD |  |
| Temperature 1 | 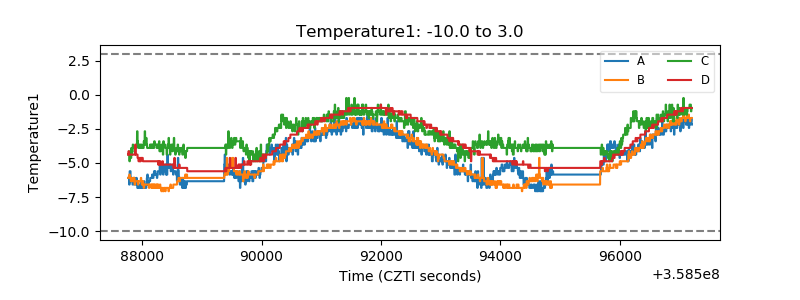 |
| Veto HV Monitor | 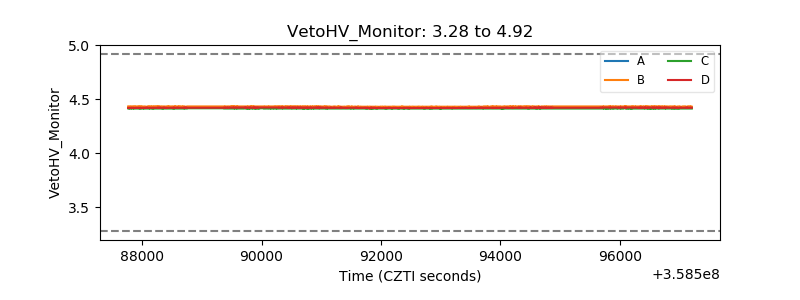 |
| Veto LLD | 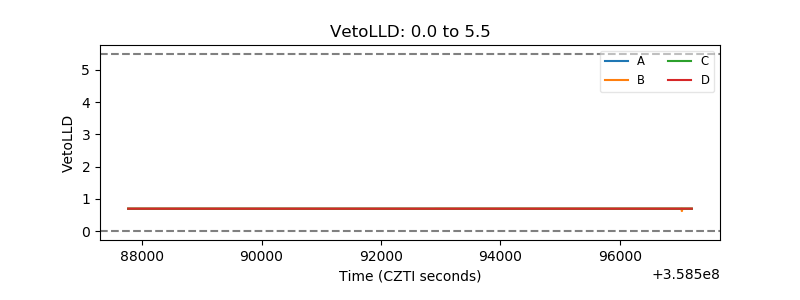 |
| Alpha Counter | 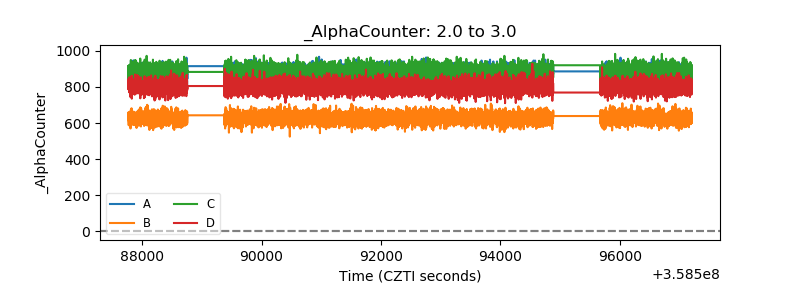 |
| _CPM_Rate | 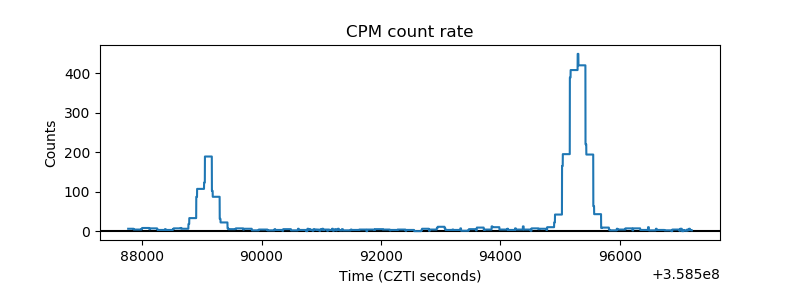 |
| CZT Counter | 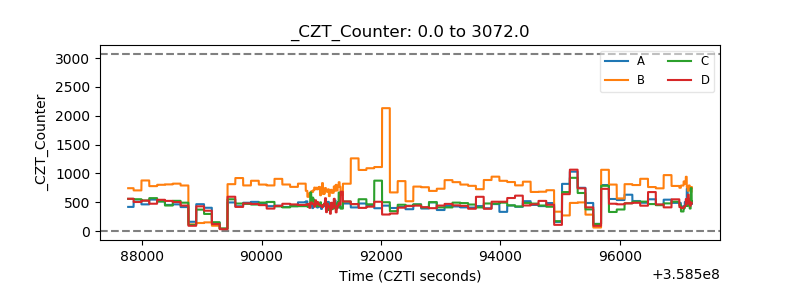 |
| +2.5 Volts monitor | 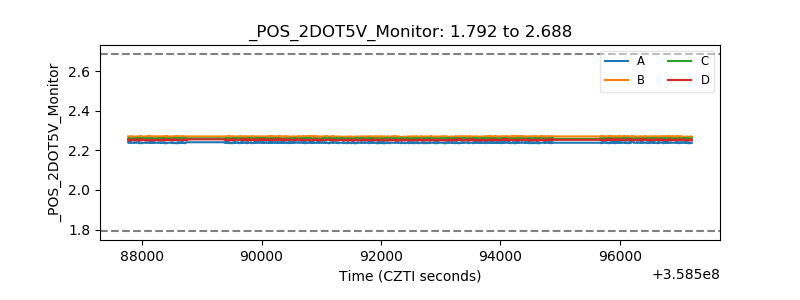 |
| +5 Volts monitor |  |
| _ROLL_ROT | 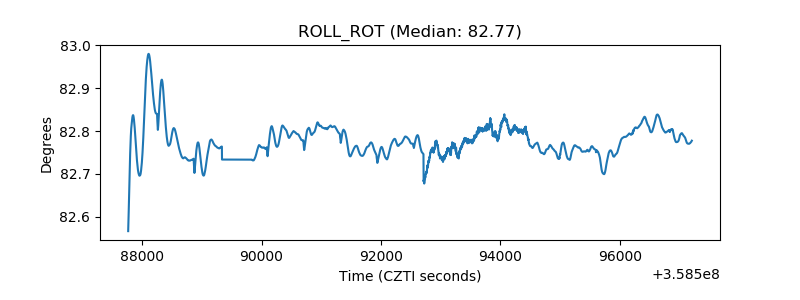 |
| _Roll_DEC | 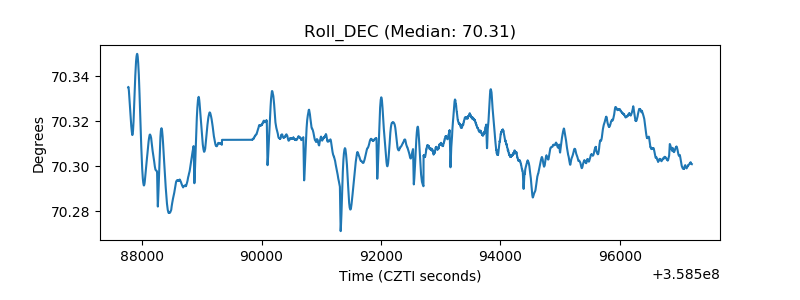 |
| _Roll_RA | 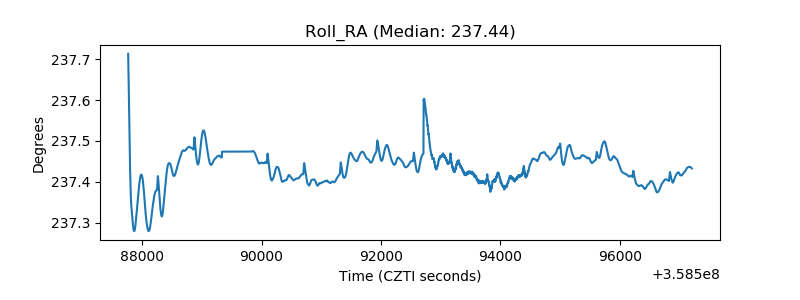 |
| Veto Counter | 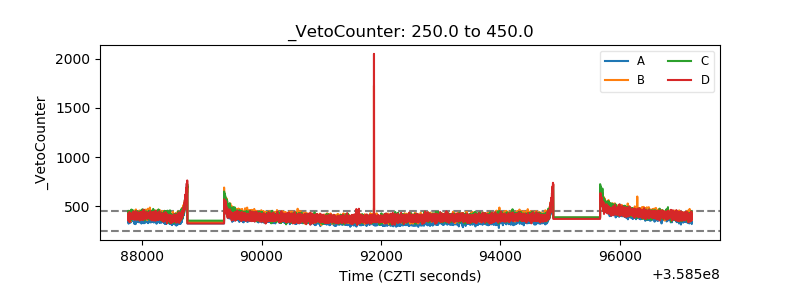 |