| Param | Original file | Final file |
|---|---|---|
| Filename | modeM0/AS1C05_019T04_9000004376_30407cztM0_level2.evt | modeM0/AS1C05_019T04_9000004376_30407cztM0_level2_quad_clean.evt |
| Size (bytes) | 539,513,280 | 88,312,320 |
| Size | 514.5 MB | 84.2 MB |
| Events in quadrant A | 3,569,933 | 562,335 |
| Events in quadrant B | 5,305,307 | 561,736 |
| Events in quadrant C | 3,414,194 | 541,229 |
| Events in quadrant D | 3,590,711 | 536,980 |
| Mode M9 | |||
|---|---|---|---|
| Quadrant | BADHDUFLAG | Total packets | Discarded packets |
| A | 0 | 10 | 0 |
| B | 0 | 10 | 0 |
| C | 0 | 10 | 0 |
| D | 0 | 10 | 0 |
| Mode SS | |||
|---|---|---|---|
| Quadrant | BADHDUFLAG | Total packets | Discarded packets |
| A | 0 | 136 | 0 |
| B | 0 | 136 | 0 |
| C | 0 | 136 | 0 |
| D | 0 | 136 | 0 |
| Mode M0 | |||
|---|---|---|---|
| Quadrant | BADHDUFLAG | Total packets | Discarded packets |
| A | 0 | 14962 | 1 |
| B | 0 | 20668 | 1 |
| C | 0 | 14289 | 1 |
| D | 0 | 14854 | 2 |
| Quadrant | Total seconds | Saturated seconds | Saturation percentage |
|---|---|---|---|
| A | 6777 | 163 | 2.405194% |
| B | 6778 | 117 | 1.726173% |
| C | 6778 | 122 | 1.799941% |
| D | 6777 | 101 | 1.490335% |
Noise dominated data is calculated using 1-second bins in cleaned event files. If a bin has >2000 counts, and if more than 50% of those come from <1% of pixels, then it is considered to be noise-dominated and hence unusable.
| Quadrant | # 1 sec bins | Bins with >0 counts | Bins with >2000 counts | High rate bins dominated by noise | Noise dominated (total time) | Noise dominated (detector-on time) | Marked lightcurve |
|---|---|---|---|---|---|---|---|
| A | 7726 | 6776 | 75 | 75 | 0.97% | 1.11% | 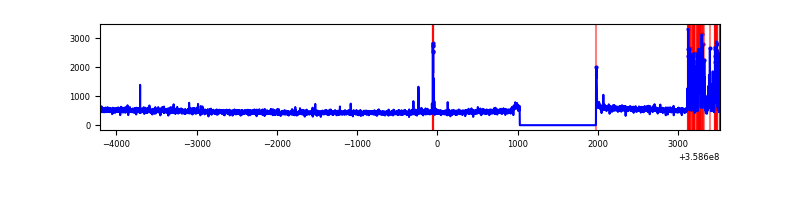 |
| B | 7728 | 6778 | 12 | 12 | 0.16% | 0.18% | 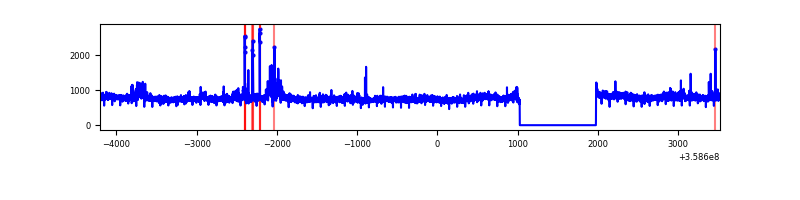 |
| C | 7728 | 6778 | 31 | 31 | 0.40% | 0.46% | 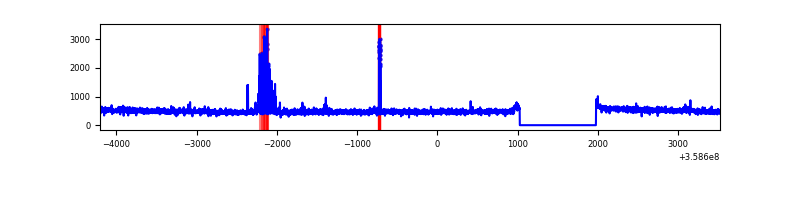 |
| D | 7727 | 6777 | 53 | 53 | 0.69% | 0.78% |  |
Top three noisy pixels from each quadrant. If the there are fewer than three noisy pixels in the level2.evt file, extra rows are filled as -1
| Pixel properties | Quadrant properties | ||||||
|---|---|---|---|---|---|---|---|
| Quadrant | DetID | PixID | Counts | Sigma | Mean | Median | Sigma |
| A | 14 | 239 | 338939 | 2043.04 | 830 | 815 | 165.5 |
| A | 13 | 254 | 14240 | 81.12 | 830 | 815 | 165.5 |
| A | 8 | 192 | 13346 | 75.72 | 830 | 815 | 165.5 |
| B | 6 | 159 | 1863019 | 11919.75 | 820 | 799 | 156.2 |
| B | 0 | 229 | 158498 | 1009.4 | 820 | 799 | 156.2 |
| B | 15 | 33 | 25055 | 155.26 | 820 | 799 | 156.2 |
| C | 15 | 208 | 166353 | 906.37 | 789 | 793 | 182.7 |
| C | 14 | 238 | 128263 | 697.84 | 789 | 793 | 182.7 |
| C | 3 | 233 | 28656 | 152.54 | 789 | 793 | 182.7 |
| D | 13 | 249 | 178954 | 859.8 | 796 | 781 | 207.2 |
| D | 8 | 195 | 160014 | 768.41 | 796 | 781 | 207.2 |
| D | 2 | 250 | 126526 | 606.8 | 796 | 781 | 207.2 |
Histogram calculated using DETX and DETY for each event in the final _common_clean file
| Quadrant A |  |
 |
Quadrant B |
|---|---|---|---|
| Quadrant D | 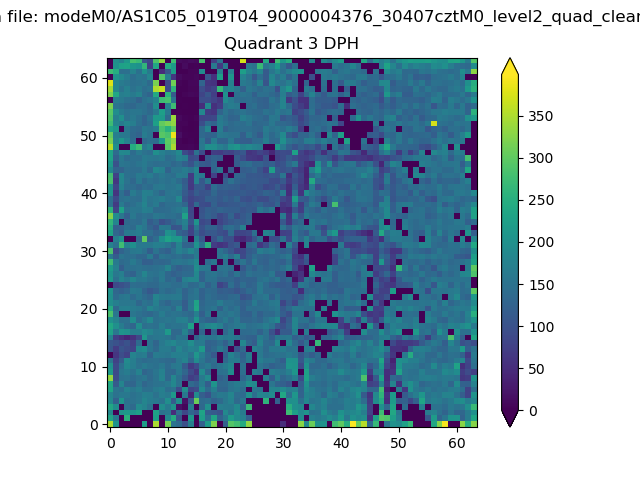 |
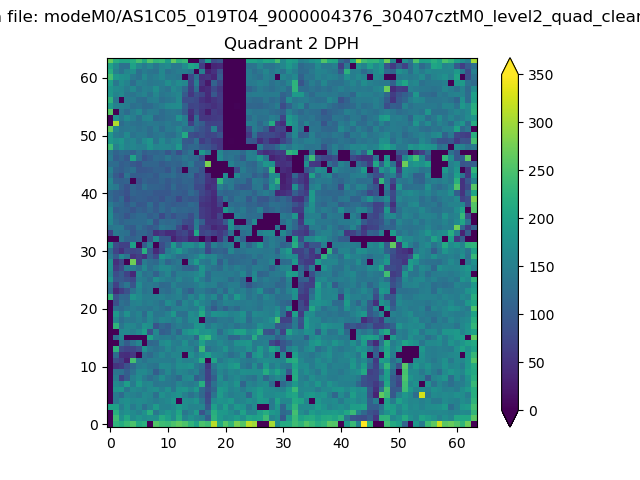 |
Quadrant C |
| Plot type | Count rate plots | Images |
|---|---|---|
| Comparison with Poisson distribution Blue bars denote a histogram of data divided into 1 sec bins. Red curve is a Poisson curve with rate = median count rate of data. |
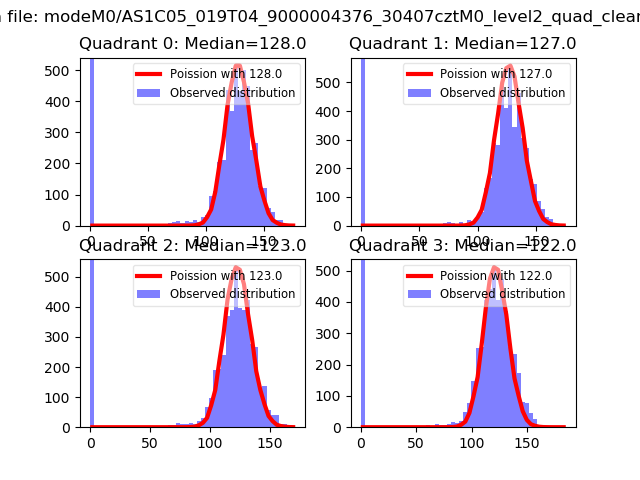 |
 |
| Quadrant-wise count rates Data is divided into 100 sec bins |
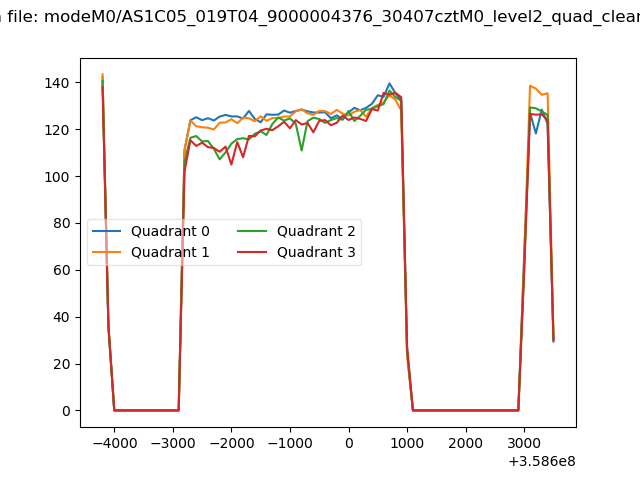 |
|
| Module-wise count rates for Quadrant A Data is divided into 100 sec bins |
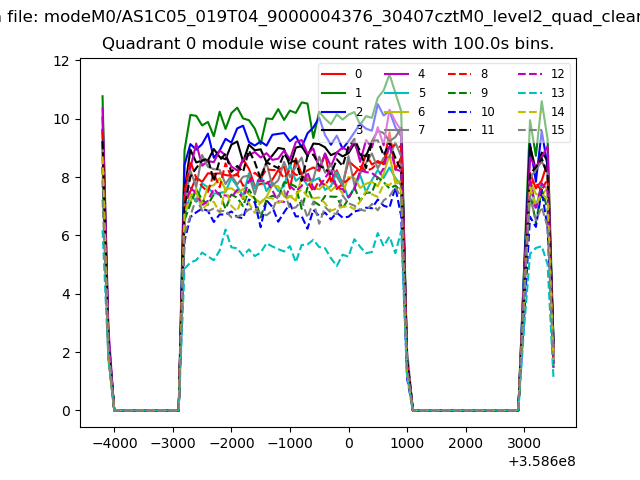 |
 |
| Module-wise count rates for Quadrant B Data is divided into 100 sec bins |
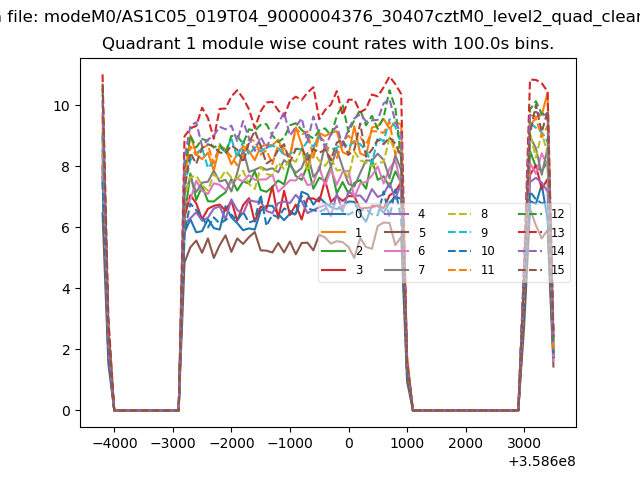 |
 |
| Module-wise count rates for Quadrant C Data is divided into 100 sec bins |
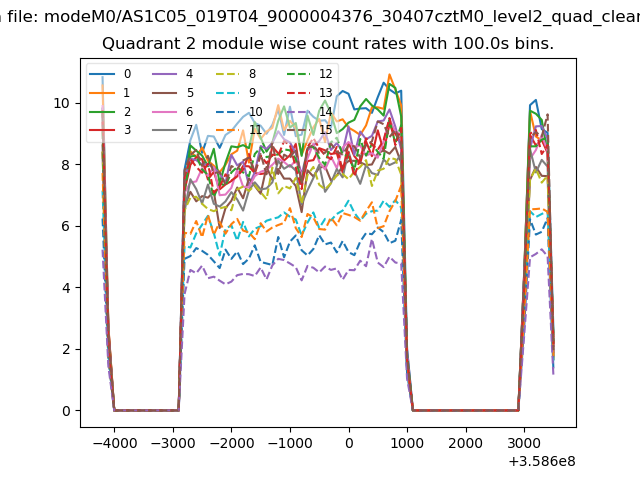 |
 |
| Module-wise count rates for Quadrant D Data is divided into 100 sec bins |
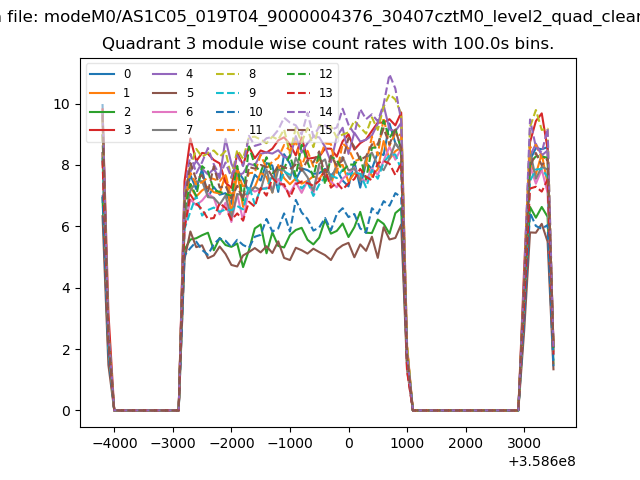 |
 |
| Parameter | Plot |
|---|---|
| CZT HV Monitor | 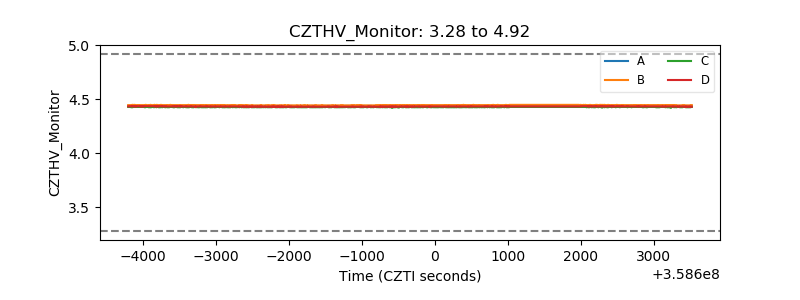 |
| D_VDD | 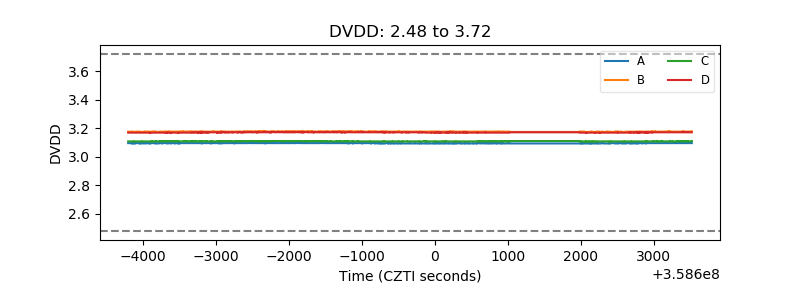 |
| Temperature 1 | 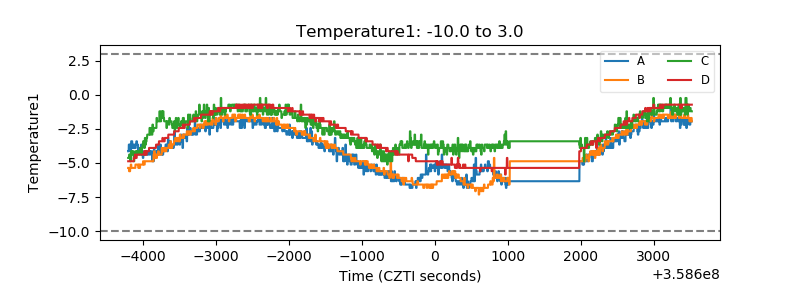 |
| Veto HV Monitor | 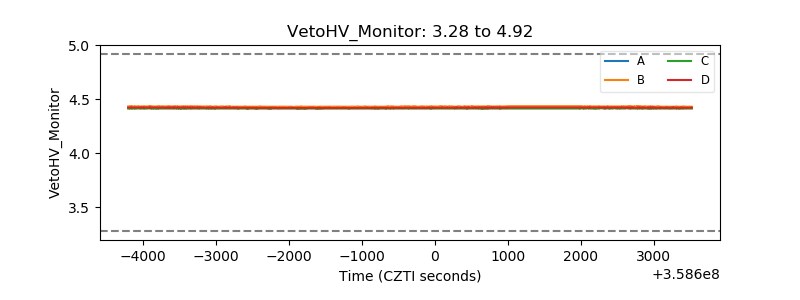 |
| Veto LLD | 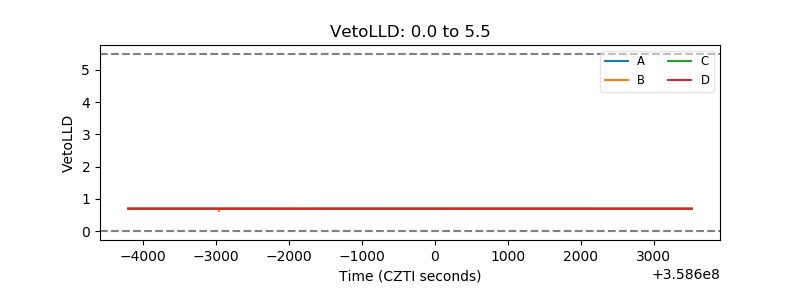 |
| Alpha Counter | 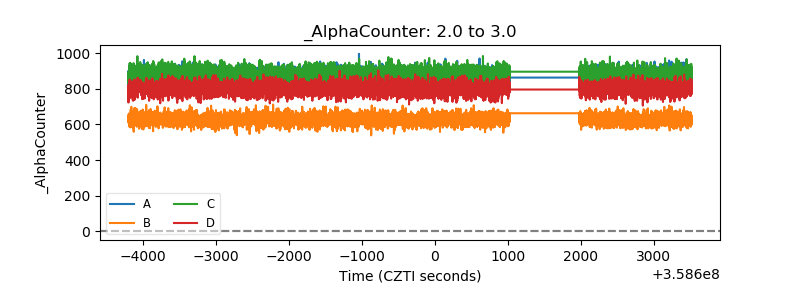 |
| _CPM_Rate | 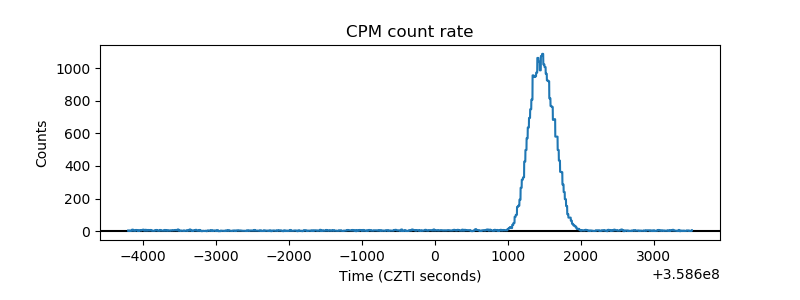 |
| CZT Counter | 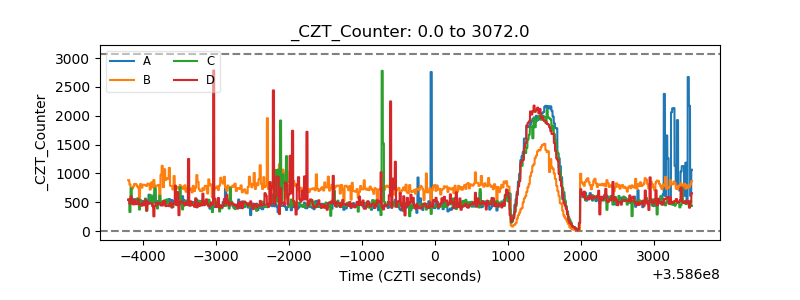 |
| +2.5 Volts monitor |  |
| +5 Volts monitor | 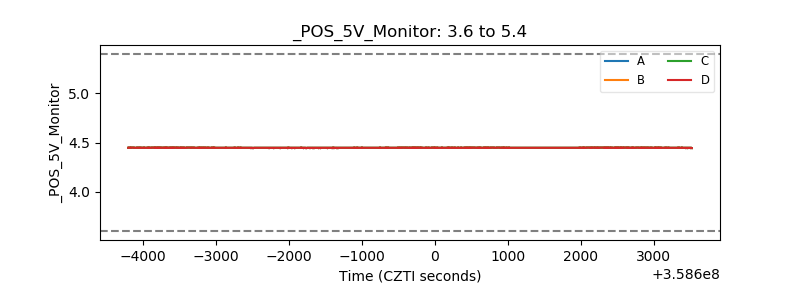 |
| _ROLL_ROT | 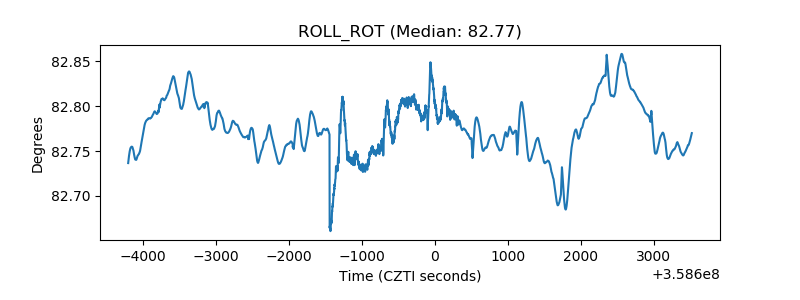 |
| _Roll_DEC | 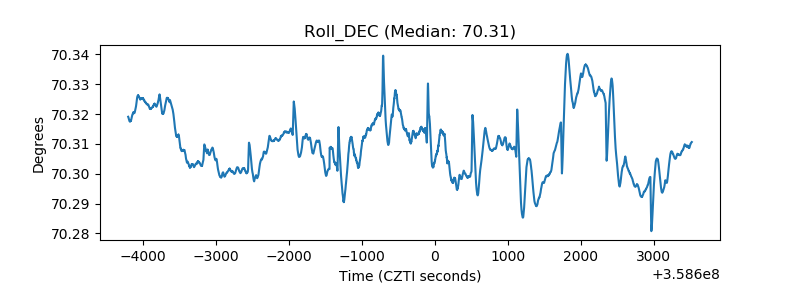 |
| _Roll_RA | 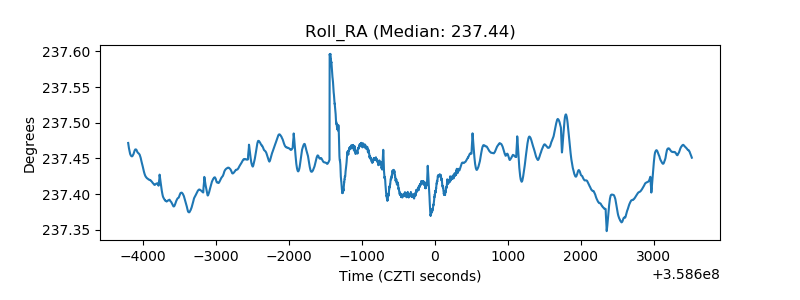 |
| Veto Counter | 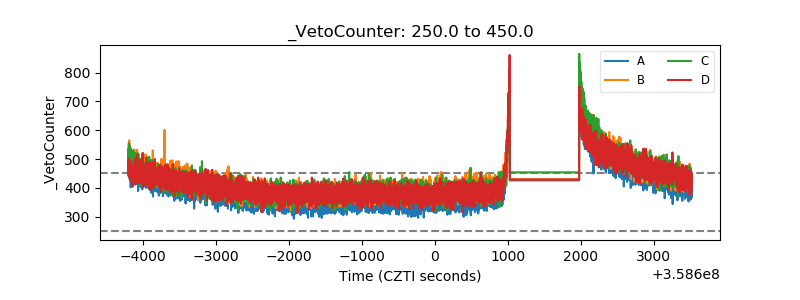 |