| Param | Original file | Final file |
|---|---|---|
| Filename | modeM0/AS1C05_019T04_9000004376_30411cztM0_level2.evt | modeM0/AS1C05_019T04_9000004376_30411cztM0_level2_quad_clean.evt |
| Size (bytes) | 542,332,800 | 126,192,960 |
| Size | 517.2 MB | 120.3 MB |
| Events in quadrant A | 3,432,632 | 865,710 |
| Events in quadrant B | 4,888,976 | 875,302 |
| Events in quadrant C | 3,223,541 | 860,875 |
| Events in quadrant D | 4,482,274 | 810,462 |
| Mode M9 | |||
|---|---|---|---|
| Quadrant | BADHDUFLAG | Total packets | Discarded packets |
| A | 0 | 13 | 0 |
| B | 0 | 13 | 0 |
| C | 0 | 13 | 0 |
| D | 0 | 13 | 0 |
| Mode SS | |||
|---|---|---|---|
| Quadrant | BADHDUFLAG | Total packets | Discarded packets |
| A | 0 | 120 | 0 |
| B | 0 | 120 | 0 |
| C | 0 | 120 | 0 |
| D | 0 | 120 | 0 |
| Mode M0 | |||
|---|---|---|---|
| Quadrant | BADHDUFLAG | Total packets | Discarded packets |
| A | 0 | 14032 | 1 |
| B | 0 | 18439 | 1 |
| C | 0 | 13473 | 1 |
| D | 0 | 17371 | 1 |
| Quadrant | Total seconds | Saturated seconds | Saturation percentage |
|---|---|---|---|
| A | 5861 | 142 | 2.422795% |
| B | 5861 | 114 | 1.945061% |
| C | 5861 | 123 | 2.098618% |
| D | 5862 | 487 | 8.307745% |
Noise dominated data is calculated using 1-second bins in cleaned event files. If a bin has >2000 counts, and if more than 50% of those come from <1% of pixels, then it is considered to be noise-dominated and hence unusable.
| Quadrant | # 1 sec bins | Bins with >0 counts | Bins with >2000 counts | High rate bins dominated by noise | Noise dominated (total time) | Noise dominated (detector-on time) | Marked lightcurve |
|---|---|---|---|---|---|---|---|
| A | 7151 | 5861 | 47 | 47 | 0.66% | 0.80% | 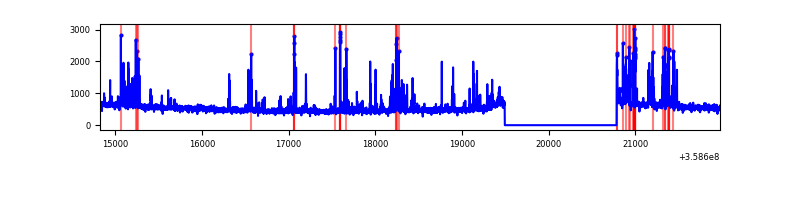 |
| B | 7151 | 5861 | 0 | 0 | 0.00% | 0.00% | 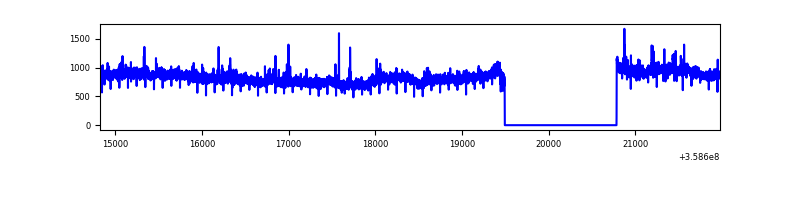 |
| C | 7151 | 5861 | 7 | 7 | 0.10% | 0.12% | 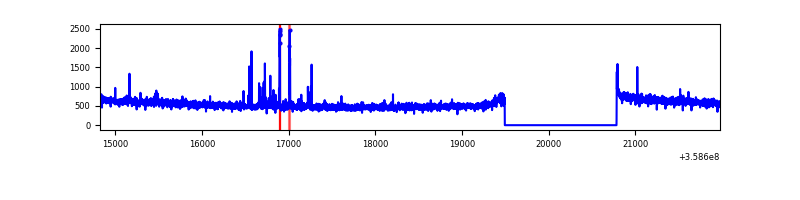 |
| D | 7151 | 5861 | 357 | 357 | 4.99% | 6.09% | 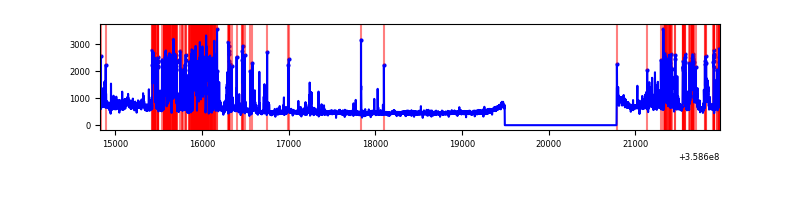 |
Top three noisy pixels from each quadrant. If the there are fewer than three noisy pixels in the level2.evt file, extra rows are filled as -1
| Pixel properties | Quadrant properties | ||||||
|---|---|---|---|---|---|---|---|
| Quadrant | DetID | PixID | Counts | Sigma | Mean | Median | Sigma |
| A | 0 | 13 | 437580 | 2878.05 | 770 | 756 | 151.8 |
| A | 8 | 192 | 13954 | 86.96 | 770 | 756 | 151.8 |
| A | 13 | 254 | 11550 | 71.12 | 770 | 756 | 151.8 |
| B | 6 | 159 | 1724925 | 12209.5 | 766 | 748 | 141.2 |
| B | 0 | 229 | 139047 | 979.34 | 766 | 748 | 141.2 |
| B | 12 | 111 | 16376 | 110.66 | 766 | 748 | 141.2 |
| C | 14 | 238 | 124712 | 708.94 | 761 | 767 | 174.8 |
| C | 15 | 208 | 52530 | 296.07 | 761 | 767 | 174.8 |
| C | 3 | 233 | 35181 | 196.84 | 761 | 767 | 174.8 |
| D | 13 | 249 | 1119867 | 6388.18 | 740 | 720 | 175.2 |
| D | 8 | 195 | 212961 | 1211.49 | 740 | 720 | 175.2 |
| D | 2 | 250 | 127351 | 722.82 | 740 | 720 | 175.2 |
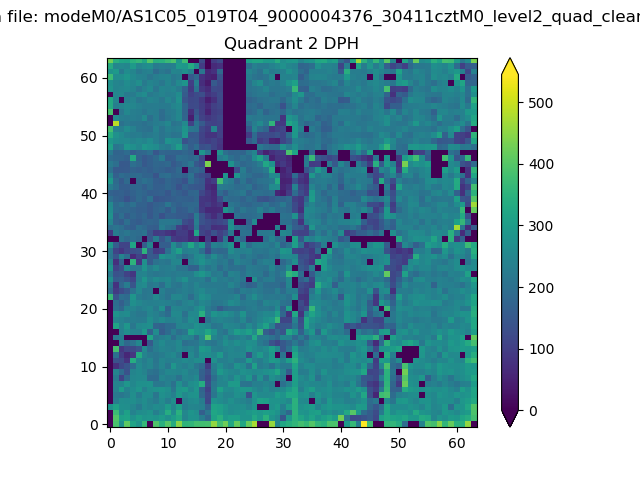
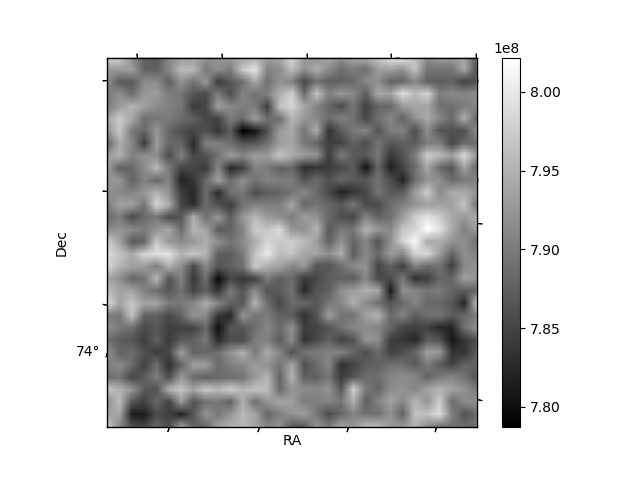
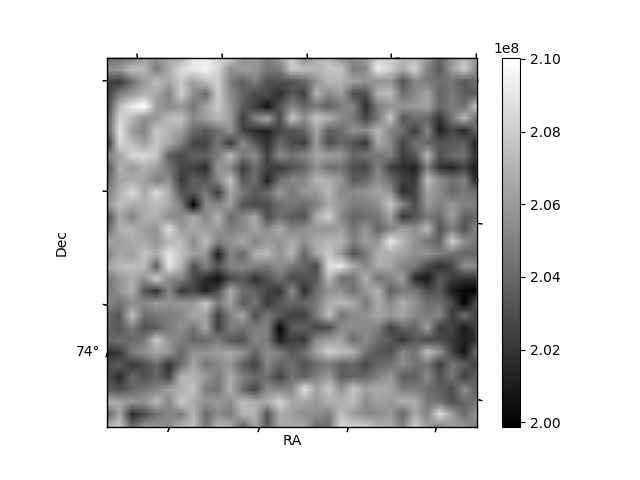
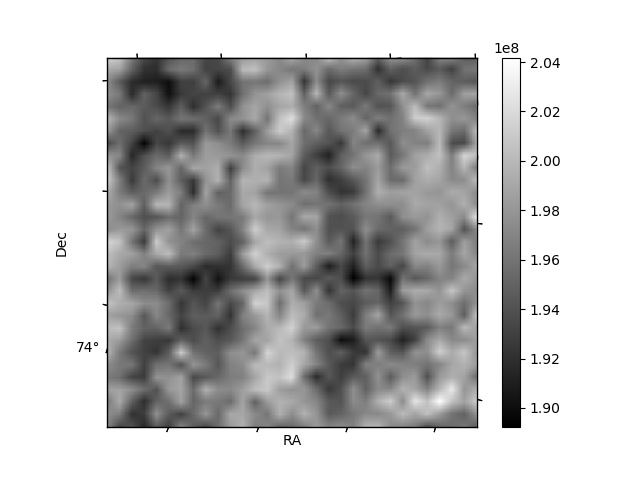
Histogram calculated using DETX and DETY for each event in the final _common_clean file
| Quadrant A | 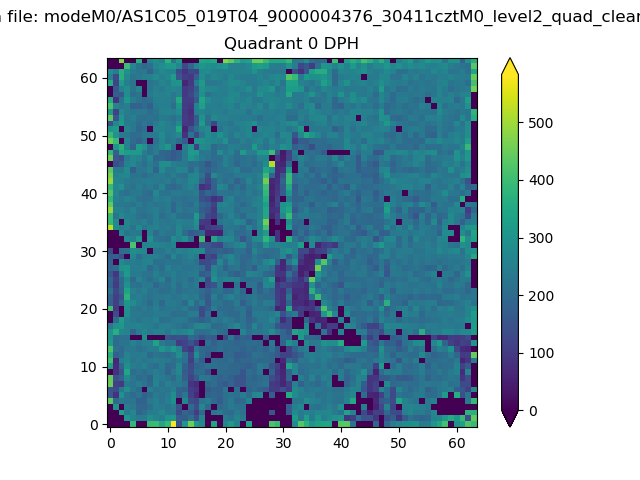 |
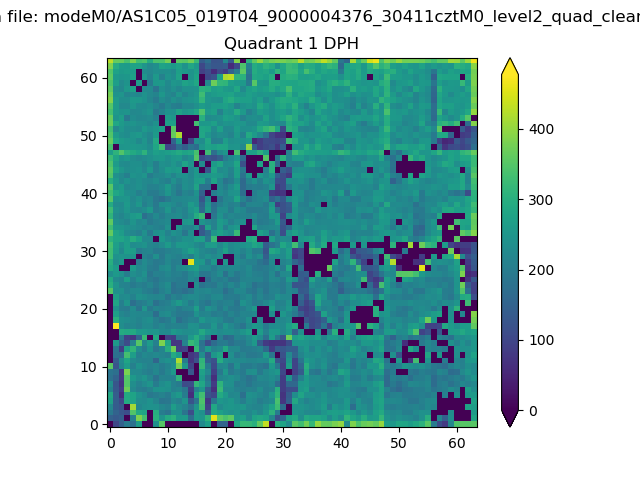 |
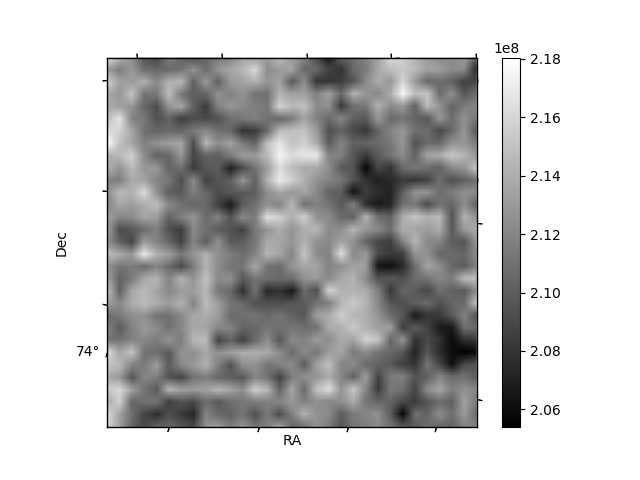
Quadrant B |
|---|---|---|---|
| Quadrant D | 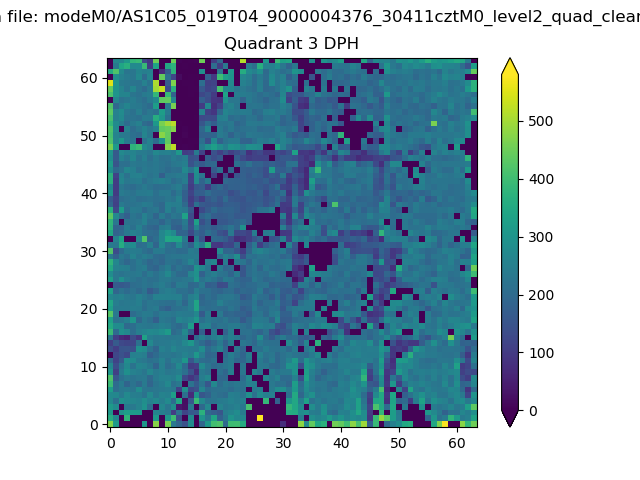 |
 |
Quadrant C |
| Plot type | Count rate plots | Images |
|---|---|---|
| Comparison with Poisson distribution Blue bars denote a histogram of data divided into 1 sec bins. Red curve is a Poisson curve with rate = median count rate of data. |
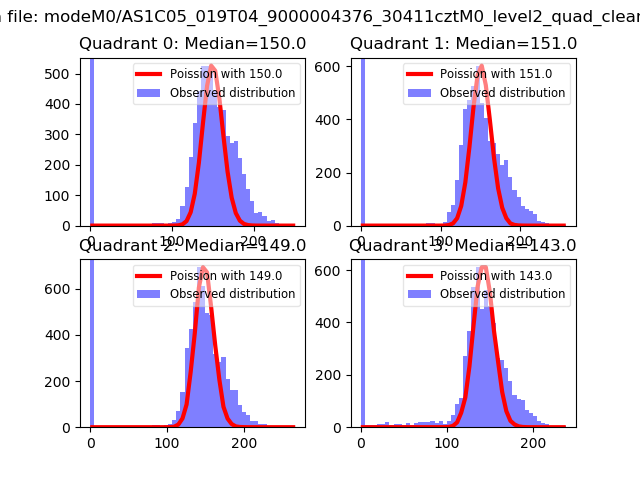 |
 |
| Quadrant-wise count rates Data is divided into 100 sec bins |
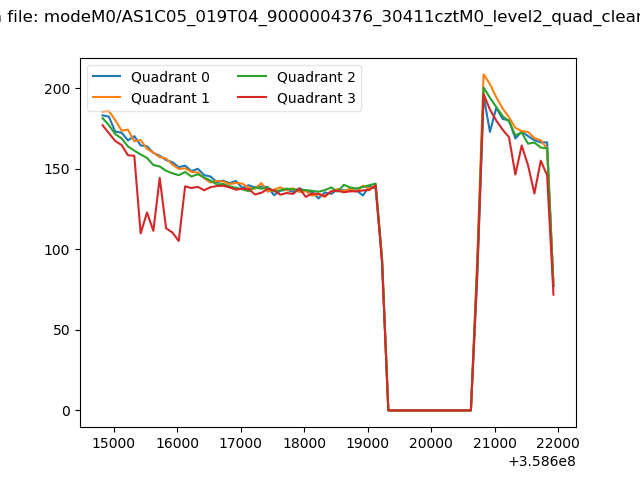 |
|
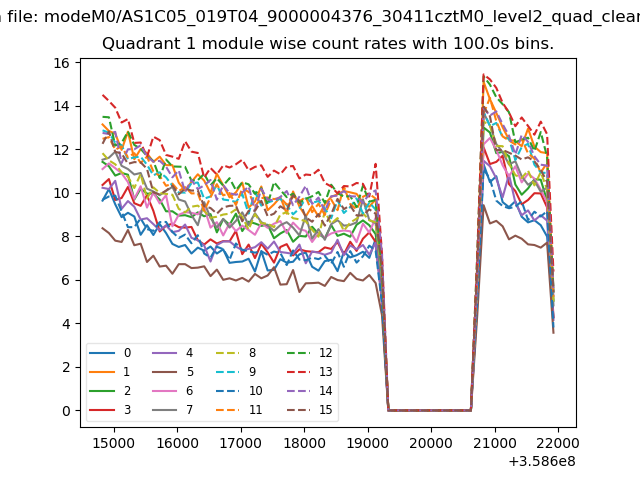
| Module-wise count rates for Quadrant A Data is divided into 100 sec bins |
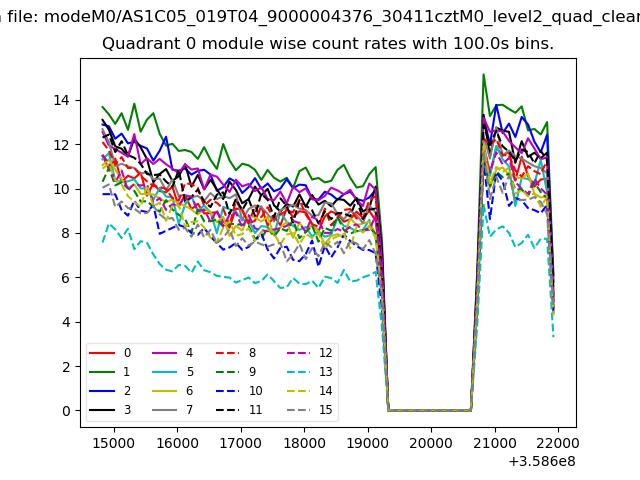 |
 |
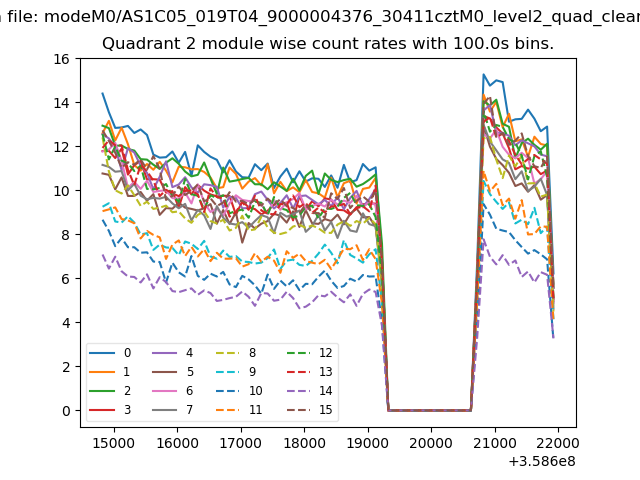
| Module-wise count rates for Quadrant B Data is divided into 100 sec bins |
 |
 |
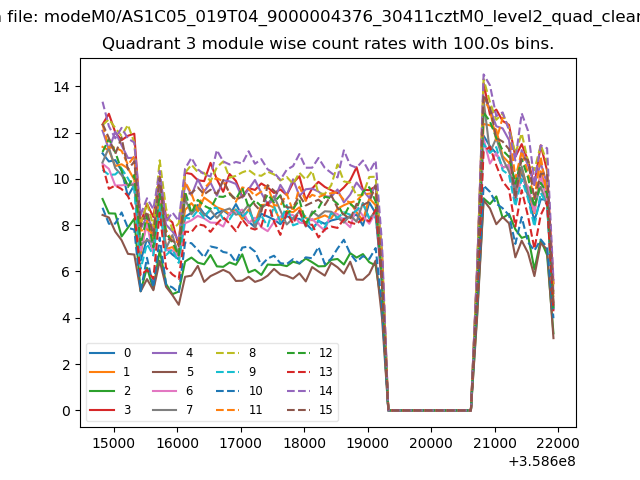
| Module-wise count rates for Quadrant C Data is divided into 100 sec bins |
 |
 |
| Module-wise count rates for Quadrant D Data is divided into 100 sec bins |
 |
 |
| Parameter | Plot |
|---|---|
| CZT HV Monitor | 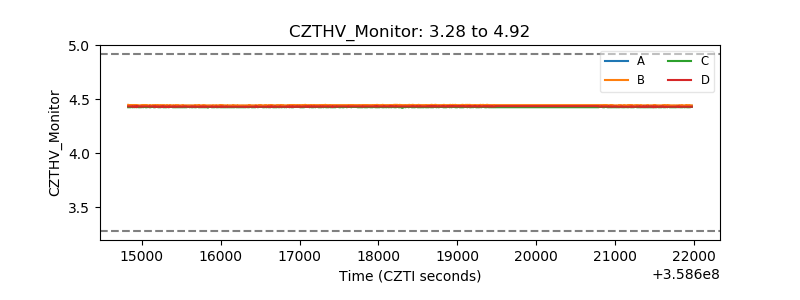 |
| D_VDD |  |
| Temperature 1 | 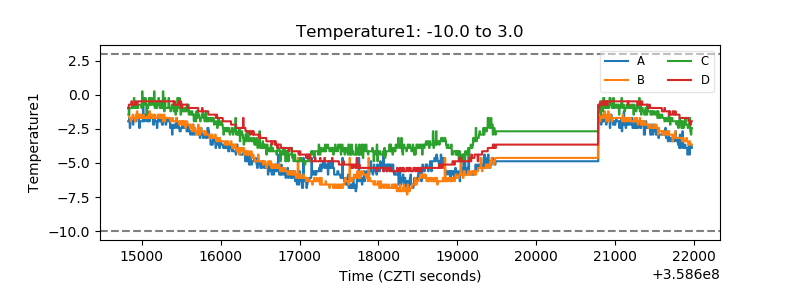 |
| Veto HV Monitor | 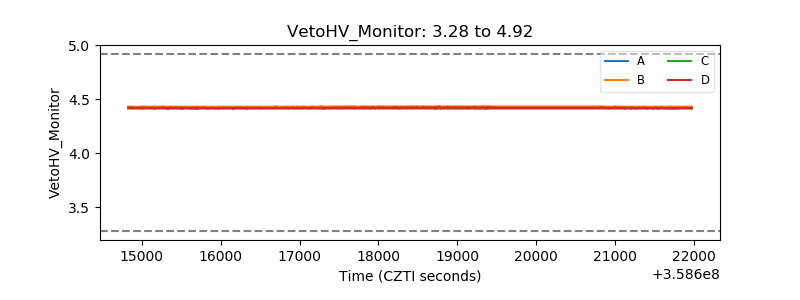 |
| Veto LLD | 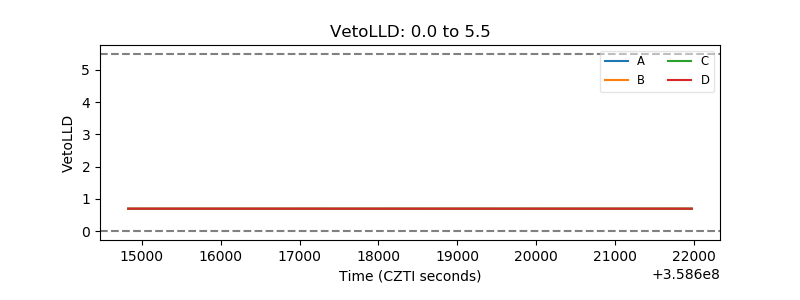 |
| Alpha Counter | 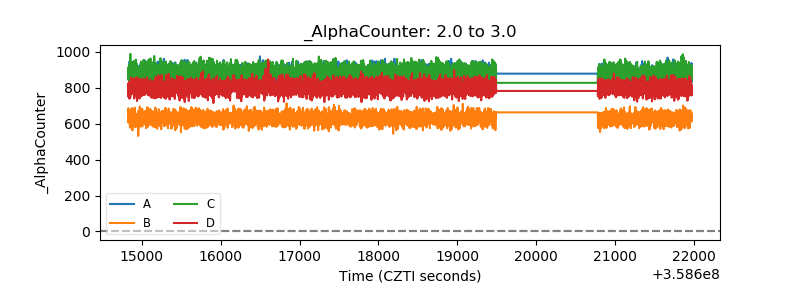 |
| _CPM_Rate | 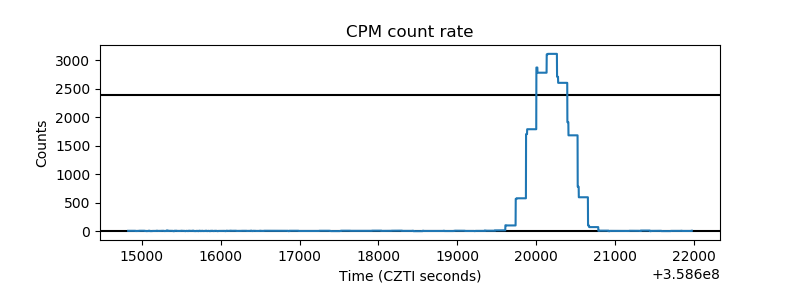 |
| CZT Counter | 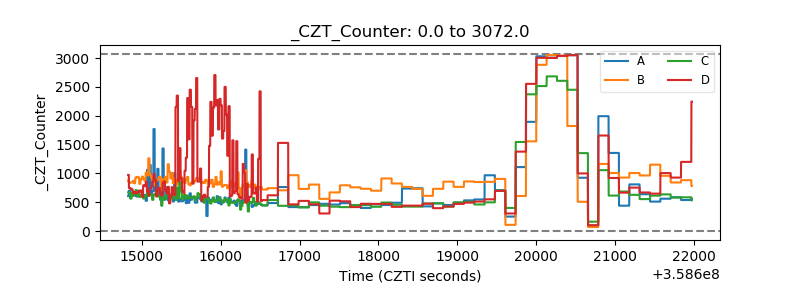 |
| +2.5 Volts monitor |  |
| +5 Volts monitor | 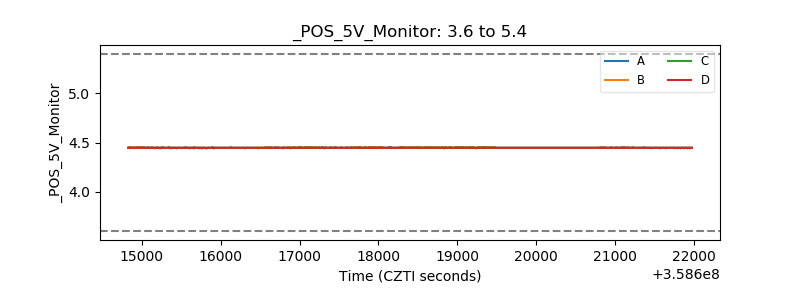 |
| _ROLL_ROT | 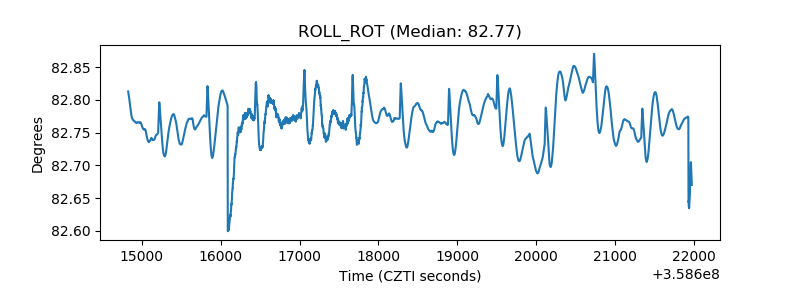 |
| _Roll_DEC | 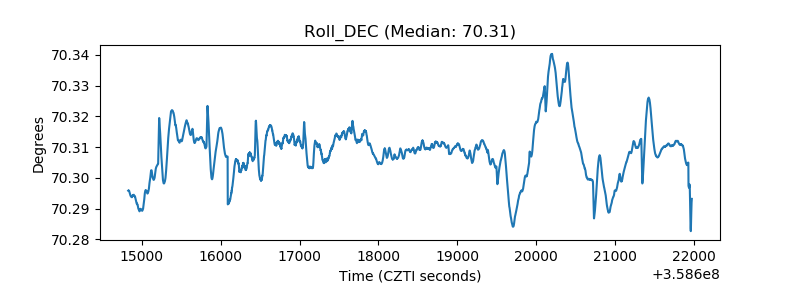 |
| _Roll_RA | 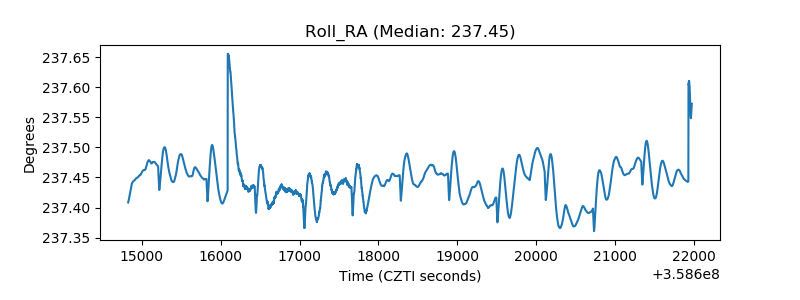 |
| Veto Counter | 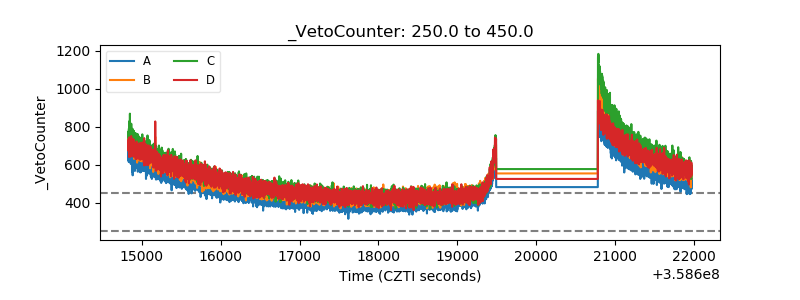 |