| Param | Original file | Final file |
|---|---|---|
| Filename | modeM0/AS1C05_019T04_9000004376_30412cztM0_level2.evt | modeM0/AS1C05_019T04_9000004376_30412cztM0_level2_quad_clean.evt |
| Size (bytes) | 573,600,960 | 125,858,880 |
| Size | 547.0 MB | 120.0 MB |
| Events in quadrant A | 3,659,937 | 851,476 |
| Events in quadrant B | 5,129,758 | 871,052 |
| Events in quadrant C | 3,591,145 | 861,287 |
| Events in quadrant D | 4,578,263 | 802,523 |
| Mode M9 | |||
|---|---|---|---|
| Quadrant | BADHDUFLAG | Total packets | Discarded packets |
| A | 0 | 17 | 0 |
| B | 0 | 18 | 0 |
| C | 0 | 18 | 0 |
| D | 0 | 18 | 0 |
| Mode SS | |||
|---|---|---|---|
| Quadrant | BADHDUFLAG | Total packets | Discarded packets |
| A | 0 | 124 | 0 |
| B | 0 | 124 | 0 |
| C | 0 | 124 | 0 |
| D | 0 | 124 | 0 |
| Mode M0 | |||
|---|---|---|---|
| Quadrant | BADHDUFLAG | Total packets | Discarded packets |
| A | 0 | 14838 | 2 |
| B | 0 | 19456 | 2 |
| C | 0 | 14777 | 2 |
| D | 0 | 17664 | 2 |
| Quadrant | Total seconds | Saturated seconds | Saturation percentage |
|---|---|---|---|
| A | 6095 | 178 | 2.920427% |
| B | 6095 | 141 | 2.313372% |
| C | 6095 | 165 | 2.707137% |
| D | 6095 | 468 | 7.678425% |
Noise dominated data is calculated using 1-second bins in cleaned event files. If a bin has >2000 counts, and if more than 50% of those come from <1% of pixels, then it is considered to be noise-dominated and hence unusable.
| Quadrant | # 1 sec bins | Bins with >0 counts | Bins with >2000 counts | High rate bins dominated by noise | Noise dominated (total time) | Noise dominated (detector-on time) | Marked lightcurve |
|---|---|---|---|---|---|---|---|
| A | 7425 | 6095 | 81 | 81 | 1.09% | 1.33% | 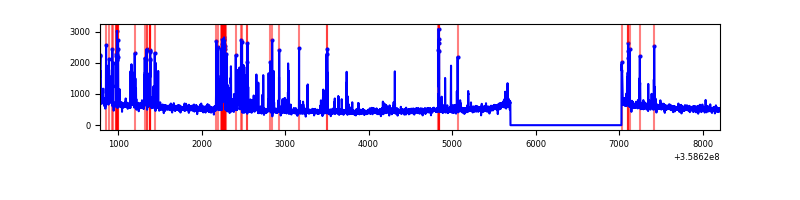 |
| B | 7425 | 6095 | 17 | 17 | 0.23% | 0.28% | 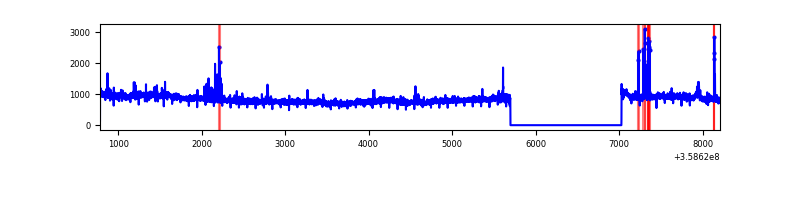 |
| C | 7425 | 6095 | 4 | 4 | 0.05% | 0.07% | 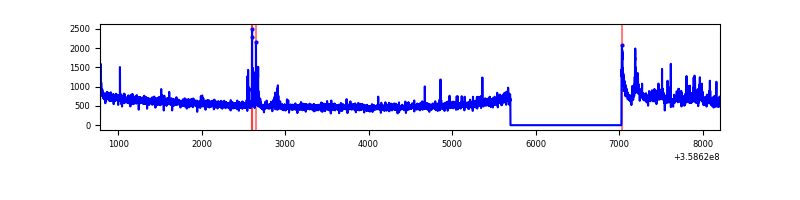 |
| D | 7425 | 6095 | 359 | 359 | 4.84% | 5.89% | 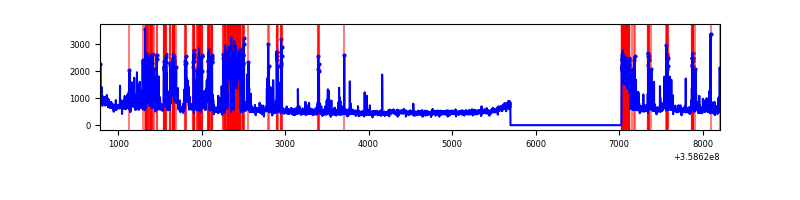 |
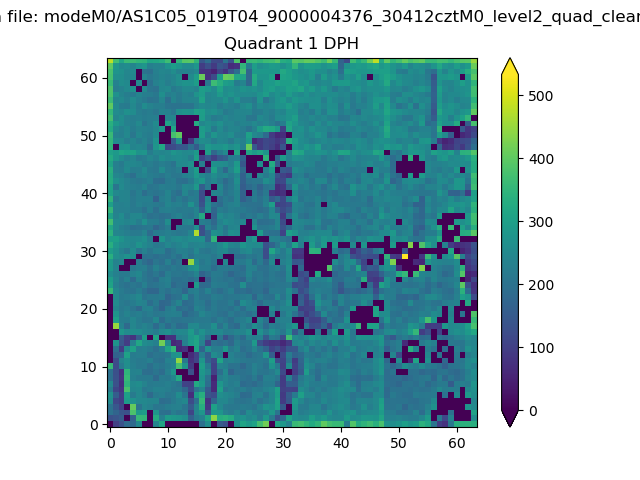
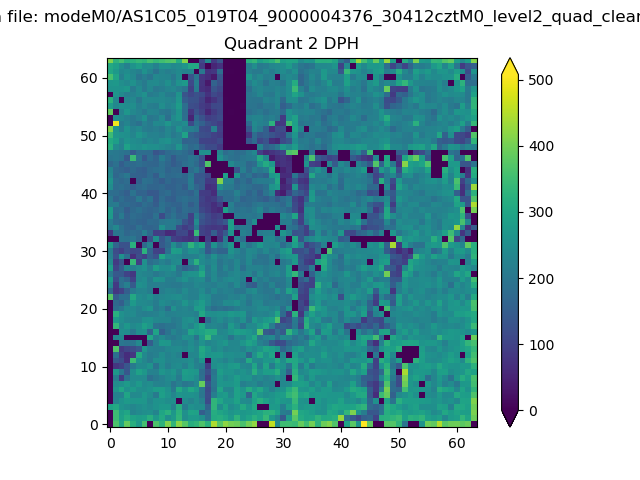
Top three noisy pixels from each quadrant. If the there are fewer than three noisy pixels in the level2.evt file, extra rows are filled as -1
| Pixel properties | Quadrant properties | ||||||
|---|---|---|---|---|---|---|---|
| Quadrant | DetID | PixID | Counts | Sigma | Mean | Median | Sigma |
| A | 0 | 13 | 515085 | 3246.4 | 802 | 789 | 158.4 |
| A | 8 | 192 | 27777 | 170.36 | 802 | 789 | 158.4 |
| A | 11 | 242 | 14560 | 86.93 | 802 | 789 | 158.4 |
| B | 6 | 159 | 1809988 | 12168.01 | 805 | 786 | 148.7 |
| B | 0 | 229 | 65330 | 434.1 | 805 | 786 | 148.7 |
| B | 15 | 32 | 37783 | 248.83 | 805 | 786 | 148.7 |
| C | 3 | 233 | 264414 | 1426.31 | 800 | 806 | 184.8 |
| C | 14 | 238 | 130277 | 700.53 | 800 | 806 | 184.8 |
| C | 10 | 22 | 53812 | 286.8 | 800 | 806 | 184.8 |
| D | 13 | 249 | 1154401 | 6338.39 | 775 | 757 | 182.0 |
| D | 8 | 195 | 214091 | 1172.11 | 775 | 757 | 182.0 |
| D | 2 | 250 | 104421 | 569.55 | 775 | 757 | 182.0 |
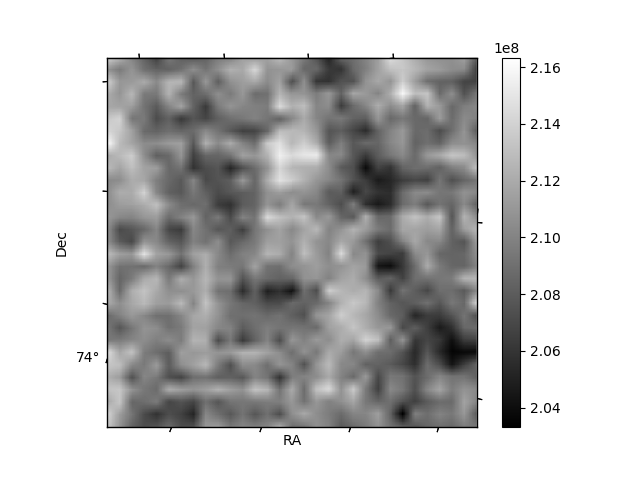
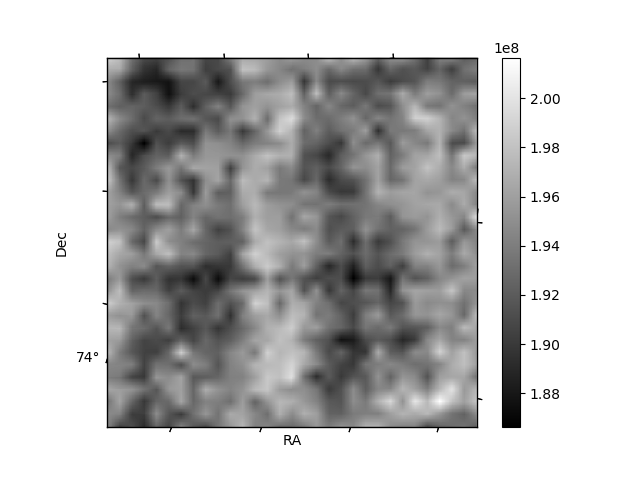
Histogram calculated using DETX and DETY for each event in the final _common_clean file
| Quadrant A | 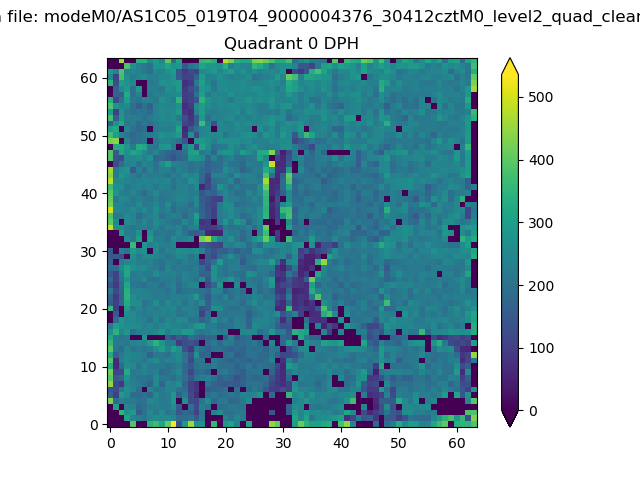 |
 |
Quadrant B |
|---|---|---|---|
| Quadrant D | 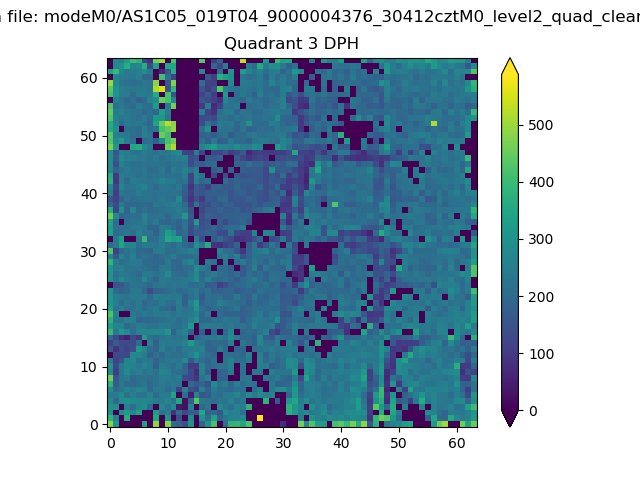 |
 |
Quadrant C |
| Plot type | Count rate plots | Images |
|---|---|---|
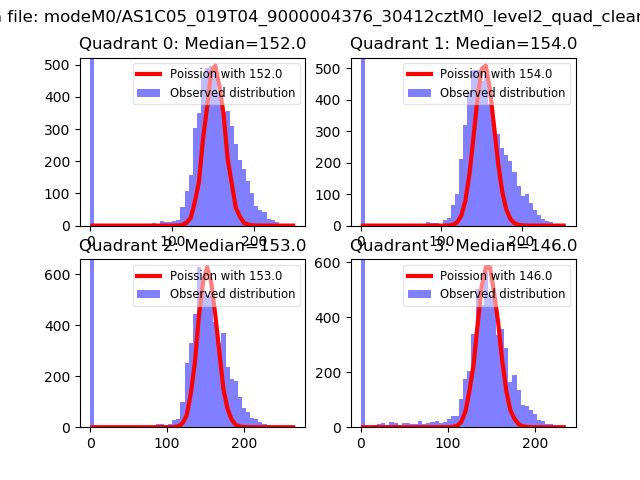
| Comparison with Poisson distribution Blue bars denote a histogram of data divided into 1 sec bins. Red curve is a Poisson curve with rate = median count rate of data. |
 |
 |
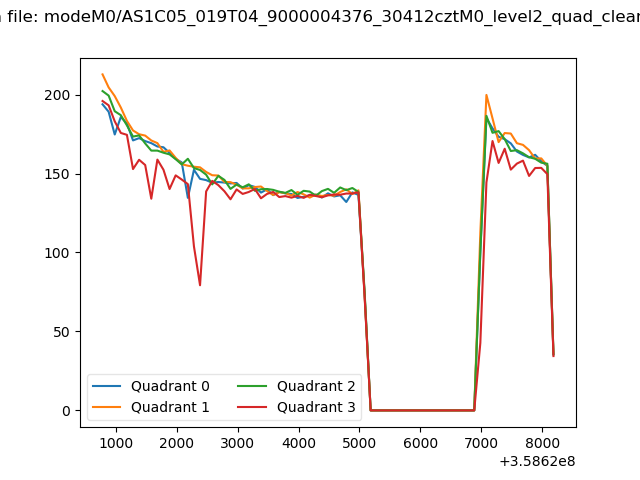
| Quadrant-wise count rates Data is divided into 100 sec bins |
 |
|
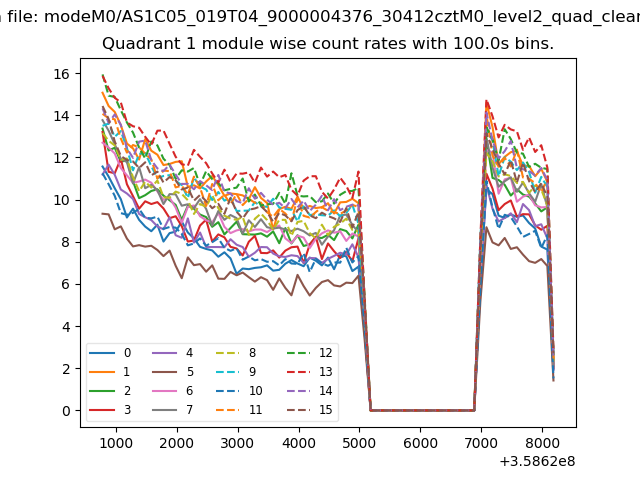
| Module-wise count rates for Quadrant A Data is divided into 100 sec bins |
 |
 |
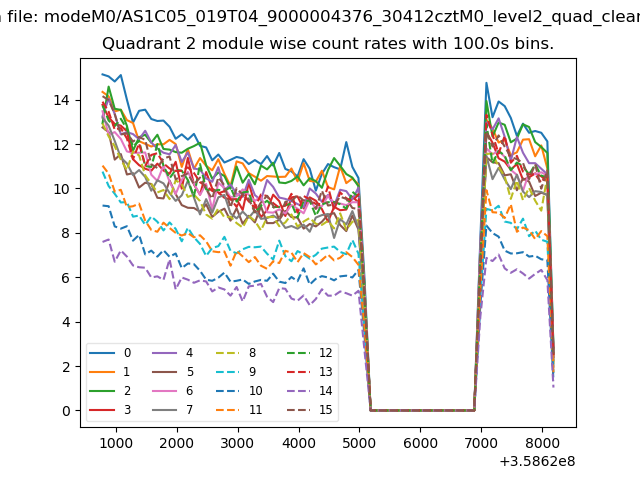
| Module-wise count rates for Quadrant B Data is divided into 100 sec bins |
 |
 |
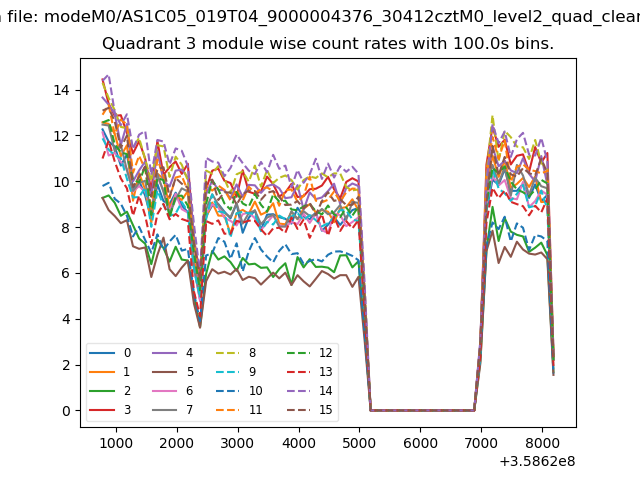
| Module-wise count rates for Quadrant C Data is divided into 100 sec bins |
 |
 |
| Module-wise count rates for Quadrant D Data is divided into 100 sec bins |
 |
 |
| Parameter | Plot |
|---|---|
| CZT HV Monitor |  |
| D_VDD | 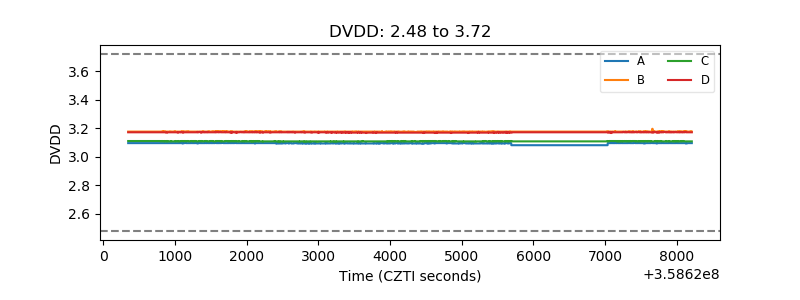 |
| Temperature 1 | 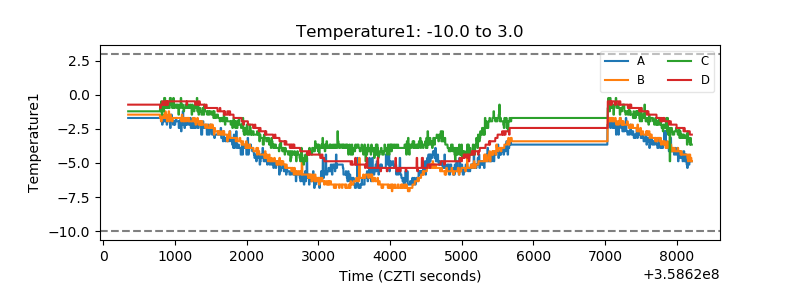 |
| Veto HV Monitor | 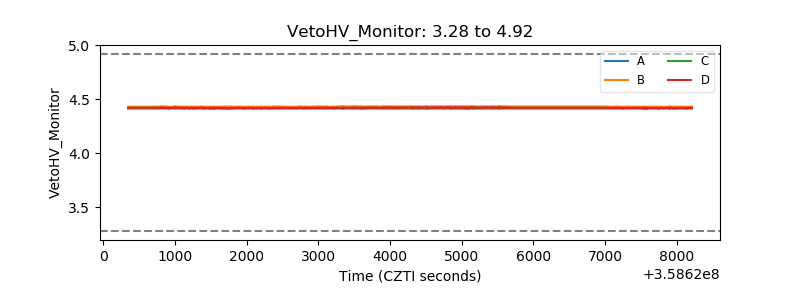 |
| Veto LLD | 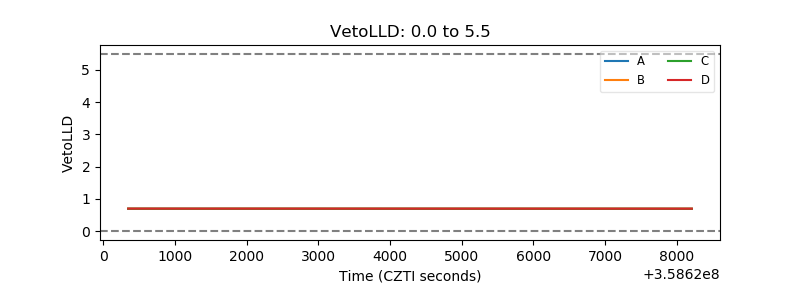 |
| Alpha Counter | 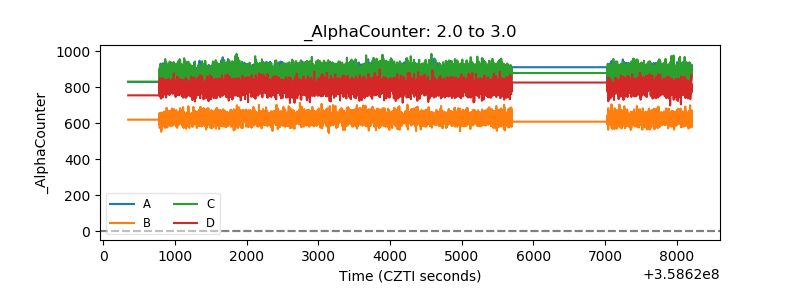 |
| _CPM_Rate | 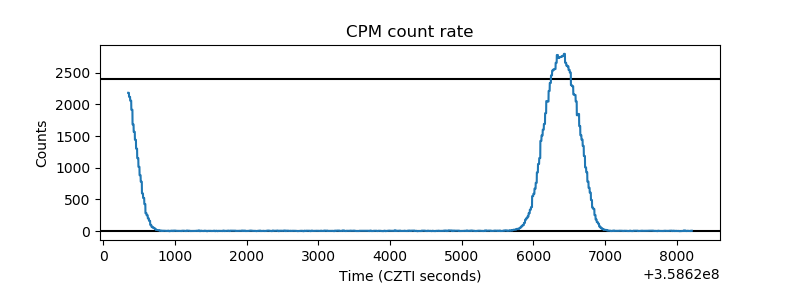 |
| CZT Counter | 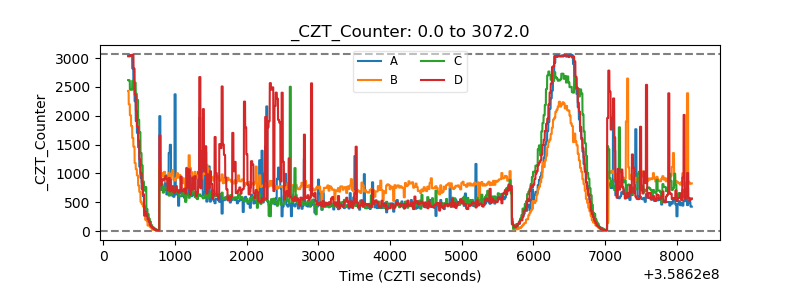 |
| +2.5 Volts monitor | 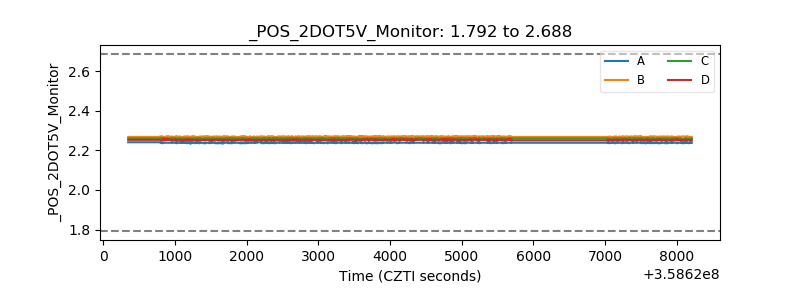 |
| +5 Volts monitor | 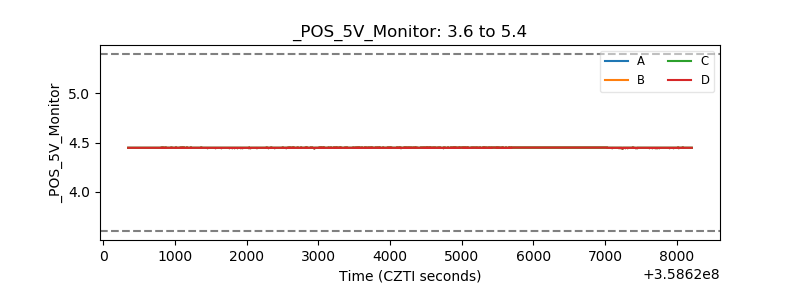 |
| _ROLL_ROT | 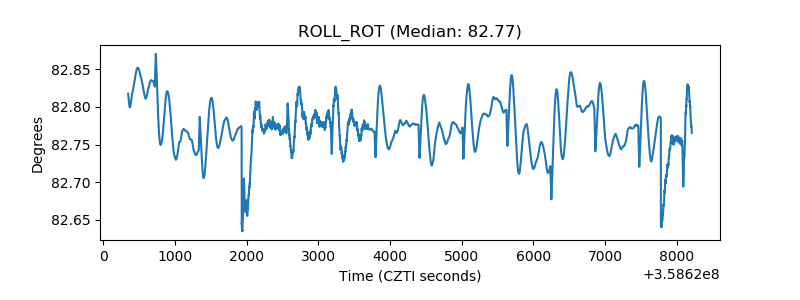 |
| _Roll_DEC | 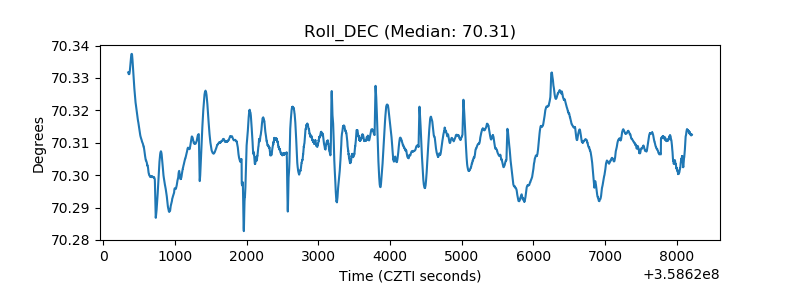 |
| _Roll_RA | 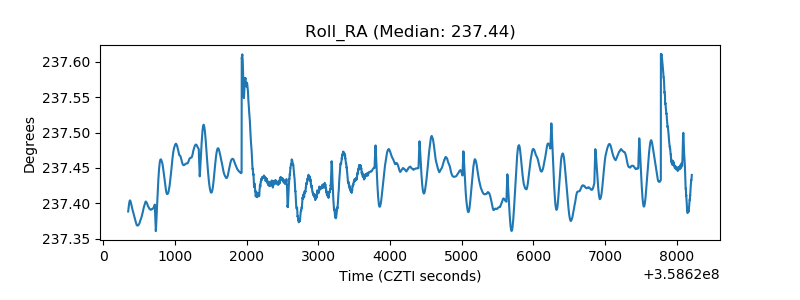 |
| Veto Counter | 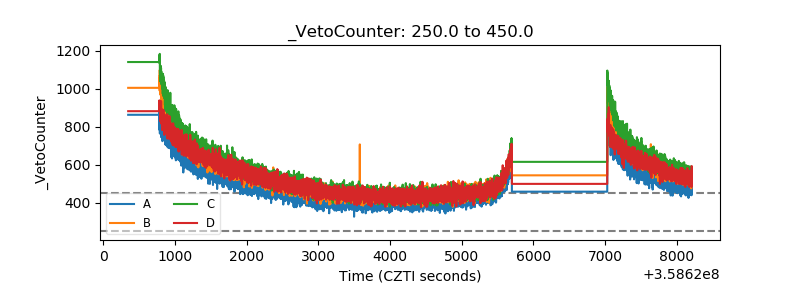 |