| Param | Original file | Final file |
|---|---|---|
| Filename | modeM0/AS1C05_019T04_9000004376_30413cztM0_level2.evt | modeM0/AS1C05_019T04_9000004376_30413cztM0_level2_quad_clean.evt |
| Size (bytes) | 551,966,400 | 115,056,000 |
| Size | 526.4 MB | 109.7 MB |
| Events in quadrant A | 3,217,084 | 767,398 |
| Events in quadrant B | 5,178,643 | 782,419 |
| Events in quadrant C | 3,973,400 | 769,345 |
| Events in quadrant D | 3,927,658 | 732,756 |
| Mode M9 | |||
|---|---|---|---|
| Quadrant | BADHDUFLAG | Total packets | Discarded packets |
| A | 0 | 14 | 0 |
| B | 0 | 15 | 0 |
| C | 0 | 15 | 0 |
| D | 0 | 15 | 0 |
| Mode SS | |||
|---|---|---|---|
| Quadrant | BADHDUFLAG | Total packets | Discarded packets |
| A | 0 | 126 | 0 |
| B | 0 | 126 | 0 |
| C | 0 | 126 | 0 |
| D | 0 | 126 | 0 |
| Mode M0 | |||
|---|---|---|---|
| Quadrant | BADHDUFLAG | Total packets | Discarded packets |
| A | 0 | 13517 | 2 |
| B | 0 | 19432 | 4 |
| C | 0 | 16047 | 2 |
| D | 0 | 15868 | 2 |
| Quadrant | Total seconds | Saturated seconds | Saturation percentage |
|---|---|---|---|
| A | 6200 | 66 | 1.064516% |
| B | 6199 | 133 | 2.145507% |
| C | 6199 | 183 | 2.952089% |
| D | 6199 | 261 | 4.210357% |
Noise dominated data is calculated using 1-second bins in cleaned event files. If a bin has >2000 counts, and if more than 50% of those come from <1% of pixels, then it is considered to be noise-dominated and hence unusable.
| Quadrant | # 1 sec bins | Bins with >0 counts | Bins with >2000 counts | High rate bins dominated by noise | Noise dominated (total time) | Noise dominated (detector-on time) | Marked lightcurve |
|---|---|---|---|---|---|---|---|
| A | 7490 | 6201 | 13 | 13 | 0.17% | 0.21% | 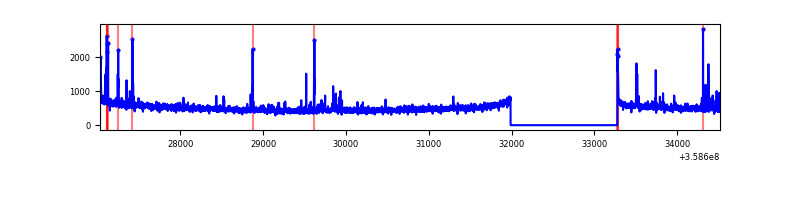 |
| B | 7489 | 6200 | 33 | 33 | 0.44% | 0.53% | 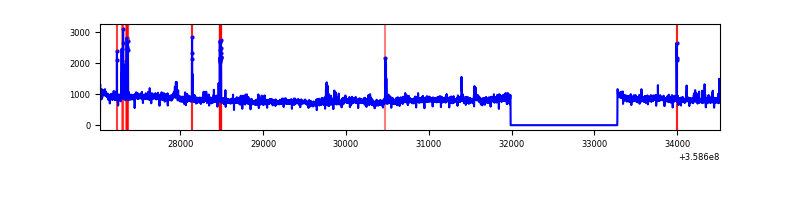 |
| C | 7489 | 6199 | 9 | 9 | 0.12% | 0.15% | 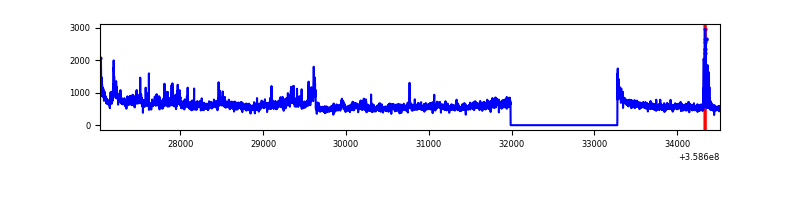 |
| D | 7489 | 6200 | 188 | 188 | 2.51% | 3.03% | 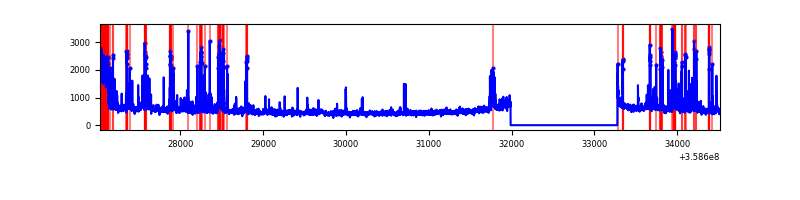 |
Top three noisy pixels from each quadrant. If the there are fewer than three noisy pixels in the level2.evt file, extra rows are filled as -1
| Pixel properties | Quadrant properties | ||||||
|---|---|---|---|---|---|---|---|
| Quadrant | DetID | PixID | Counts | Sigma | Mean | Median | Sigma |
| A | 0 | 13 | 140640 | 904.9 | 787 | 772 | 154.6 |
| A | 8 | 192 | 27537 | 173.16 | 787 | 772 | 154.6 |
| A | 13 | 254 | 12345 | 74.87 | 787 | 772 | 154.6 |
| B | 6 | 159 | 1852191 | 12815.28 | 789 | 769 | 144.5 |
| B | 0 | 229 | 81980 | 562.13 | 789 | 769 | 144.5 |
| B | 4 | 80 | 49778 | 339.23 | 789 | 769 | 144.5 |
| C | 3 | 233 | 723294 | 4051.08 | 780 | 788 | 178.3 |
| C | 14 | 238 | 128582 | 716.54 | 780 | 788 | 178.3 |
| C | 10 | 22 | 60151 | 332.85 | 780 | 788 | 178.3 |
| D | 13 | 249 | 563661 | 2927.53 | 758 | 746 | 192.3 |
| D | 8 | 195 | 190429 | 986.48 | 758 | 746 | 192.3 |
| D | 2 | 250 | 105576 | 545.19 | 758 | 746 | 192.3 |
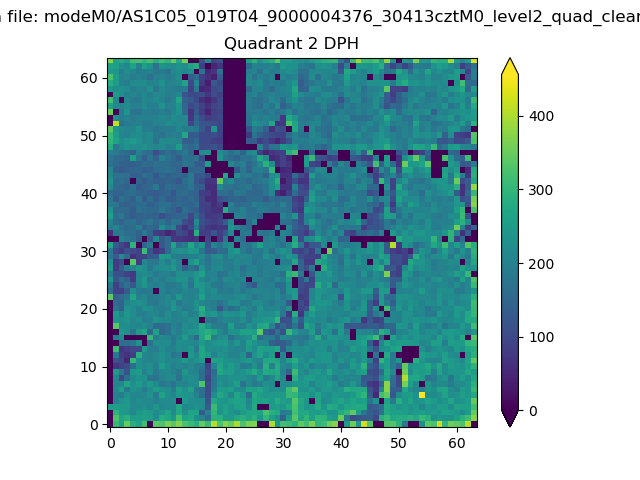
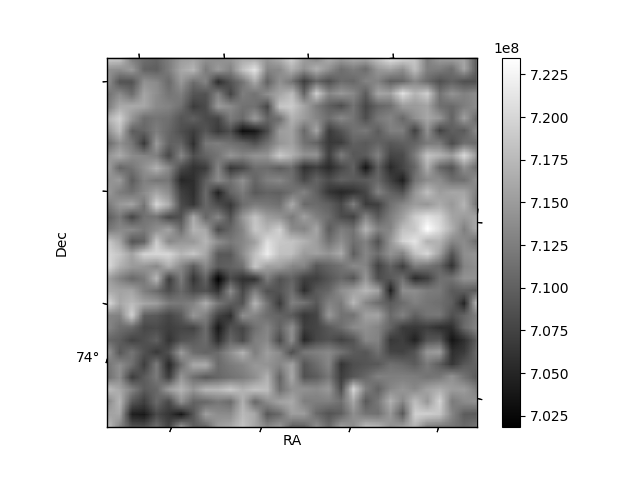
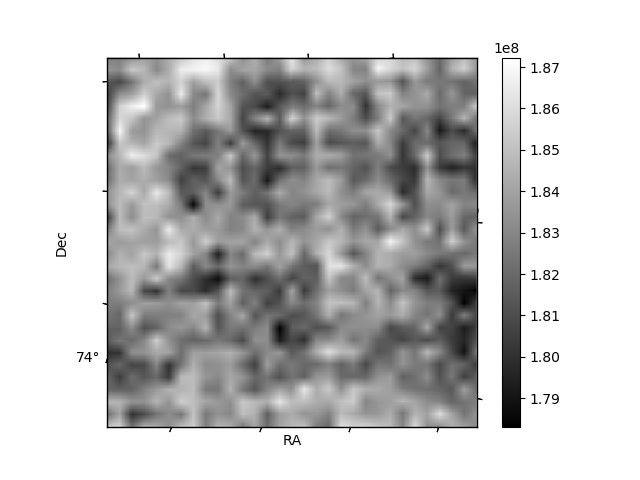
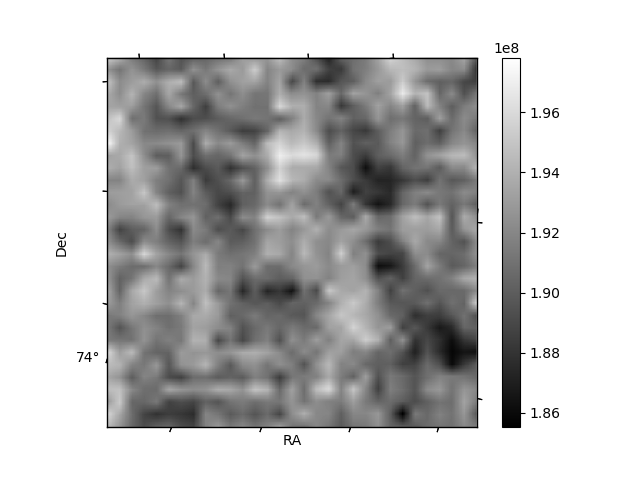
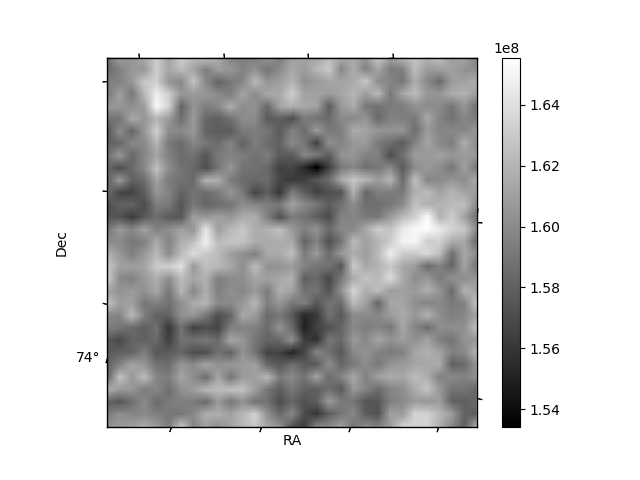
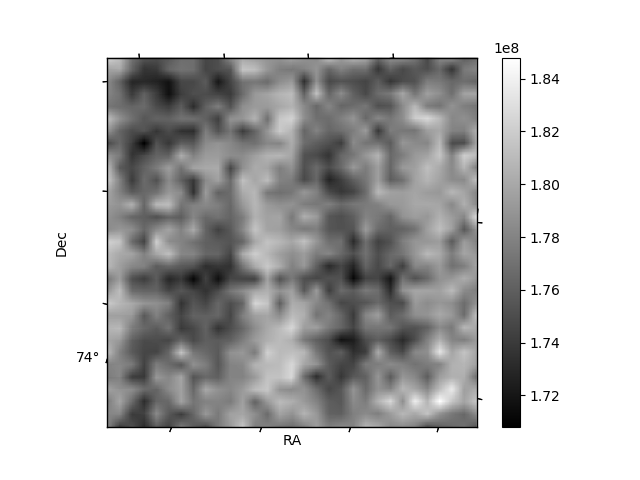
Histogram calculated using DETX and DETY for each event in the final _common_clean file
| Quadrant A | 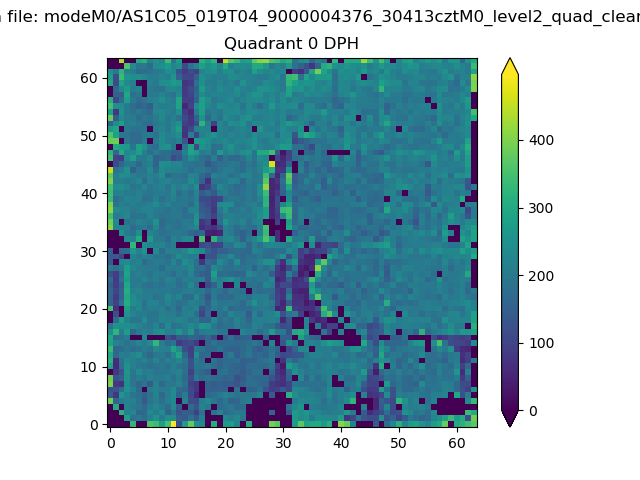 |
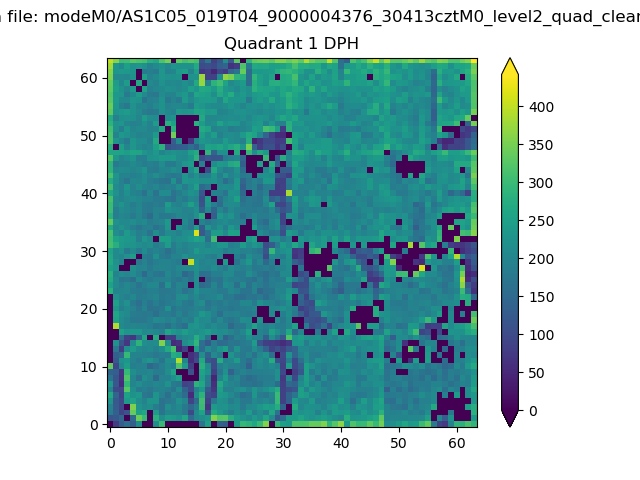 |
Quadrant B |
|---|---|---|---|
| Quadrant D | 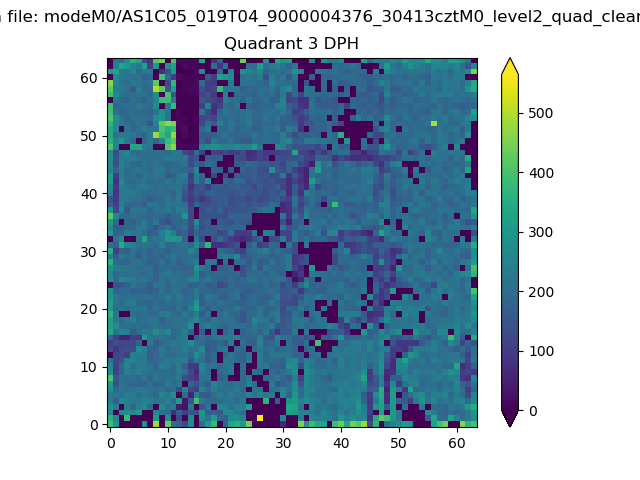 |
 |
Quadrant C |
| Plot type | Count rate plots | Images |
|---|---|---|
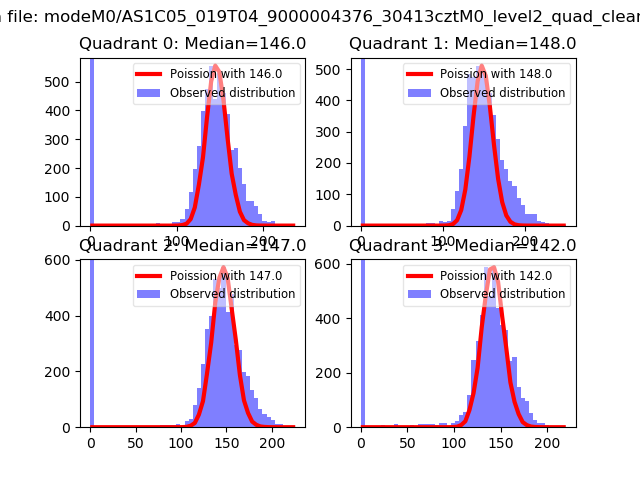
| Comparison with Poisson distribution Blue bars denote a histogram of data divided into 1 sec bins. Red curve is a Poisson curve with rate = median count rate of data. |
 |
 |
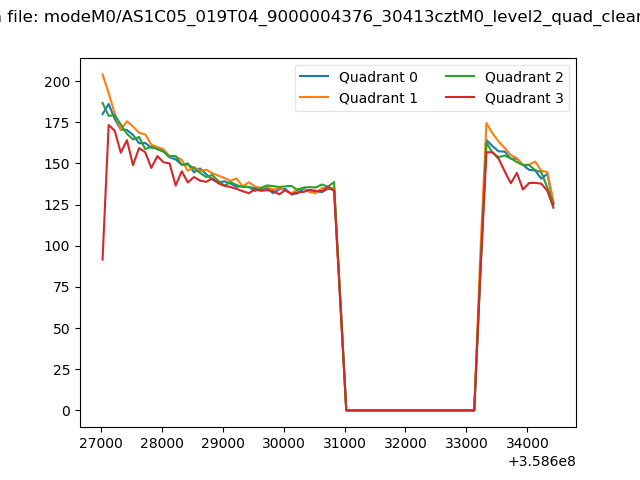
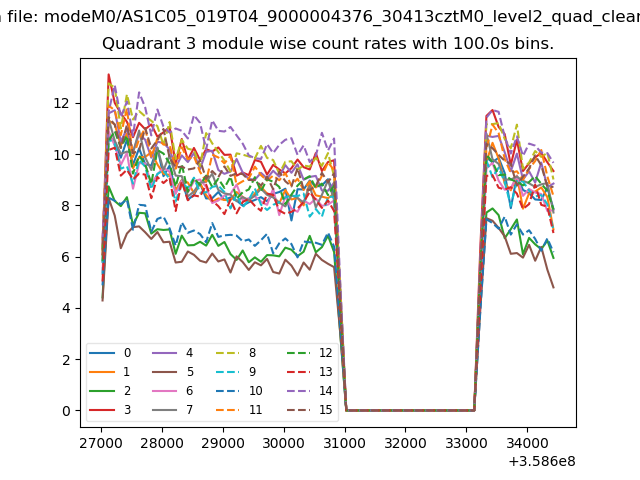
| Quadrant-wise count rates Data is divided into 100 sec bins |
 |
|
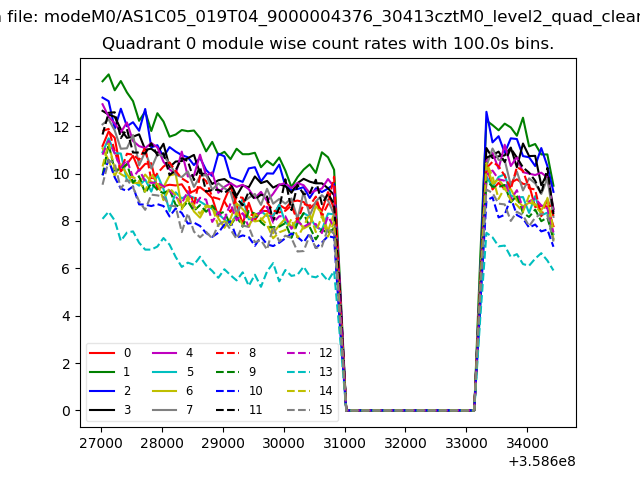
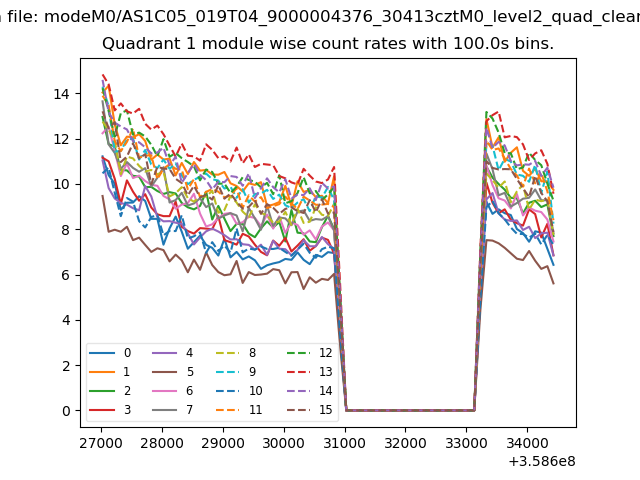
| Module-wise count rates for Quadrant A Data is divided into 100 sec bins |
 |
 |
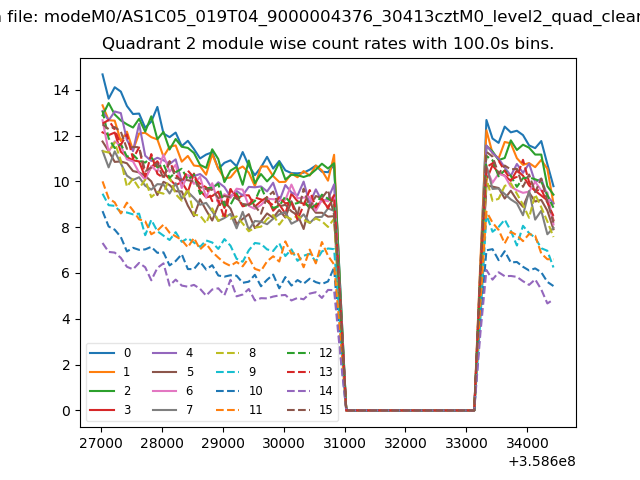
| Module-wise count rates for Quadrant B Data is divided into 100 sec bins |
 |
 |
| Module-wise count rates for Quadrant C Data is divided into 100 sec bins |
 |
 |
| Module-wise count rates for Quadrant D Data is divided into 100 sec bins |
 |
 |
| Parameter | Plot |
|---|---|
| CZT HV Monitor | 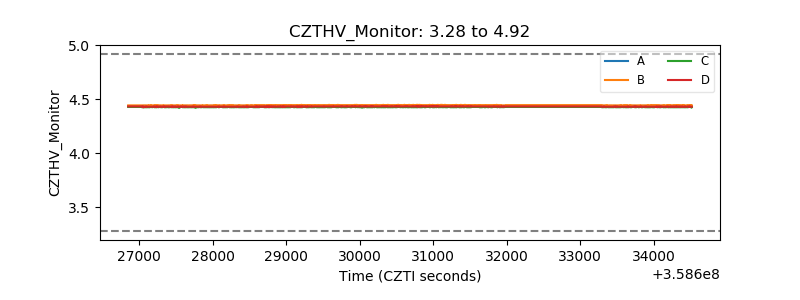 |
| D_VDD | 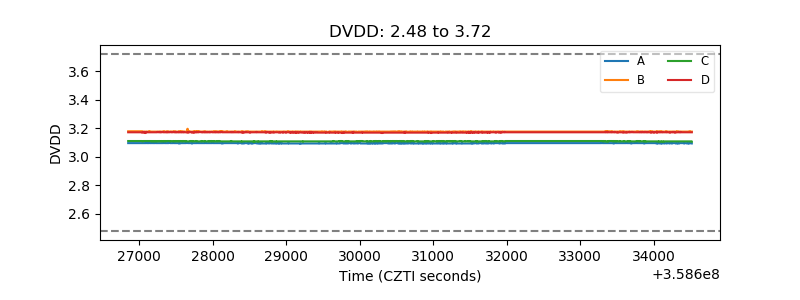 |
| Temperature 1 | 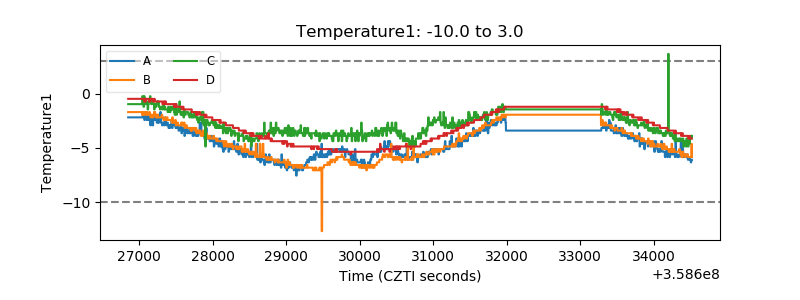 |
| Veto HV Monitor |  |
| Veto LLD | 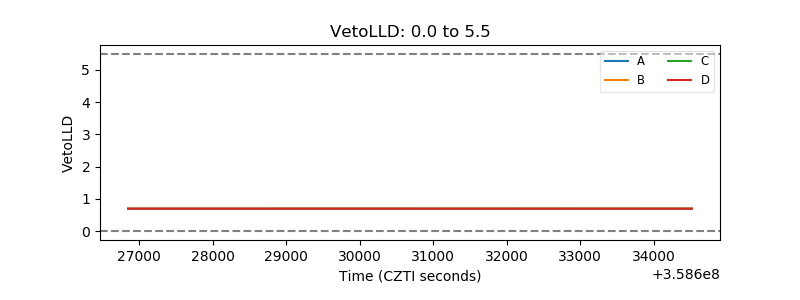 |
| Alpha Counter | 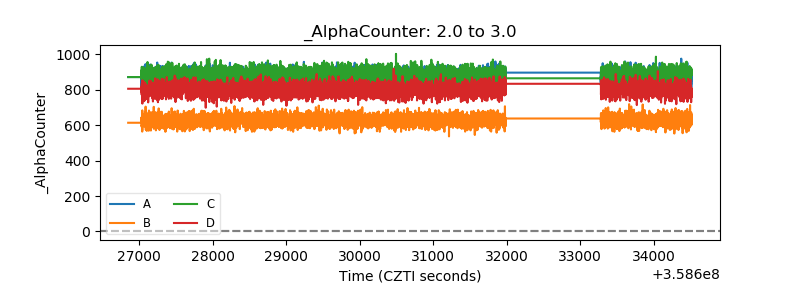 |
| _CPM_Rate | 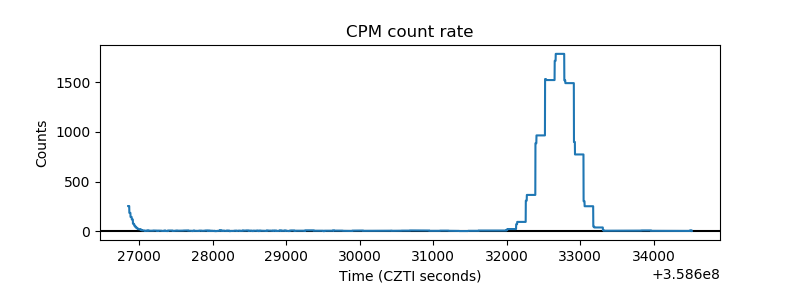 |
| CZT Counter | 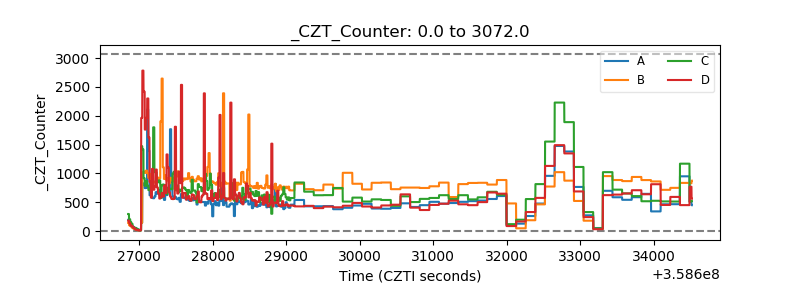 |
| +2.5 Volts monitor |  |
| +5 Volts monitor |  |
| _ROLL_ROT | 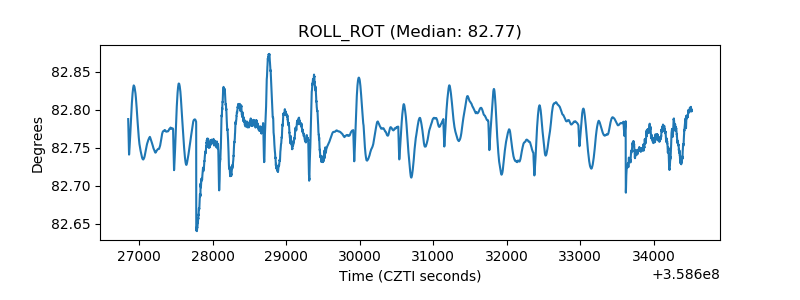 |
| _Roll_DEC | 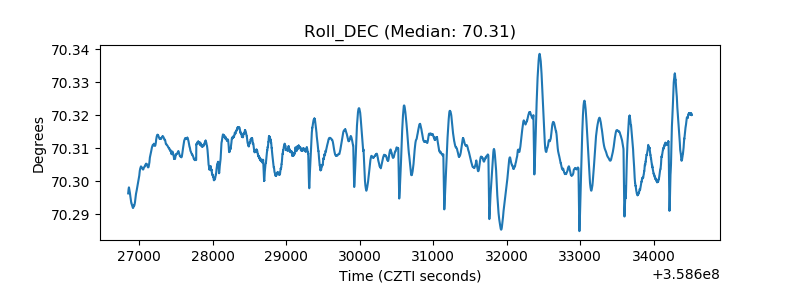 |
| _Roll_RA | 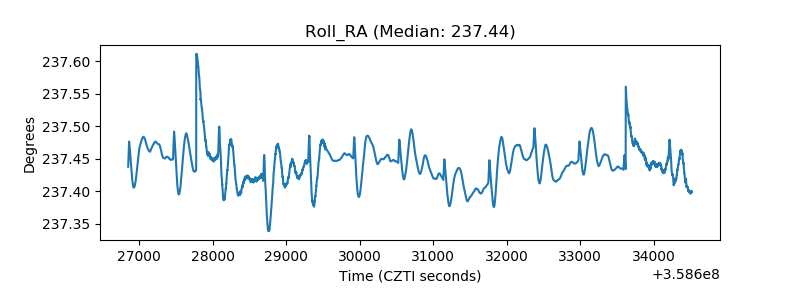 |
| Veto Counter | 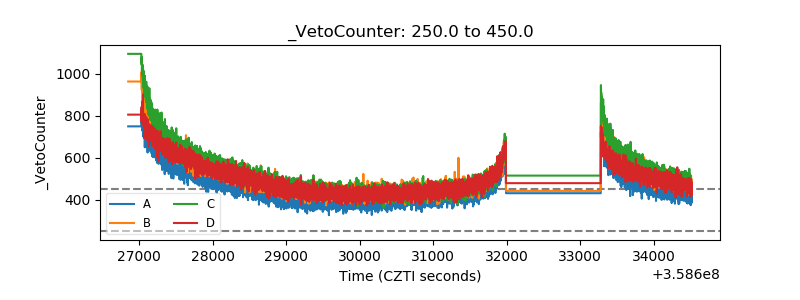 |