| Param | Original file | Final file |
|---|---|---|
| Filename | modeM0/AS1C05_019T04_9000004376_30414cztM0_level2.evt | modeM0/AS1C05_019T04_9000004376_30414cztM0_level2_quad_clean.evt |
| Size (bytes) | 531,748,800 | 108,607,680 |
| Size | 507.1 MB | 103.6 MB |
| Events in quadrant A | 3,155,988 | 715,366 |
| Events in quadrant B | 5,365,425 | 723,841 |
| Events in quadrant C | 3,444,327 | 711,896 |
| Events in quadrant D | 3,702,272 | 689,259 |
| Mode M9 | |||
|---|---|---|---|
| Quadrant | BADHDUFLAG | Total packets | Discarded packets |
| A | 0 | 21 | 0 |
| B | 0 | 22 | 0 |
| C | 0 | 22 | 0 |
| D | 0 | 22 | 0 |
| Mode SS | |||
|---|---|---|---|
| Quadrant | BADHDUFLAG | Total packets | Discarded packets |
| A | 0 | 130 | 0 |
| B | 0 | 130 | 0 |
| C | 0 | 130 | 0 |
| D | 0 | 130 | 0 |
| Mode M0 | |||
|---|---|---|---|
| Quadrant | BADHDUFLAG | Total packets | Discarded packets |
| A | 0 | 13615 | 2 |
| B | 0 | 20354 | 3 |
| C | 0 | 14298 | 2 |
| D | 0 | 15379 | 2 |
| Quadrant | Total seconds | Saturated seconds | Saturation percentage |
|---|---|---|---|
| A | 6437 | 40 | 0.621407% |
| B | 6436 | 125 | 1.942200% |
| C | 6436 | 203 | 3.154133% |
| D | 6436 | 176 | 2.734618% |
Noise dominated data is calculated using 1-second bins in cleaned event files. If a bin has >2000 counts, and if more than 50% of those come from <1% of pixels, then it is considered to be noise-dominated and hence unusable.
| Quadrant | # 1 sec bins | Bins with >0 counts | Bins with >2000 counts | High rate bins dominated by noise | Noise dominated (total time) | Noise dominated (detector-on time) | Marked lightcurve |
|---|---|---|---|---|---|---|---|
| A | 7502 | 6438 | 5 | 5 | 0.07% | 0.08% | 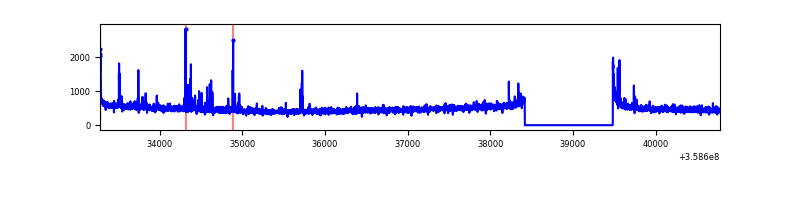 |
| B | 7501 | 6436 | 13 | 13 | 0.17% | 0.20% | 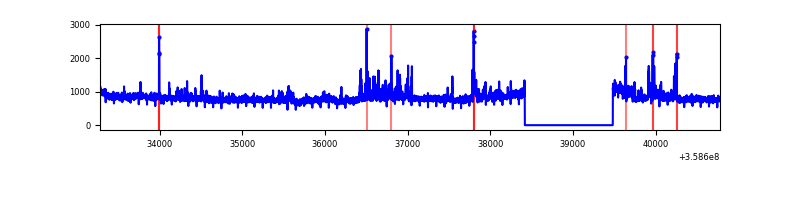 |
| C | 7501 | 6436 | 24 | 24 | 0.32% | 0.37% | 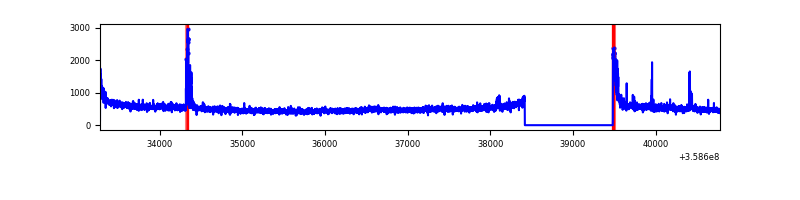 |
| D | 7501 | 6436 | 106 | 106 | 1.41% | 1.65% | 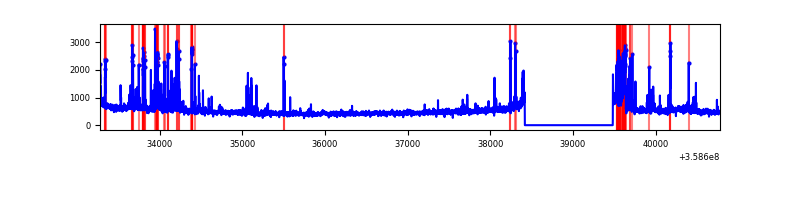 |
Top three noisy pixels from each quadrant. If the there are fewer than three noisy pixels in the level2.evt file, extra rows are filled as -1
| Pixel properties | Quadrant properties | ||||||
|---|---|---|---|---|---|---|---|
| Quadrant | DetID | PixID | Counts | Sigma | Mean | Median | Sigma |
| A | 0 | 13 | 95398 | 613.37 | 785 | 771 | 154.3 |
| A | 8 | 192 | 24100 | 151.22 | 785 | 771 | 154.3 |
| A | 13 | 254 | 12899 | 78.61 | 785 | 771 | 154.3 |
| B | 6 | 159 | 1875490 | 12816.54 | 787 | 766 | 146.3 |
| B | 0 | 229 | 313763 | 2139.8 | 787 | 766 | 146.3 |
| B | 4 | 80 | 41865 | 280.97 | 787 | 766 | 146.3 |
| C | 14 | 238 | 139360 | 783.11 | 768 | 772 | 177.0 |
| C | 3 | 233 | 121688 | 683.25 | 768 | 772 | 177.0 |
| C | 10 | 22 | 79407 | 444.34 | 768 | 772 | 177.0 |
| D | 8 | 195 | 226622 | 1214.96 | 762 | 744 | 185.9 |
| D | 13 | 138 | 215679 | 1156.1 | 762 | 744 | 185.9 |
| D | 13 | 249 | 195110 | 1045.46 | 762 | 744 | 185.9 |
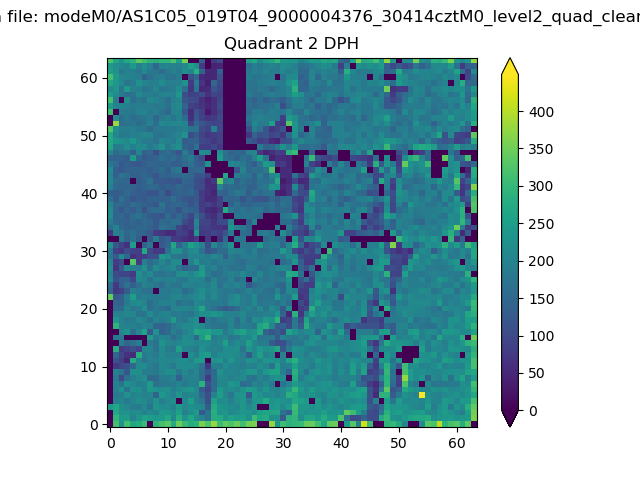
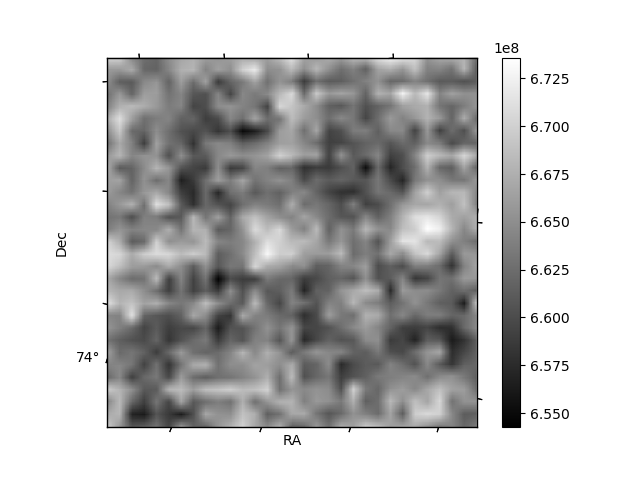
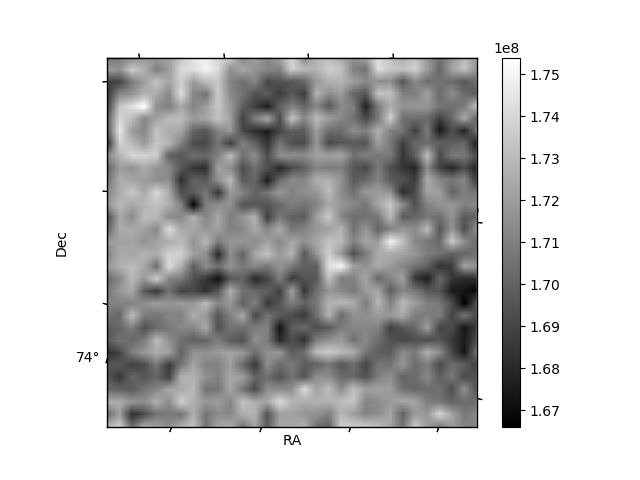
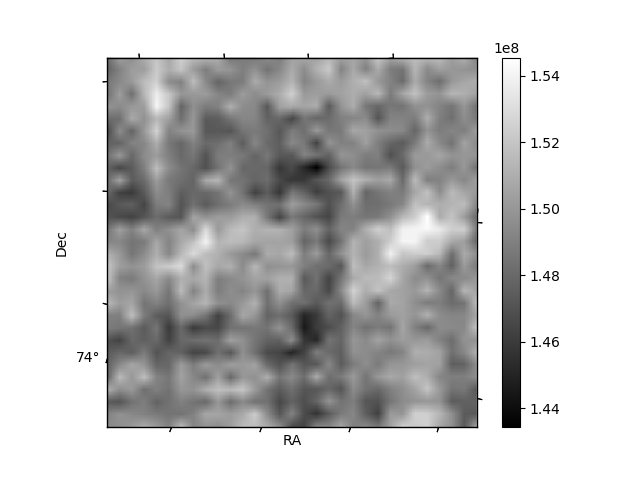
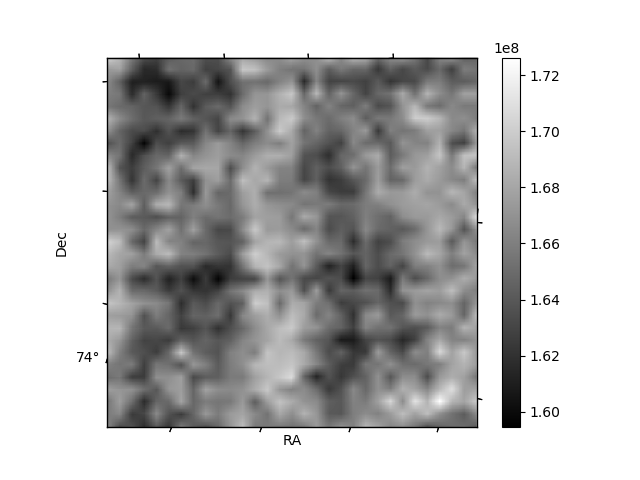
Histogram calculated using DETX and DETY for each event in the final _common_clean file
| Quadrant A | 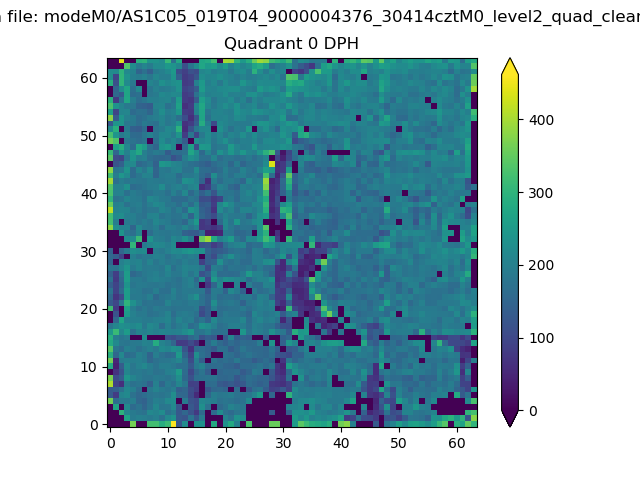 |
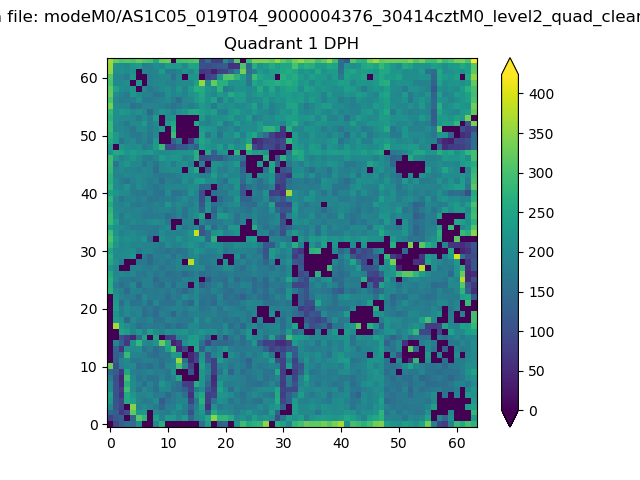 |
Quadrant B |
|---|---|---|---|
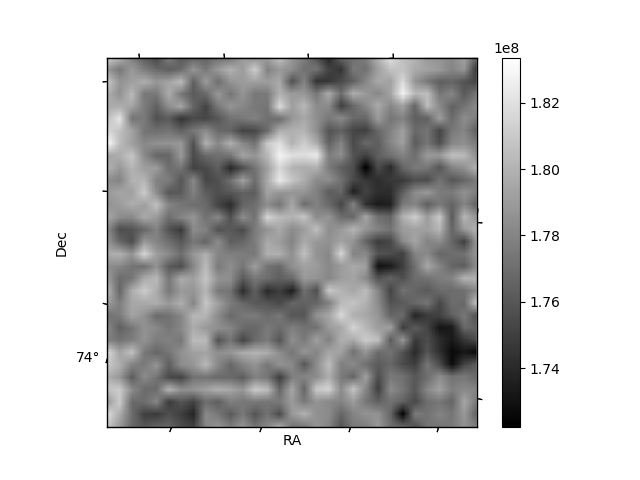
| Quadrant D | 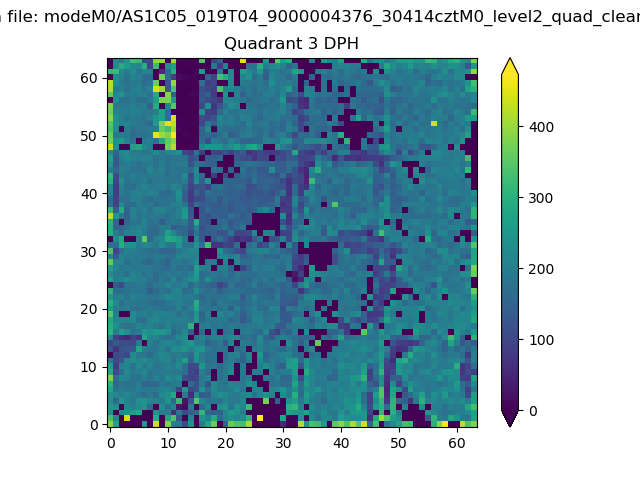 |
 |
Quadrant C |
| Plot type | Count rate plots | Images |
|---|---|---|
| Comparison with Poisson distribution Blue bars denote a histogram of data divided into 1 sec bins. Red curve is a Poisson curve with rate = median count rate of data. |
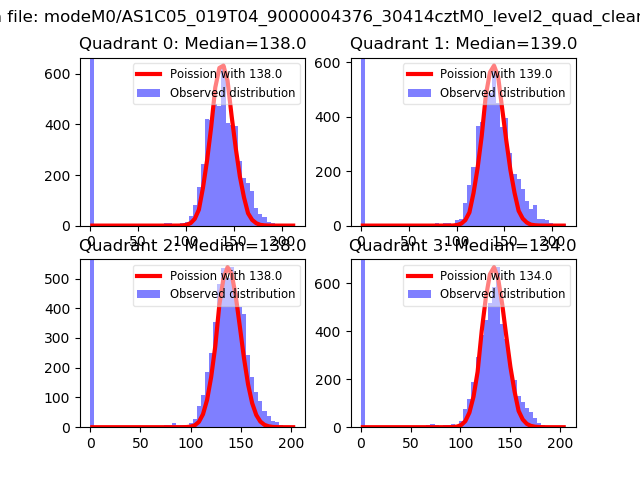 |
 |
| Quadrant-wise count rates Data is divided into 100 sec bins |
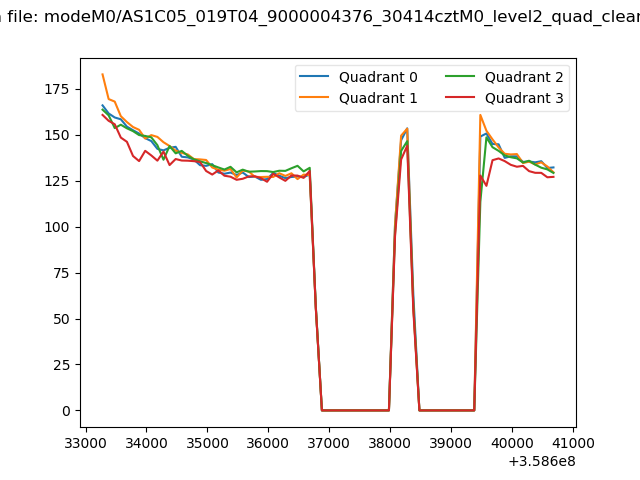 |
|
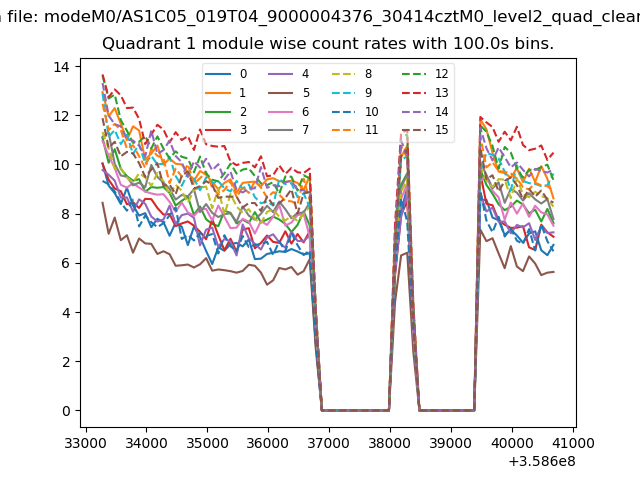
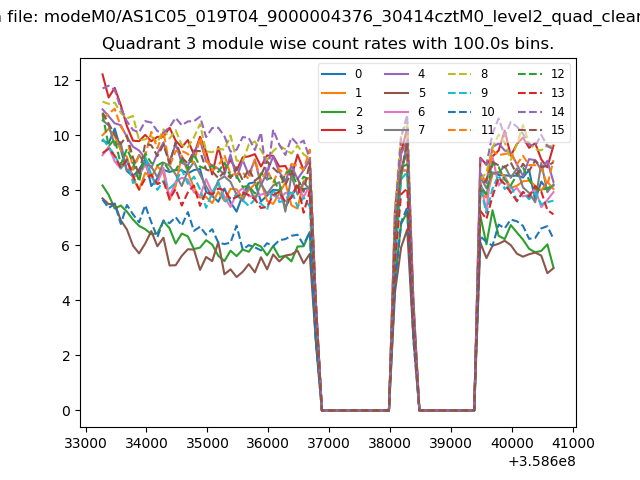
| Module-wise count rates for Quadrant A Data is divided into 100 sec bins |
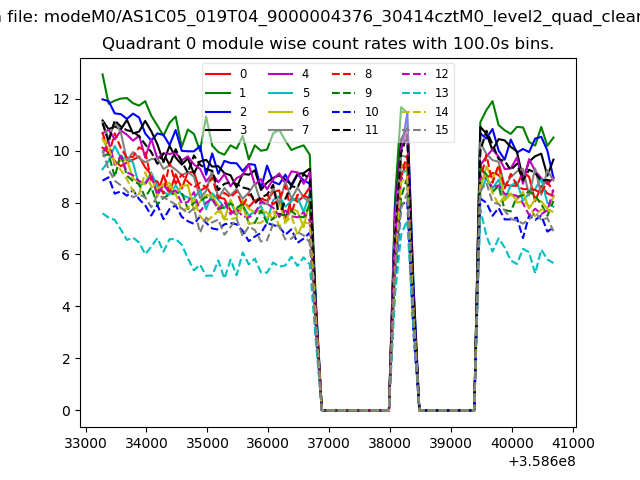 |
 |
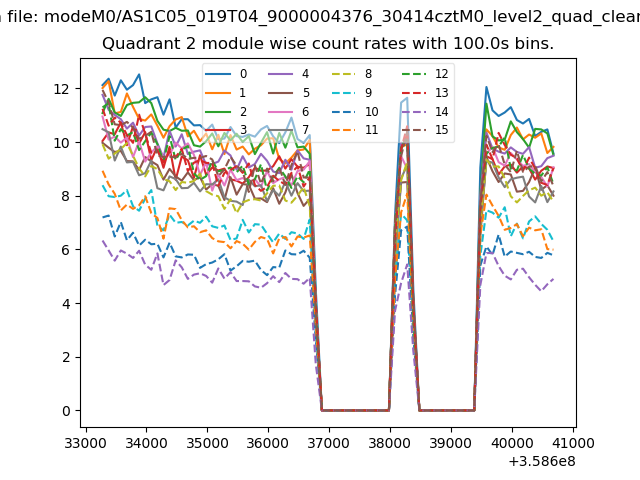
| Module-wise count rates for Quadrant B Data is divided into 100 sec bins |
 |
 |
| Module-wise count rates for Quadrant C Data is divided into 100 sec bins |
 |
 |
| Module-wise count rates for Quadrant D Data is divided into 100 sec bins |
 |
 |
| Parameter | Plot |
|---|---|
| CZT HV Monitor | 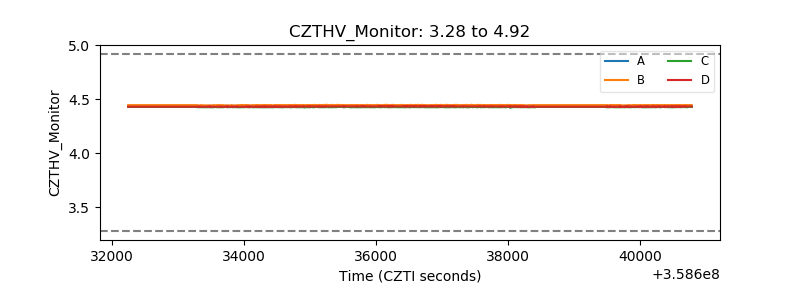 |
| D_VDD | 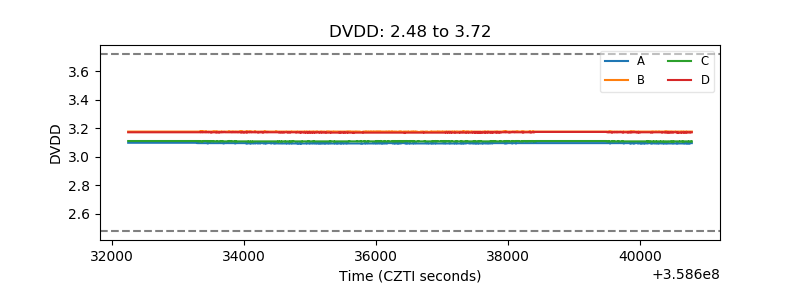 |
| Temperature 1 | 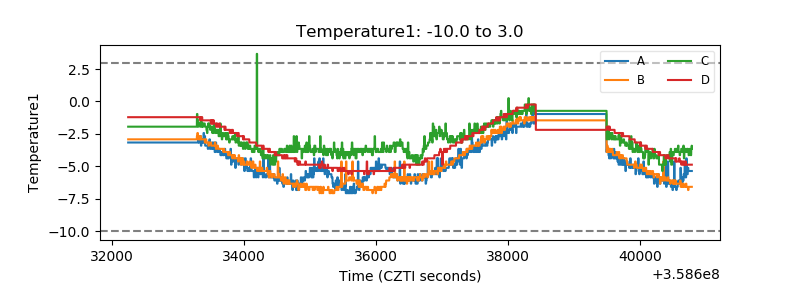 |
| Veto HV Monitor | 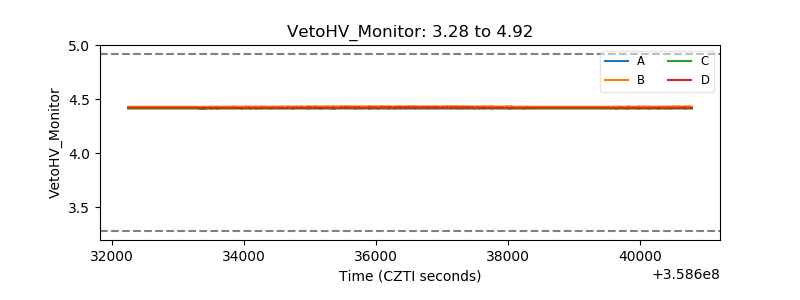 |
| Veto LLD | 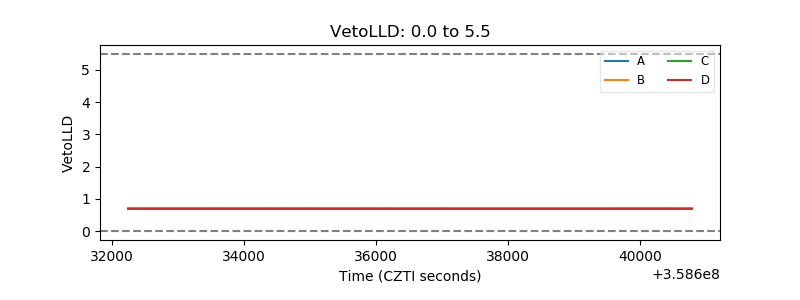 |
| Alpha Counter | 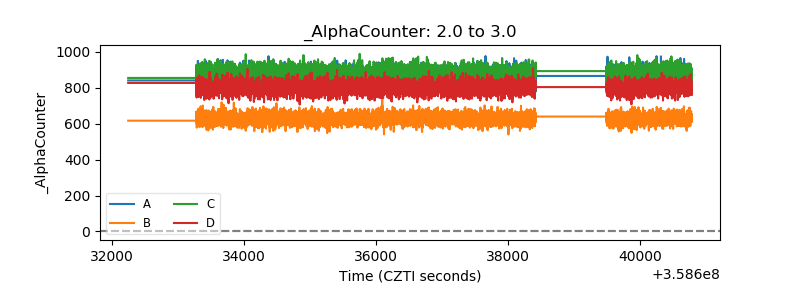 |
| _CPM_Rate | 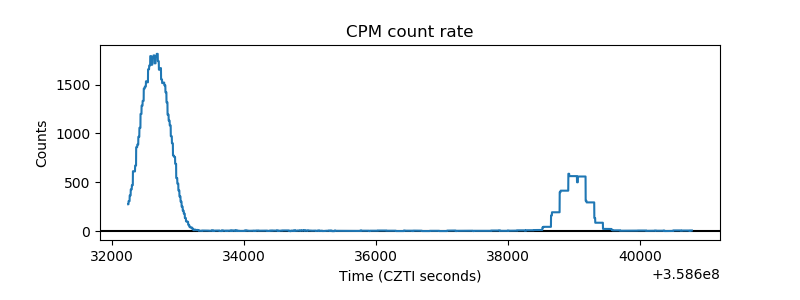 |
| CZT Counter | 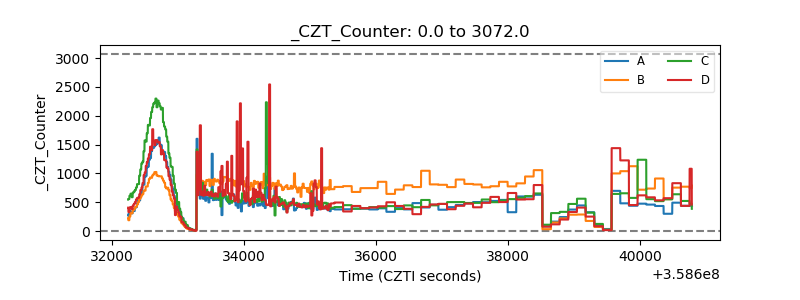 |
| +2.5 Volts monitor | 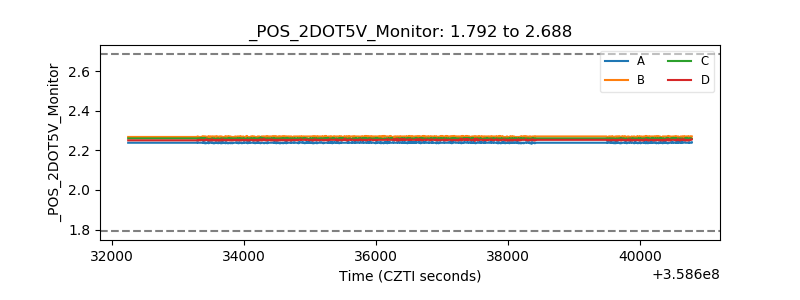 |
| +5 Volts monitor |  |
| _ROLL_ROT | 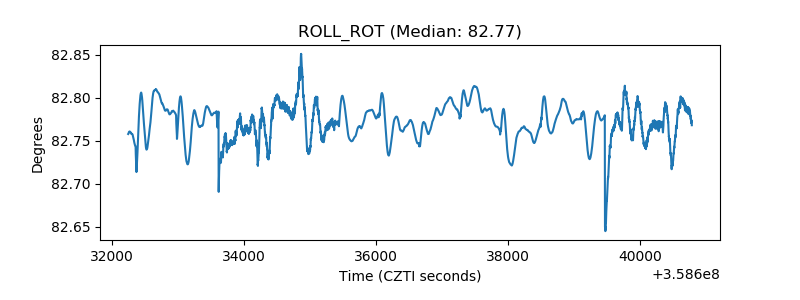 |
| _Roll_DEC | 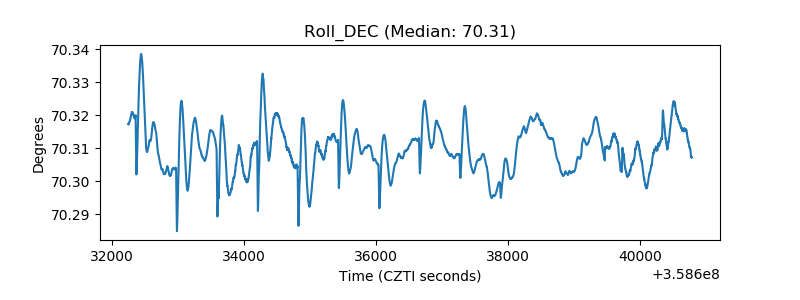 |
| _Roll_RA | 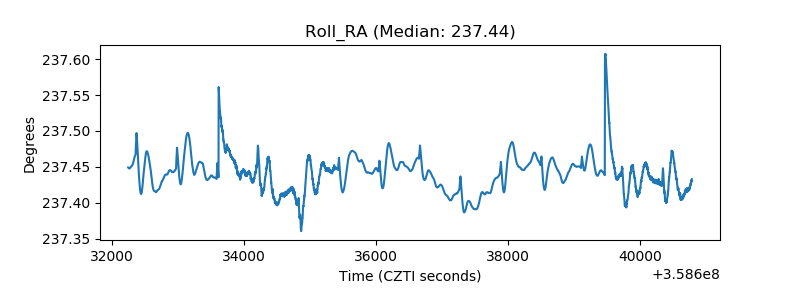 |
| Veto Counter | 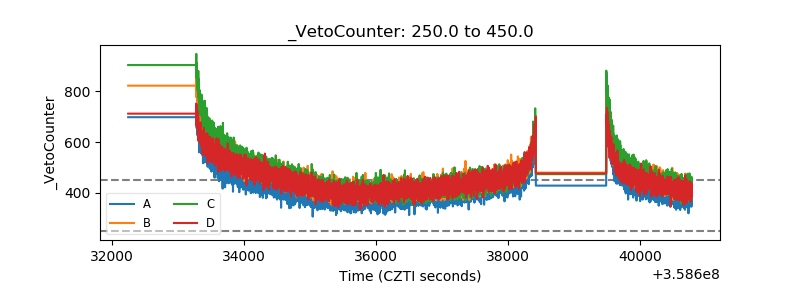 |