| Param | Original file | Final file |
|---|---|---|
| Filename | modeM0/AS1C05_019T04_9000004376_30415cztM0_level2.evt | modeM0/AS1C05_019T04_9000004376_30415cztM0_level2_quad_clean.evt |
| Size (bytes) | 551,404,800 | 112,466,880 |
| Size | 525.9 MB | 107.3 MB |
| Events in quadrant A | 3,373,674 | 739,943 |
| Events in quadrant B | 5,486,658 | 745,216 |
| Events in quadrant C | 3,579,908 | 728,876 |
| Events in quadrant D | 3,790,983 | 710,897 |
| Mode M9 | |||
|---|---|---|---|
| Quadrant | BADHDUFLAG | Total packets | Discarded packets |
| A | 0 | 13 | 0 |
| B | 0 | 14 | 0 |
| C | 0 | 14 | 0 |
| D | 0 | 14 | 0 |
| Mode SS | |||
|---|---|---|---|
| Quadrant | BADHDUFLAG | Total packets | Discarded packets |
| A | 0 | 140 | 0 |
| B | 0 | 140 | 0 |
| C | 0 | 140 | 0 |
| D | 0 | 140 | 0 |
| Mode M0 | |||
|---|---|---|---|
| Quadrant | BADHDUFLAG | Total packets | Discarded packets |
| A | 0 | 14721 | 2 |
| B | 0 | 21414 | 2 |
| C | 0 | 15114 | 2 |
| D | 0 | 15881 | 2 |
| Quadrant | Total seconds | Saturated seconds | Saturation percentage |
|---|---|---|---|
| A | 6906 | 133 | 1.925862% |
| B | 6906 | 162 | 2.345786% |
| C | 6906 | 272 | 3.938604% |
| D | 6906 | 162 | 2.345786% |
Noise dominated data is calculated using 1-second bins in cleaned event files. If a bin has >2000 counts, and if more than 50% of those come from <1% of pixels, then it is considered to be noise-dominated and hence unusable.
| Quadrant | # 1 sec bins | Bins with >0 counts | Bins with >2000 counts | High rate bins dominated by noise | Noise dominated (total time) | Noise dominated (detector-on time) | Marked lightcurve |
|---|---|---|---|---|---|---|---|
| A | 7611 | 6906 | 14 | 14 | 0.18% | 0.20% | 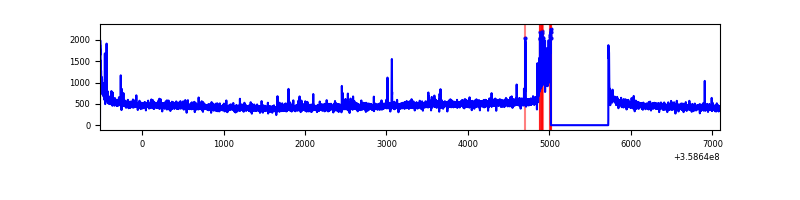 |
| B | 7611 | 6906 | 7 | 7 | 0.09% | 0.10% | 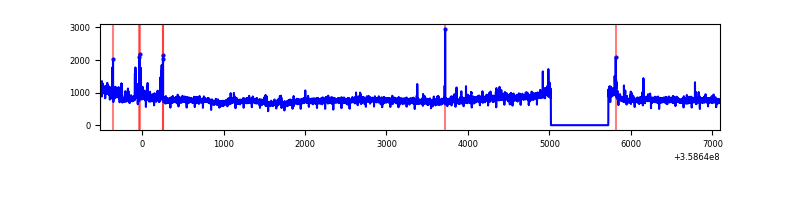 |
| C | 7611 | 6906 | 17 | 17 | 0.22% | 0.25% | 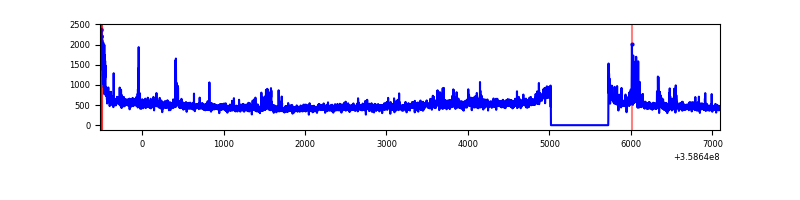 |
| D | 7611 | 6907 | 80 | 80 | 1.05% | 1.16% | 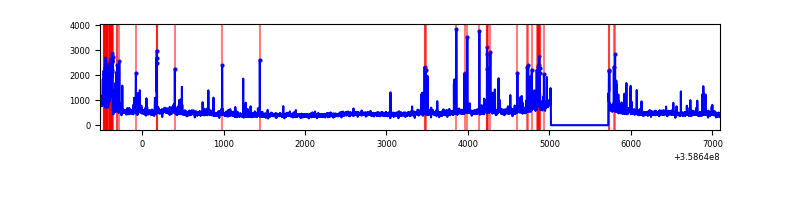 |
Top three noisy pixels from each quadrant. If the there are fewer than three noisy pixels in the level2.evt file, extra rows are filled as -1
| Pixel properties | Quadrant properties | ||||||
|---|---|---|---|---|---|---|---|
| Quadrant | DetID | PixID | Counts | Sigma | Mean | Median | Sigma |
| A | 14 | 239 | 132920 | 802.0 | 821 | 801 | 164.7 |
| A | 0 | 13 | 48784 | 291.27 | 821 | 801 | 164.7 |
| A | 8 | 192 | 23930 | 140.4 | 821 | 801 | 164.7 |
| B | 6 | 159 | 2024072 | 12928.37 | 824 | 802 | 156.5 |
| B | 0 | 229 | 145367 | 923.75 | 824 | 802 | 156.5 |
| B | 4 | 80 | 39699 | 248.55 | 824 | 802 | 156.5 |
| C | 14 | 238 | 191613 | 1026.88 | 799 | 802 | 185.8 |
| C | 0 | 10 | 85335 | 454.93 | 799 | 802 | 185.8 |
| C | 14 | 254 | 85228 | 454.35 | 799 | 802 | 185.8 |
| D | 8 | 195 | 251526 | 1307.04 | 801 | 778 | 191.8 |
| D | 13 | 138 | 162990 | 845.54 | 801 | 778 | 191.8 |
| D | 13 | 249 | 118366 | 612.93 | 801 | 778 | 191.8 |
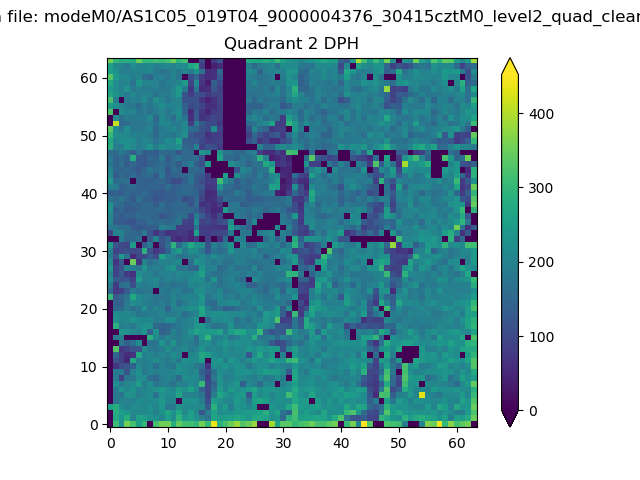
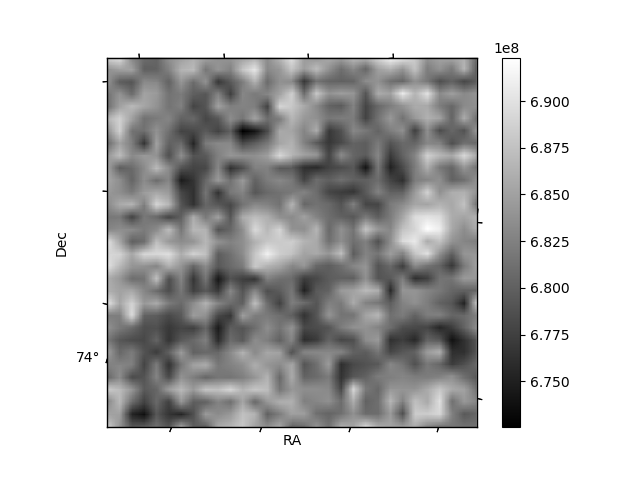
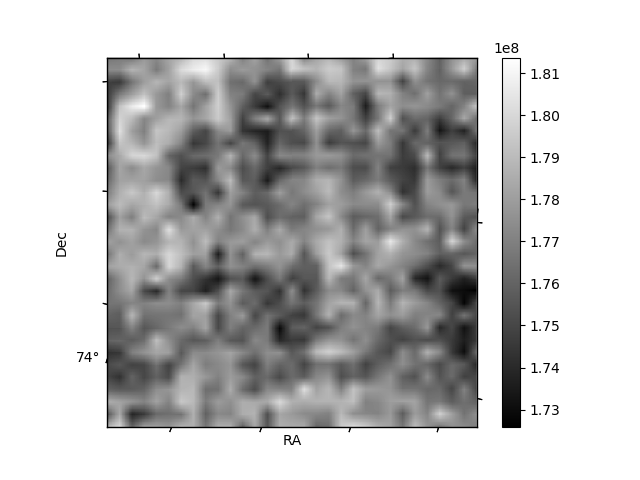
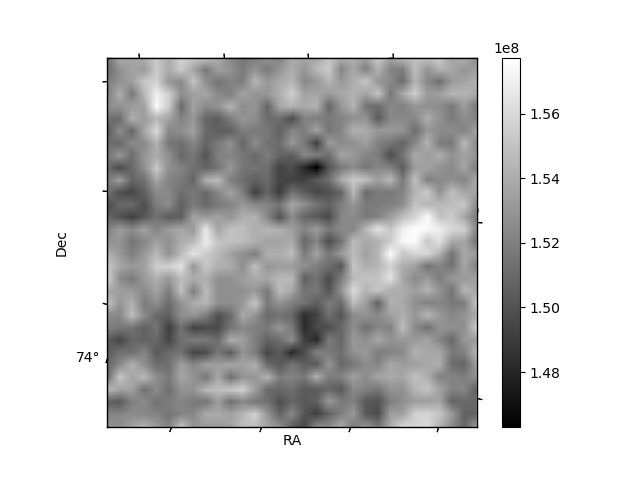
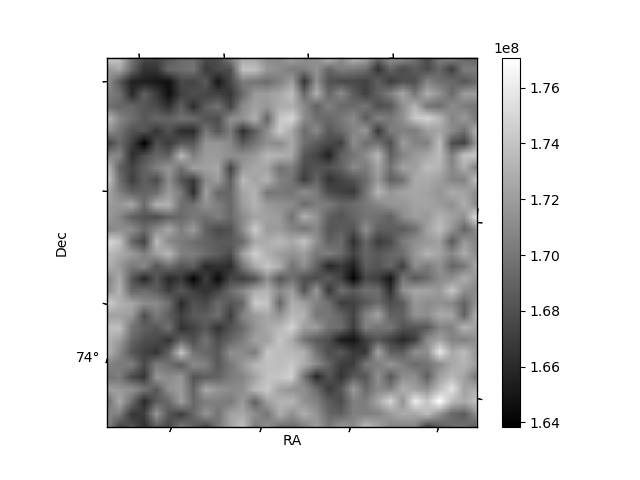
Histogram calculated using DETX and DETY for each event in the final _common_clean file
| Quadrant A | 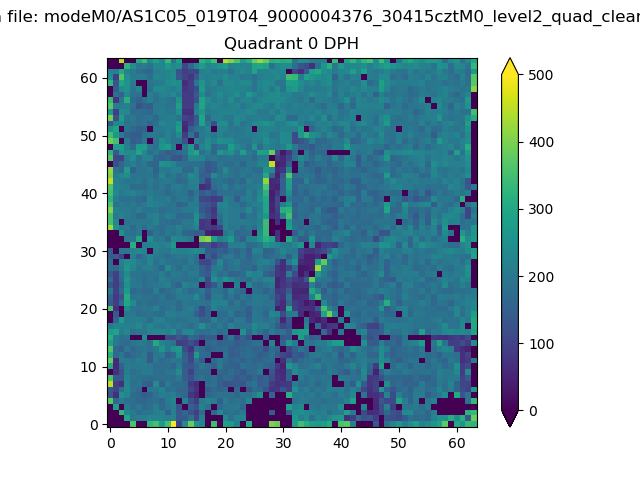 |
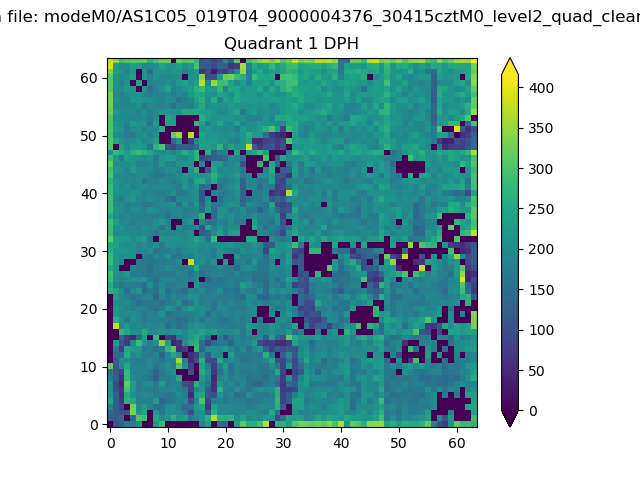 |
Quadrant B |
|---|---|---|---|
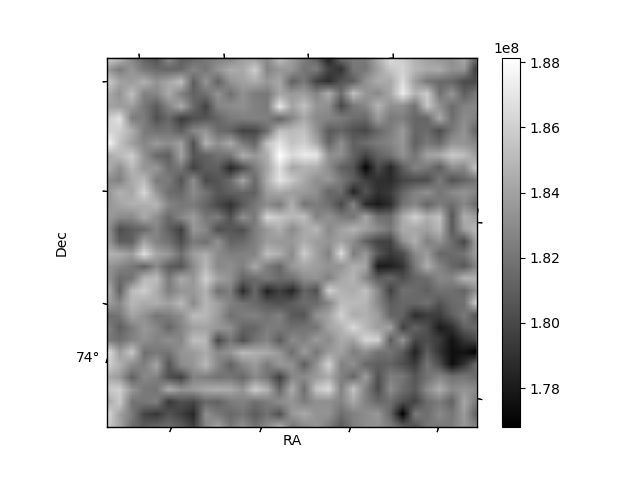
| Quadrant D | 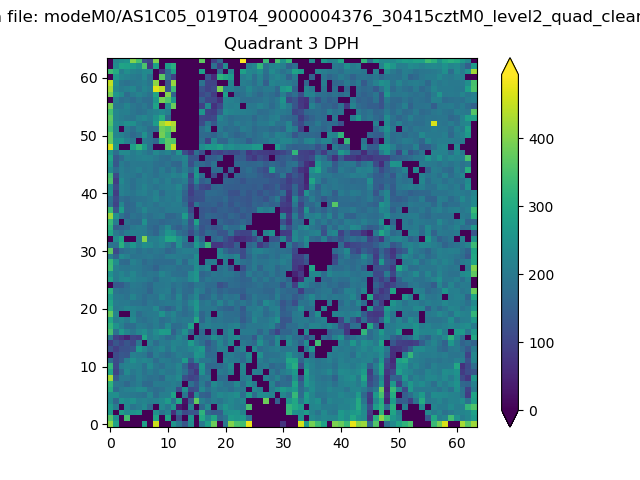 |
 |
Quadrant C |
| Plot type | Count rate plots | Images |
|---|---|---|
| Comparison with Poisson distribution Blue bars denote a histogram of data divided into 1 sec bins. Red curve is a Poisson curve with rate = median count rate of data. |
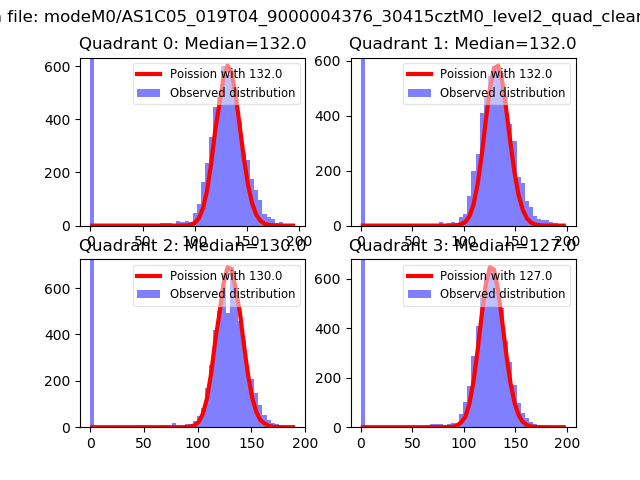 |
 |
| Quadrant-wise count rates Data is divided into 100 sec bins |
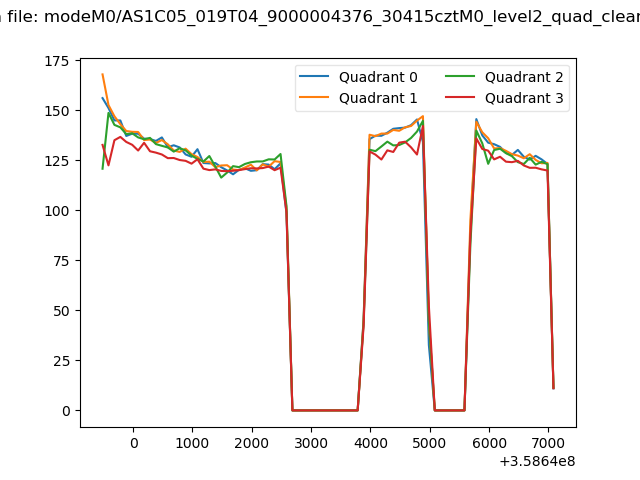 |
|
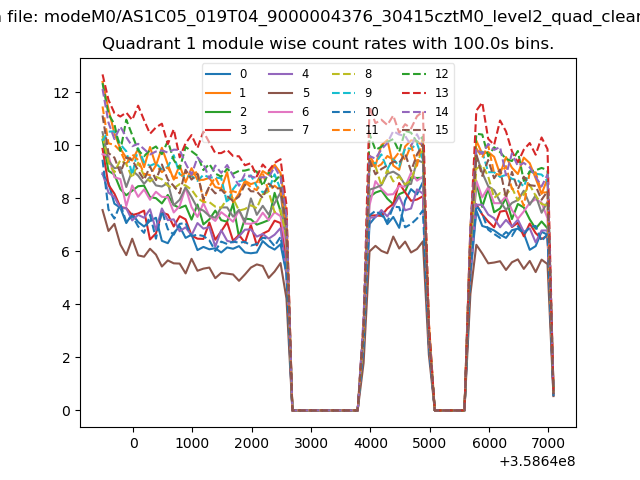
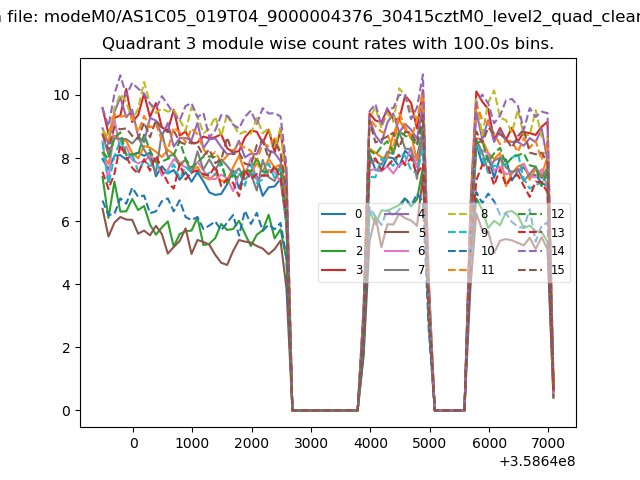
| Module-wise count rates for Quadrant A Data is divided into 100 sec bins |
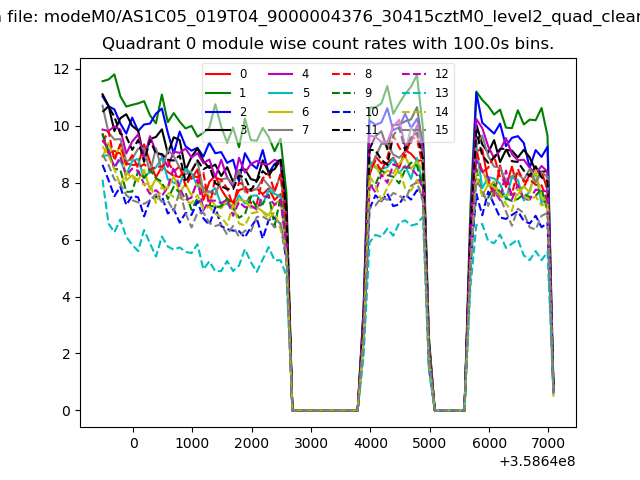 |
 |
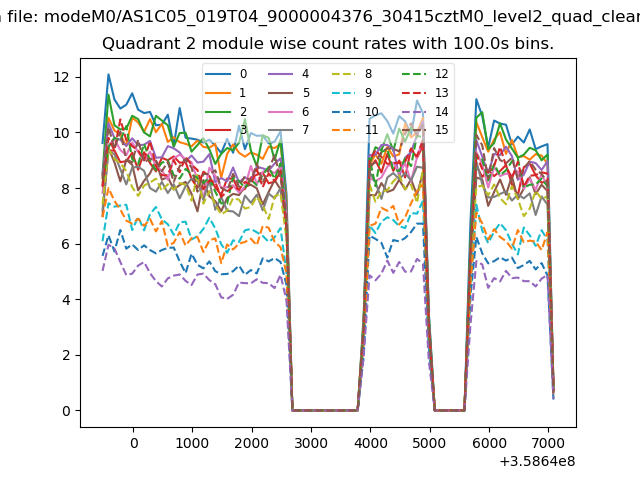
| Module-wise count rates for Quadrant B Data is divided into 100 sec bins |
 |
 |
| Module-wise count rates for Quadrant C Data is divided into 100 sec bins |
 |
 |
| Module-wise count rates for Quadrant D Data is divided into 100 sec bins |
 |
 |
| Parameter | Plot |
|---|---|
| CZT HV Monitor | 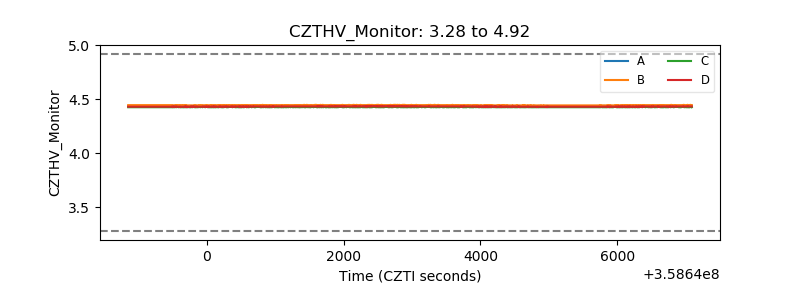 |
| D_VDD | 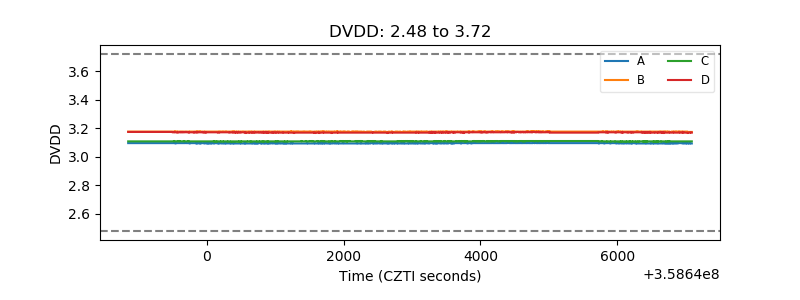 |
| Temperature 1 | 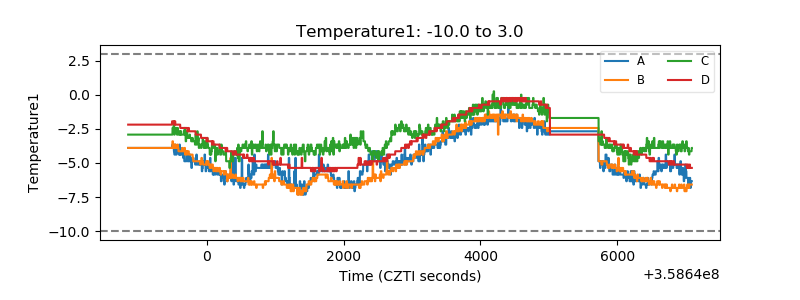 |
| Veto HV Monitor | 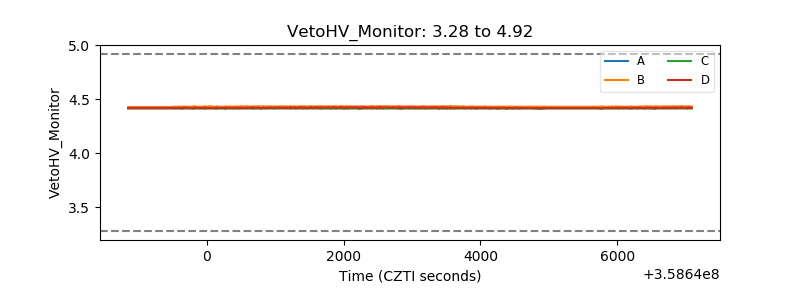 |
| Veto LLD | 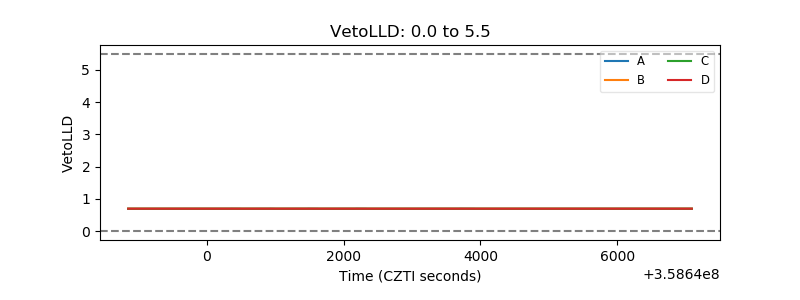 |
| Alpha Counter | 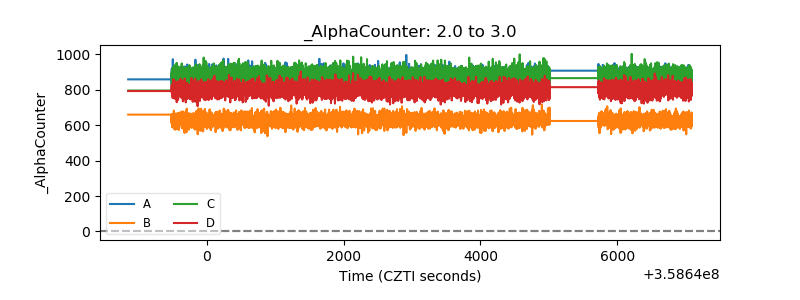 |
| _CPM_Rate | 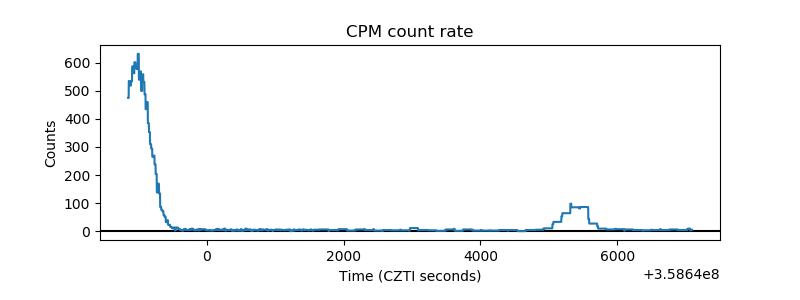 |
| CZT Counter | 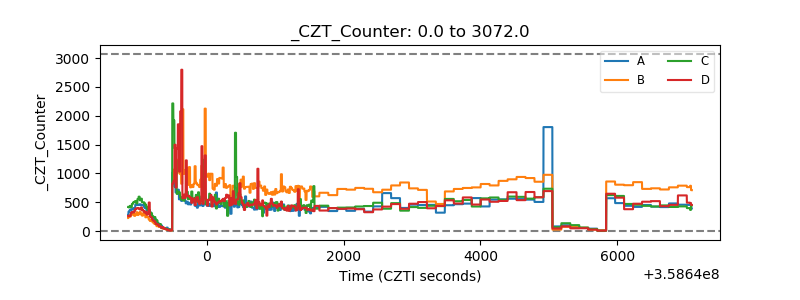 |
| +2.5 Volts monitor |  |
| +5 Volts monitor |  |
| _ROLL_ROT | 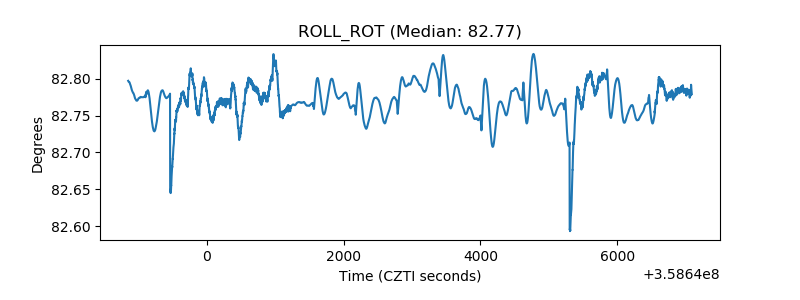 |
| _Roll_DEC | 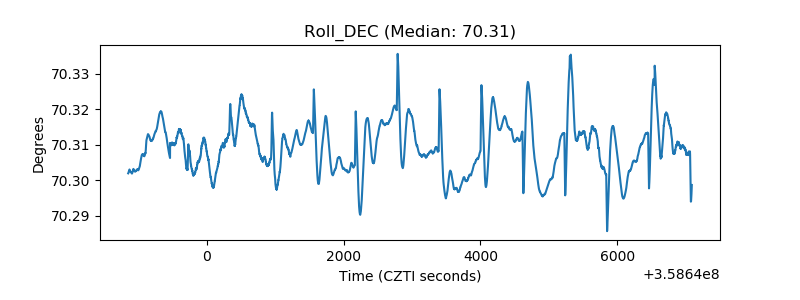 |
| _Roll_RA | 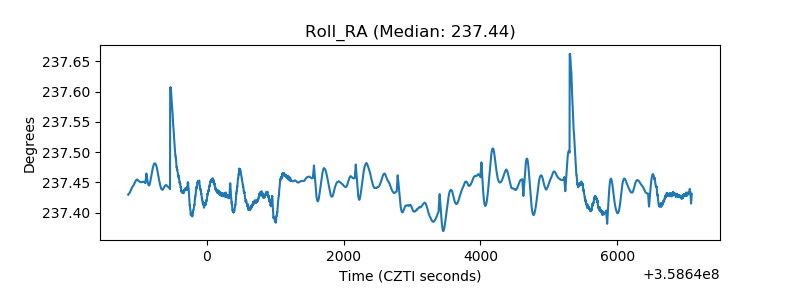 |
| Veto Counter | 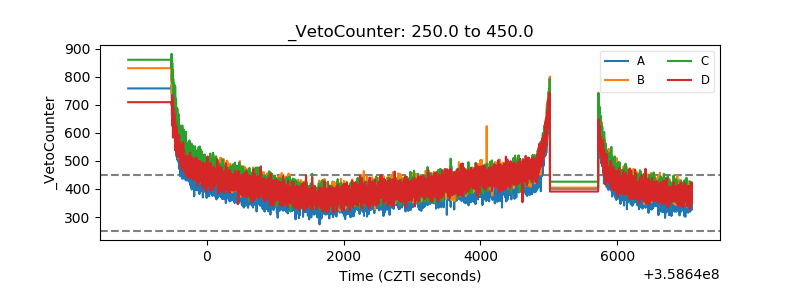 |