| Param | Original file | Final file |
|---|---|---|
| Filename | modeM0/AS1C05_019T04_9000004376_30417cztM0_level2.evt | modeM0/AS1C05_019T04_9000004376_30417cztM0_level2_quad_clean.evt |
| Size (bytes) | 700,090,560 | 115,156,800 |
| Size | 667.7 MB | 109.8 MB |
| Events in quadrant A | 4,704,170 | 755,534 |
| Events in quadrant B | 5,715,556 | 769,134 |
| Events in quadrant C | 3,597,742 | 761,963 |
| Events in quadrant D | 6,685,343 | 686,121 |
| Mode M9 | |||
|---|---|---|---|
| Quadrant | BADHDUFLAG | Total packets | Discarded packets |
| A | 0 | 2 | 0 |
| B | 0 | 2 | 0 |
| C | 0 | 2 | 0 |
| D | 0 | 2 | 0 |
| Mode SS | |||
|---|---|---|---|
| Quadrant | BADHDUFLAG | Total packets | Discarded packets |
| A | 0 | 148 | 0 |
| B | 0 | 148 | 0 |
| C | 0 | 148 | 0 |
| D | 0 | 148 | 0 |
| Mode M0 | |||
|---|---|---|---|
| Quadrant | BADHDUFLAG | Total packets | Discarded packets |
| A | 0 | 18960 | 1 |
| B | 0 | 22447 | 1 |
| C | 0 | 15616 | 1 |
| D | 0 | 25276 | 1 |
| Quadrant | Total seconds | Saturated seconds | Saturation percentage |
|---|---|---|---|
| A | 7396 | 283 | 3.826393% |
| B | 7397 | 179 | 2.419900% |
| C | 7397 | 107 | 1.446532% |
| D | 7397 | 1077 | 14.559957% |
Noise dominated data is calculated using 1-second bins in cleaned event files. If a bin has >2000 counts, and if more than 50% of those come from <1% of pixels, then it is considered to be noise-dominated and hence unusable.
| Quadrant | # 1 sec bins | Bins with >0 counts | Bins with >2000 counts | High rate bins dominated by noise | Noise dominated (total time) | Noise dominated (detector-on time) | Marked lightcurve |
|---|---|---|---|---|---|---|---|
| A | 7576 | 7397 | 198 | 198 | 2.61% | 2.68% | 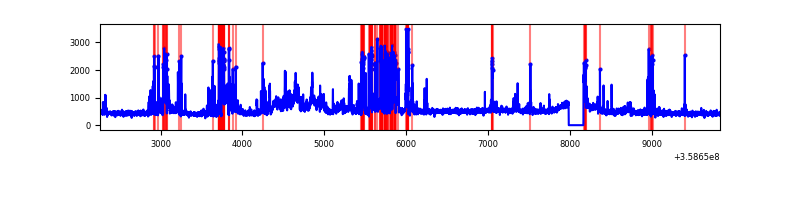 |
| B | 7577 | 7397 | 4 | 4 | 0.05% | 0.05% | 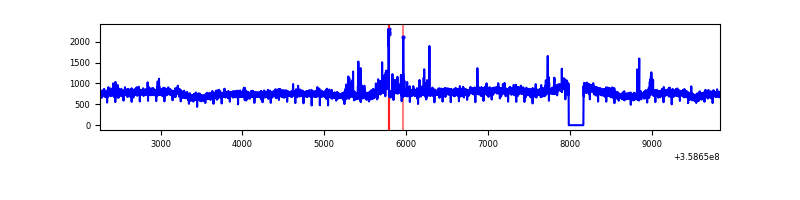 |
| C | 7577 | 7397 | 3 | 3 | 0.04% | 0.04% | 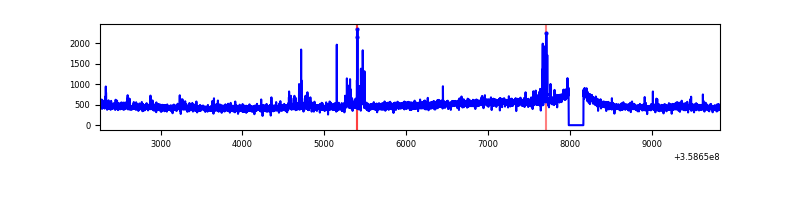 |
| D | 7577 | 7397 | 734 | 734 | 9.69% | 9.92% | 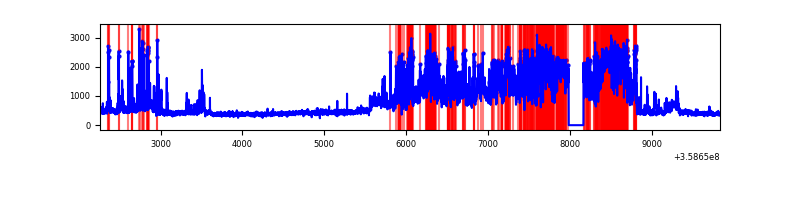 |
Top three noisy pixels from each quadrant. If the there are fewer than three noisy pixels in the level2.evt file, extra rows are filled as -1
| Pixel properties | Quadrant properties | ||||||
|---|---|---|---|---|---|---|---|
| Quadrant | DetID | PixID | Counts | Sigma | Mean | Median | Sigma |
| A | 14 | 239 | 1154130 | 6775.51 | 850 | 832 | 170.2 |
| A | 0 | 13 | 198163 | 1159.3 | 850 | 832 | 170.2 |
| A | 12 | 96 | 64147 | 371.97 | 850 | 832 | 170.2 |
| B | 6 | 159 | 2174472 | 13178.0 | 857 | 833 | 164.9 |
| B | 0 | 229 | 106516 | 640.72 | 857 | 833 | 164.9 |
| B | 4 | 80 | 33722 | 199.39 | 857 | 833 | 164.9 |
| C | 14 | 238 | 141576 | 723.68 | 835 | 839 | 194.5 |
| C | 10 | 22 | 103231 | 526.51 | 835 | 839 | 194.5 |
| C | 3 | 233 | 62556 | 317.35 | 835 | 839 | 194.5 |
| D | 13 | 104 | 3101474 | 15491.21 | 781 | 763 | 200.2 |
| D | 13 | 249 | 237139 | 1180.94 | 781 | 763 | 200.2 |
| D | 8 | 195 | 211360 | 1052.14 | 781 | 763 | 200.2 |
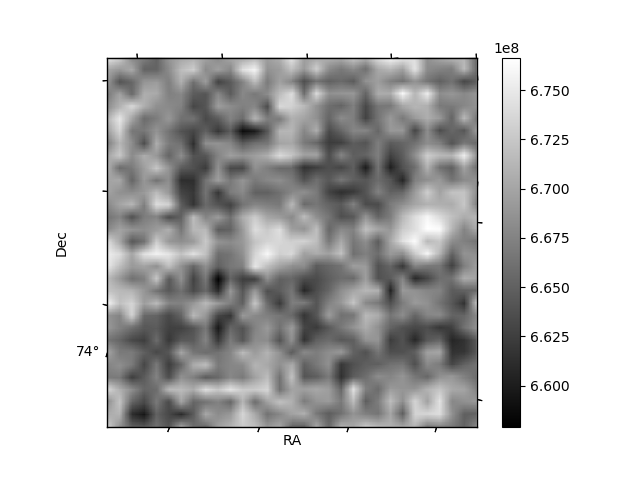
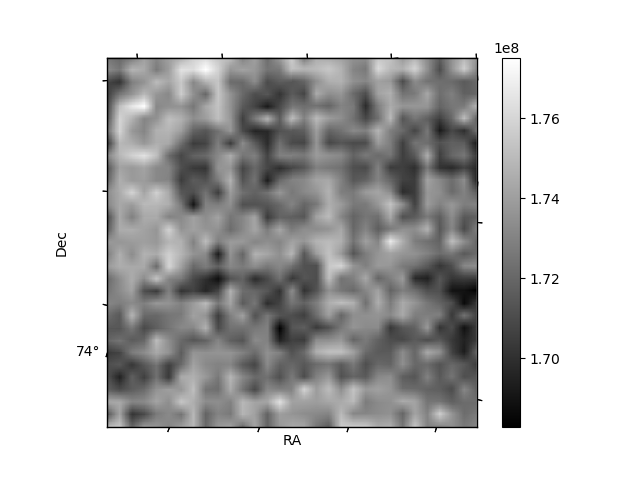
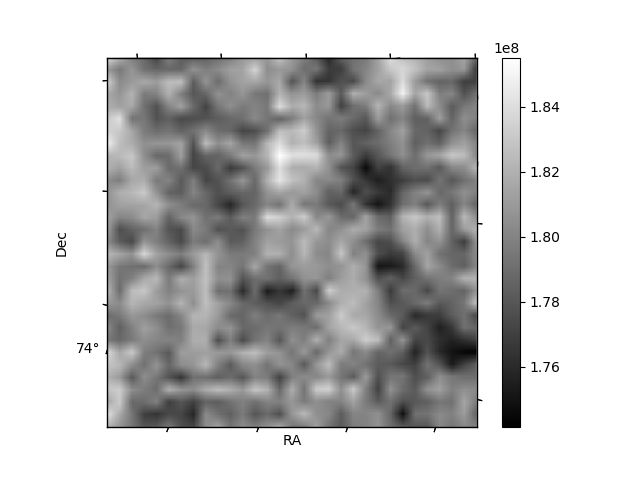
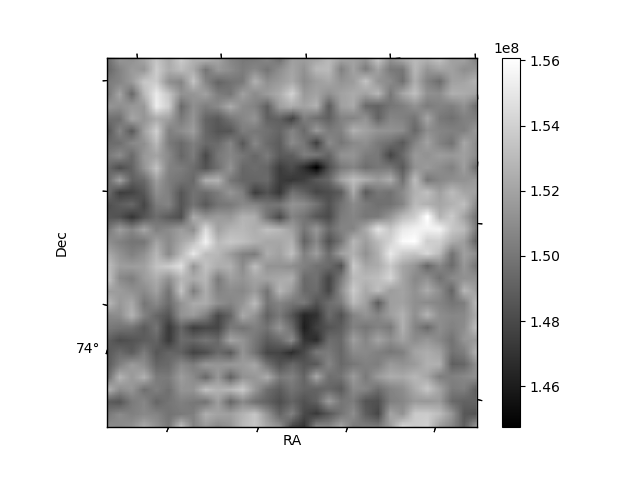
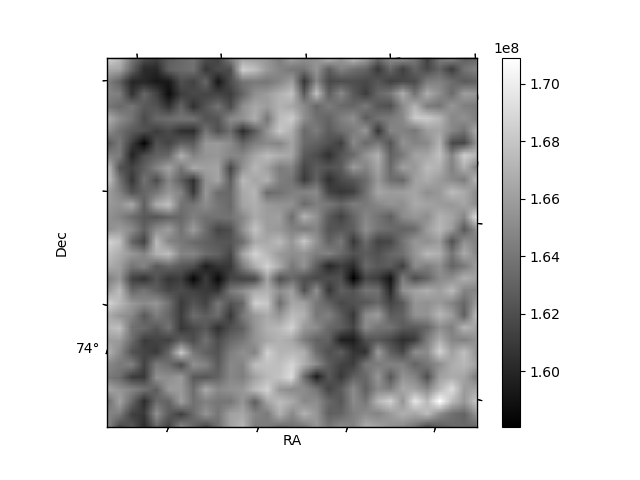
Histogram calculated using DETX and DETY for each event in the final _common_clean file
| Quadrant A | 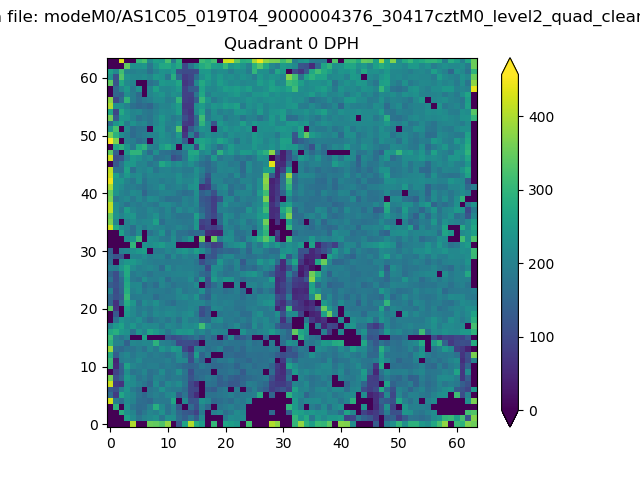 |
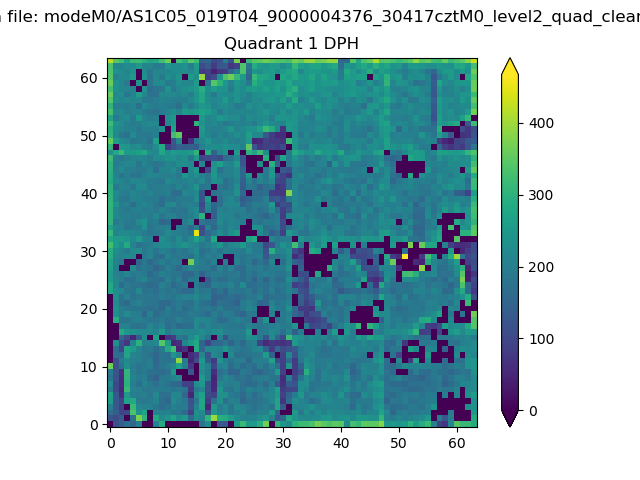 |
Quadrant B |
|---|---|---|---|
| Quadrant D | 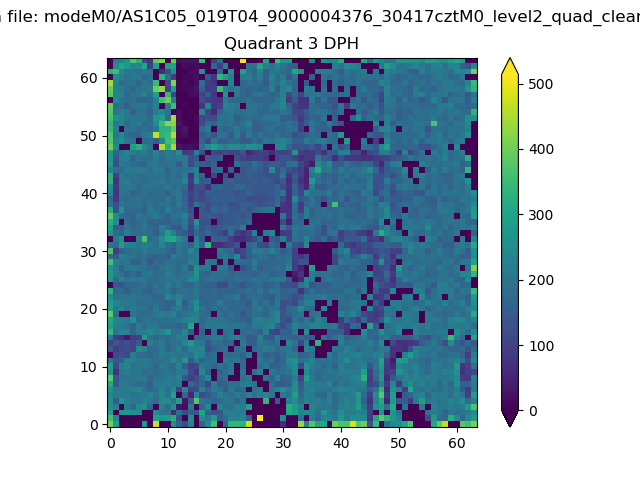 |
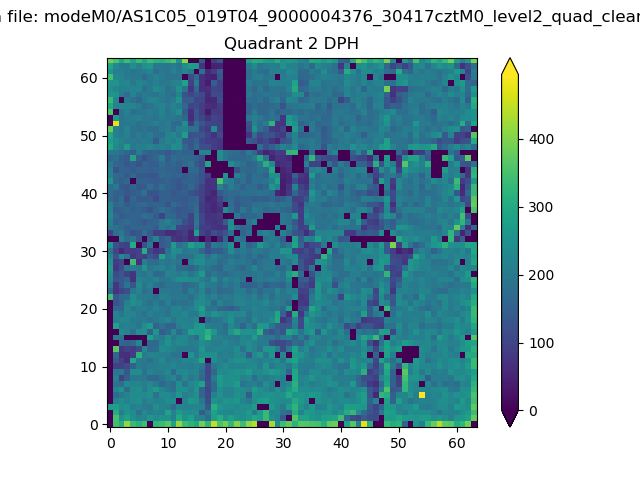 |
Quadrant C |
| Plot type | Count rate plots | Images |
|---|---|---|
| Comparison with Poisson distribution Blue bars denote a histogram of data divided into 1 sec bins. Red curve is a Poisson curve with rate = median count rate of data. |
 |
 |
| Quadrant-wise count rates Data is divided into 100 sec bins |
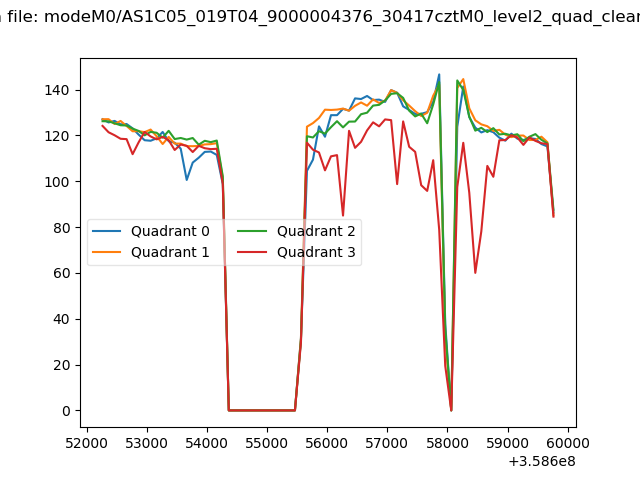 |
|
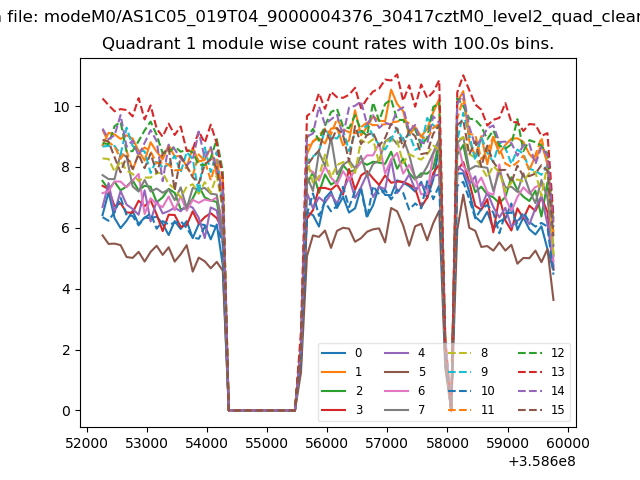
| Module-wise count rates for Quadrant A Data is divided into 100 sec bins |
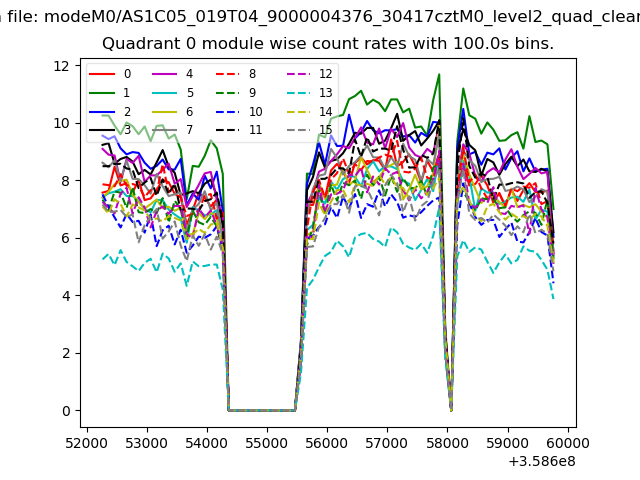 |
 |
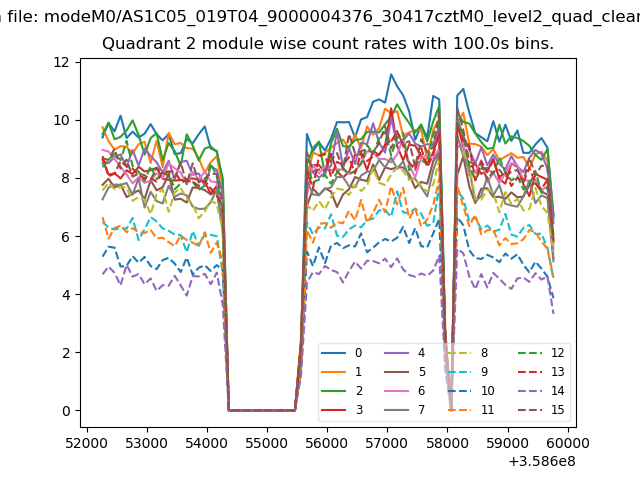
| Module-wise count rates for Quadrant B Data is divided into 100 sec bins |
 |
 |
| Module-wise count rates for Quadrant C Data is divided into 100 sec bins |
 |
 |
| Module-wise count rates for Quadrant D Data is divided into 100 sec bins |
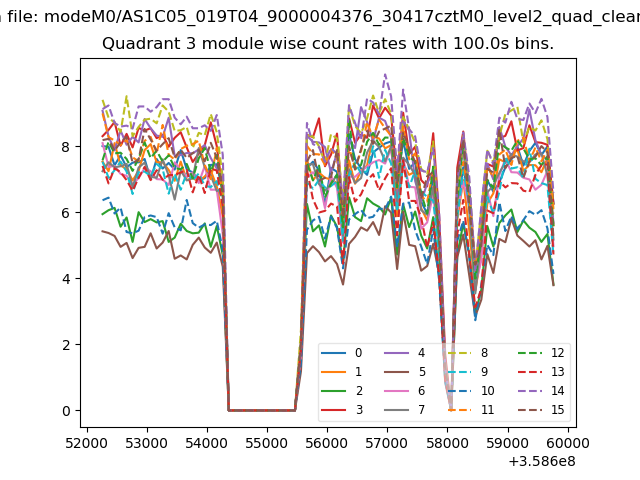 |
 |
| Parameter | Plot |
|---|---|
| CZT HV Monitor | 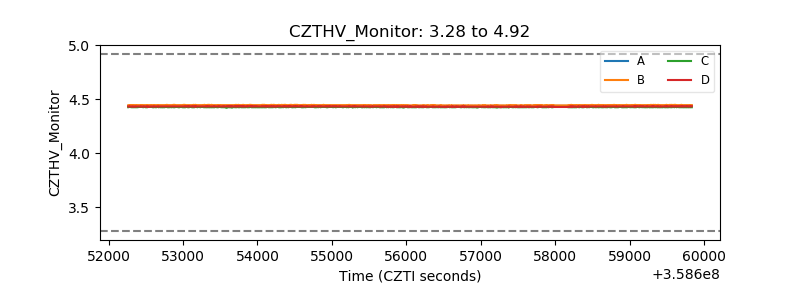 |
| D_VDD | 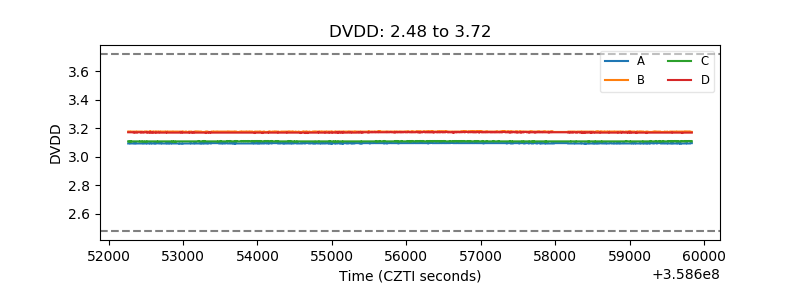 |
| Temperature 1 | 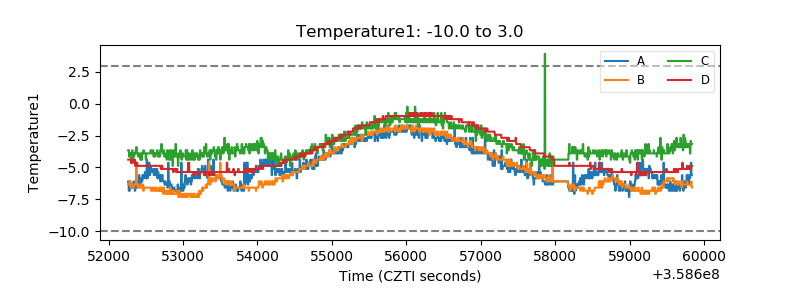 |
| Veto HV Monitor | 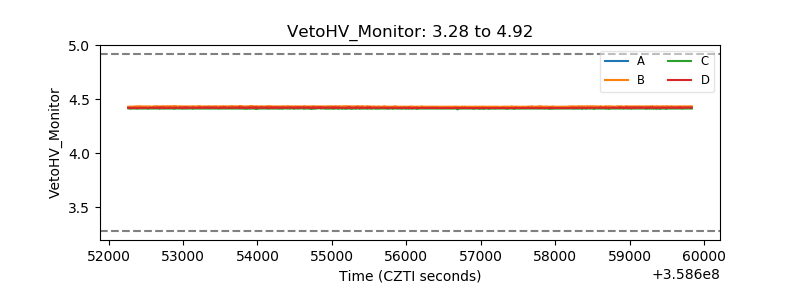 |
| Veto LLD | 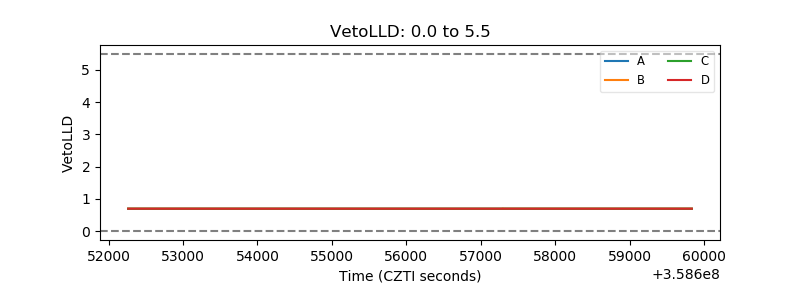 |
| Alpha Counter | 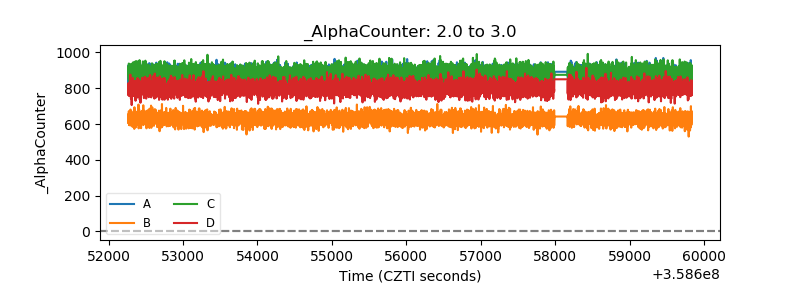 |
| _CPM_Rate | 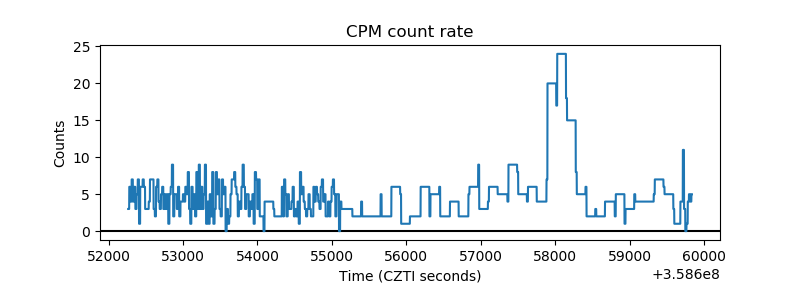 |
| CZT Counter | 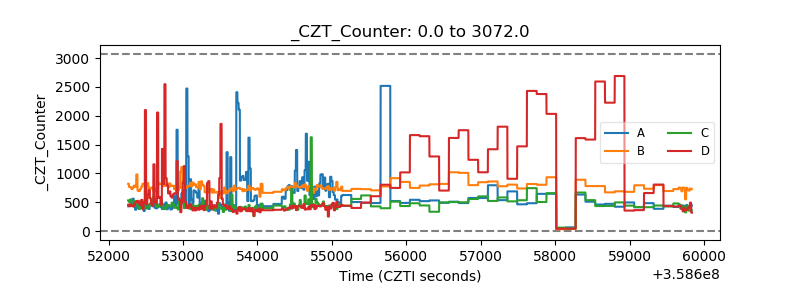 |
| +2.5 Volts monitor | 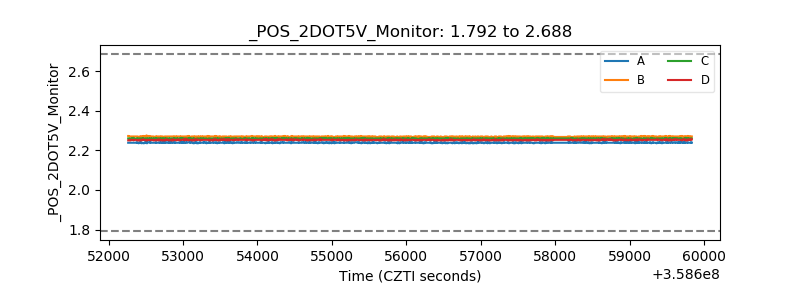 |
| +5 Volts monitor |  |
| _ROLL_ROT | 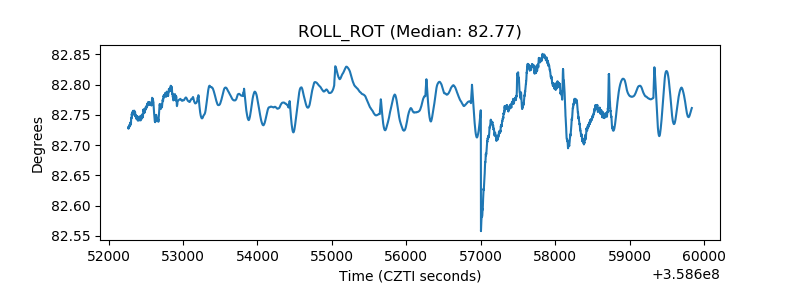 |
| _Roll_DEC | 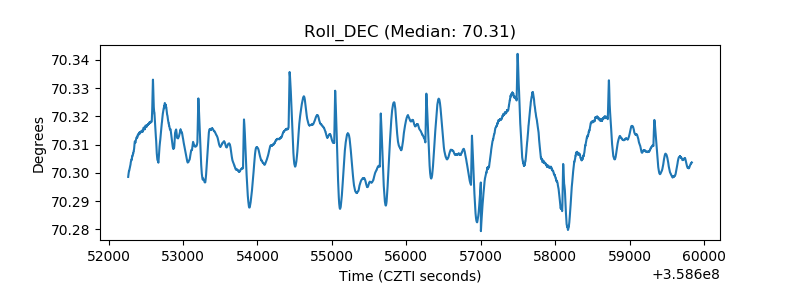 |
| _Roll_RA | 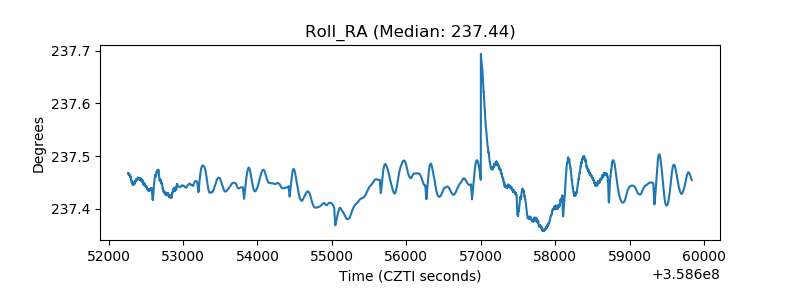 |
| Veto Counter | 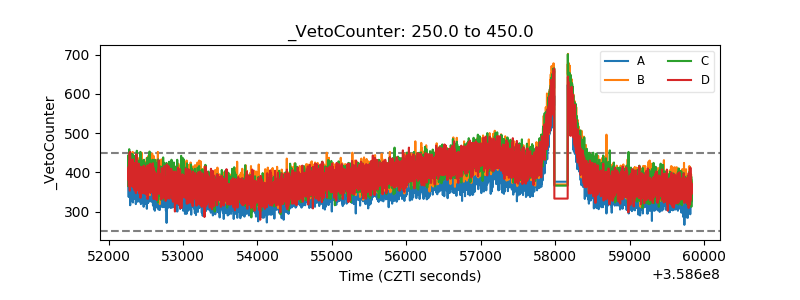 |