| Param | Original file | Final file |
|---|---|---|
| Filename | modeM0/AS1C05_019T04_9000004376_30420cztM0_level2.evt | modeM0/AS1C05_019T04_9000004376_30420cztM0_level2_quad_clean.evt |
| Size (bytes) | 1,531,457,280 | 268,058,880 |
| Size | 1.4 GB | 255.6 MB |
| Events in quadrant A | 8,856,414 | 1,747,907 |
| Events in quadrant B | 14,309,920 | 1,746,986 |
| Events in quadrant C | 9,047,817 | 1,713,032 |
| Events in quadrant D | 12,899,349 | 1,616,141 |
| Mode M9 | |||
|---|---|---|---|
| Quadrant | BADHDUFLAG | Total packets | Discarded packets |
| A | 0 | 18 | 0 |
| B | 0 | 18 | 0 |
| C | 0 | 18 | 0 |
| D | 0 | 18 | 0 |
| Mode SS | |||
|---|---|---|---|
| Quadrant | BADHDUFLAG | Total packets | Discarded packets |
| A | 0 | 380 | 0 |
| B | 0 | 380 | 0 |
| C | 0 | 380 | 0 |
| D | 0 | 380 | 0 |
| Mode M0 | |||
|---|---|---|---|
| Quadrant | BADHDUFLAG | Total packets | Discarded packets |
| A | 0 | 38641 | 3 |
| B | 0 | 56817 | 3 |
| C | 0 | 38839 | 4 |
| D | 0 | 50921 | 3 |
| Quadrant | Total seconds | Saturated seconds | Saturation percentage |
|---|---|---|---|
| A | 18791 | 164 | 0.872758% |
| B | 18792 | 291 | 1.548531% |
| C | 18791 | 244 | 1.298494% |
| D | 18791 | 1367 | 7.274759% |
Noise dominated data is calculated using 1-second bins in cleaned event files. If a bin has >2000 counts, and if more than 50% of those come from <1% of pixels, then it is considered to be noise-dominated and hence unusable.
| Quadrant | # 1 sec bins | Bins with >0 counts | Bins with >2000 counts | High rate bins dominated by noise | Noise dominated (total time) | Noise dominated (detector-on time) | Marked lightcurve |
|---|---|---|---|---|---|---|---|
| A | 20466 | 18792 | 16 | 16 | 0.08% | 0.09% | 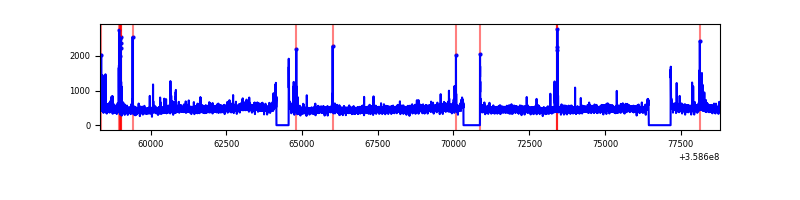 |
| B | 20467 | 18792 | 17 | 17 | 0.08% | 0.09% | 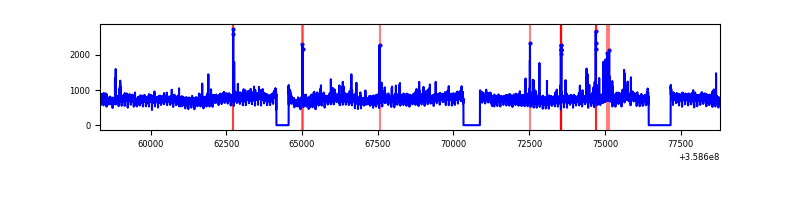 |
| C | 20466 | 18792 | 9 | 9 | 0.04% | 0.05% | 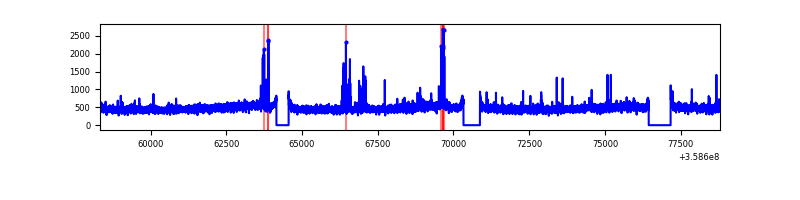 |
| D | 20466 | 18791 | 1023 | 1023 | 5.00% | 5.44% | 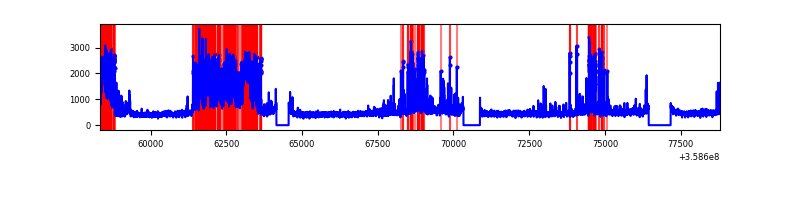 |
Top three noisy pixels from each quadrant. If the there are fewer than three noisy pixels in the level2.evt file, extra rows are filled as -1
| Pixel properties | Quadrant properties | ||||||
|---|---|---|---|---|---|---|---|
| Quadrant | DetID | PixID | Counts | Sigma | Mean | Median | Sigma |
| A | 0 | 13 | 144229 | 322.12 | 2206 | 2160 | 441.0 |
| A | 14 | 239 | 143393 | 320.23 | 2206 | 2160 | 441.0 |
| A | 13 | 254 | 35507 | 75.61 | 2206 | 2160 | 441.0 |
| B | 6 | 159 | 5261411 | 12689.19 | 2184 | 2124 | 414.5 |
| B | 4 | 80 | 202984 | 484.62 | 2184 | 2124 | 414.5 |
| B | 0 | 229 | 120376 | 285.31 | 2184 | 2124 | 414.5 |
| C | 14 | 238 | 349367 | 704.66 | 2124 | 2133 | 492.8 |
| C | 10 | 22 | 200353 | 402.26 | 2124 | 2133 | 492.8 |
| C | 3 | 233 | 178888 | 358.7 | 2124 | 2133 | 492.8 |
| D | 13 | 104 | 2734389 | 5138.7 | 2065 | 2026 | 531.7 |
| D | 13 | 249 | 1298697 | 2438.62 | 2065 | 2026 | 531.7 |
| D | 8 | 195 | 663419 | 1243.87 | 2065 | 2026 | 531.7 |
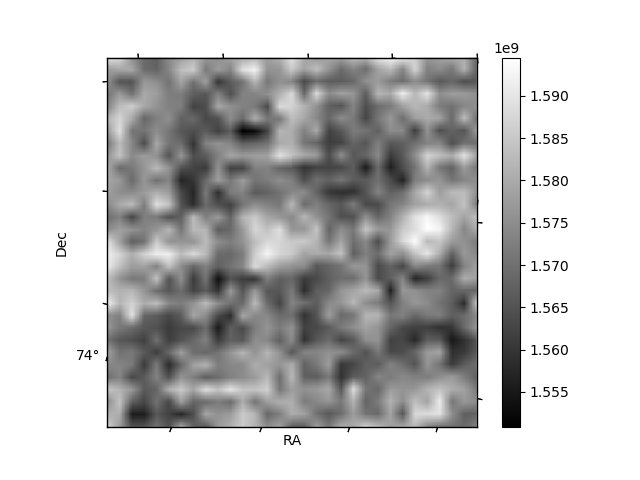
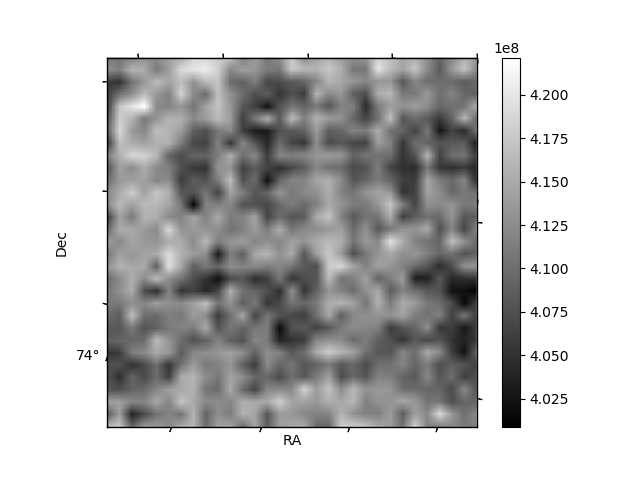
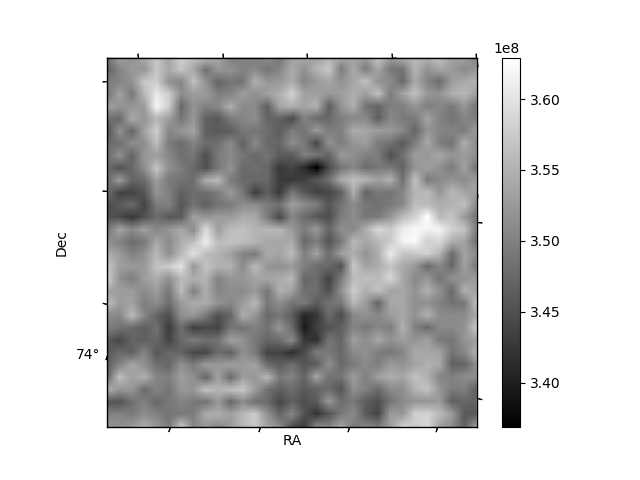
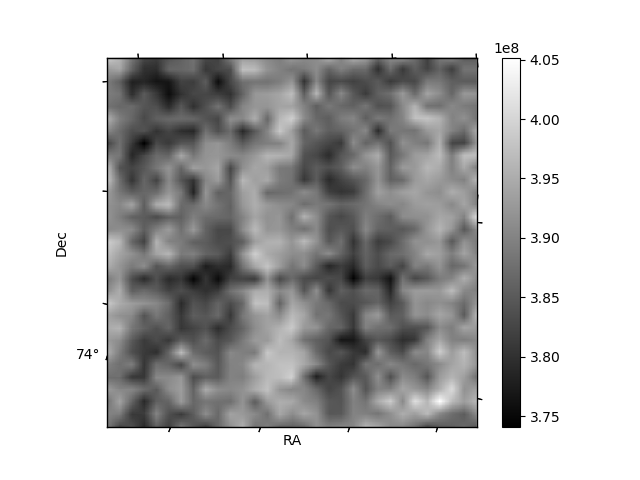
Histogram calculated using DETX and DETY for each event in the final _common_clean file
| Quadrant A | 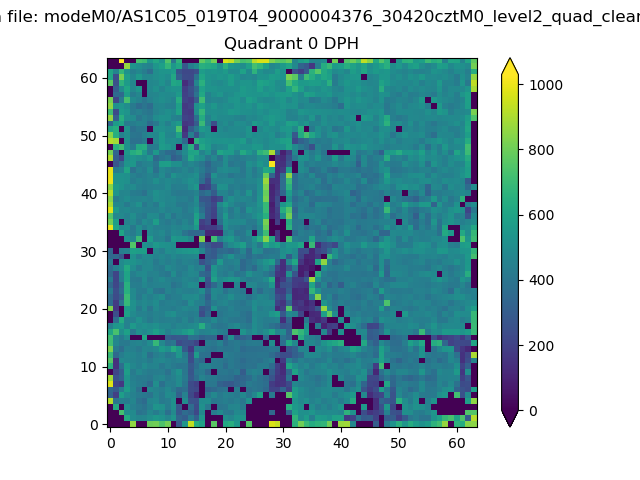 |
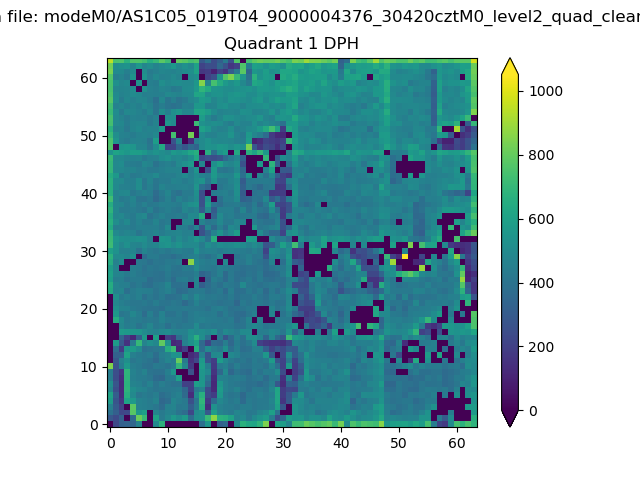 |
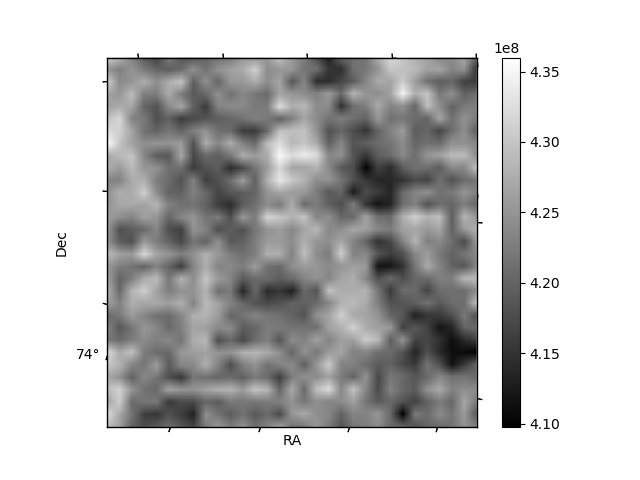
Quadrant B |
|---|---|---|---|
| Quadrant D | 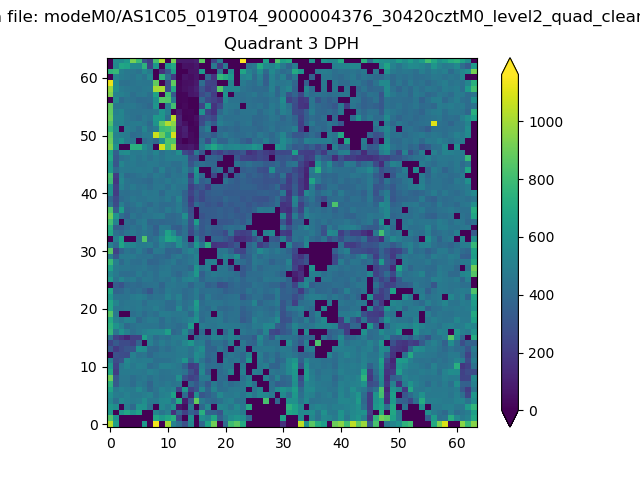 |
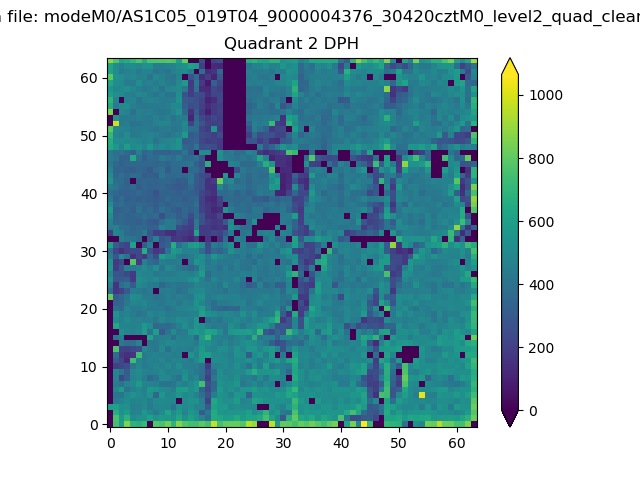 |
Quadrant C |
| Plot type | Count rate plots | Images |
|---|---|---|
| Comparison with Poisson distribution Blue bars denote a histogram of data divided into 1 sec bins. Red curve is a Poisson curve with rate = median count rate of data. |
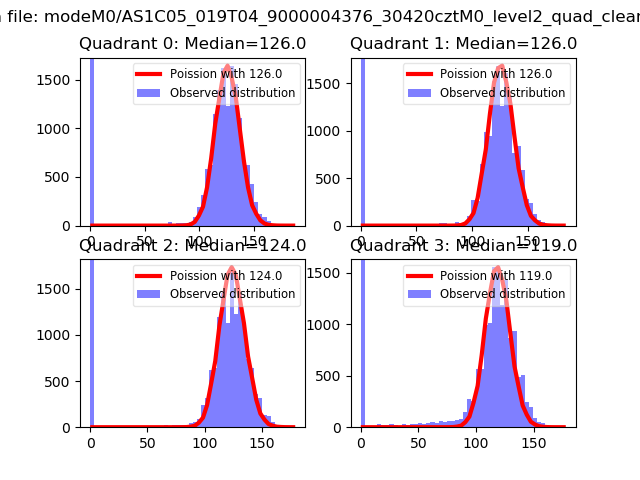 |
 |
| Quadrant-wise count rates Data is divided into 100 sec bins |
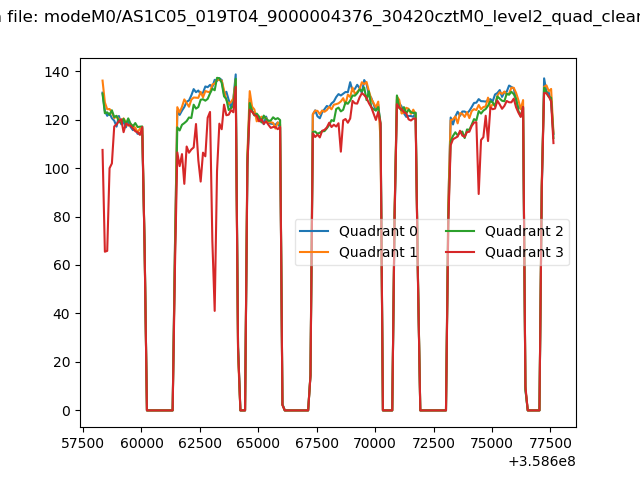 |
|
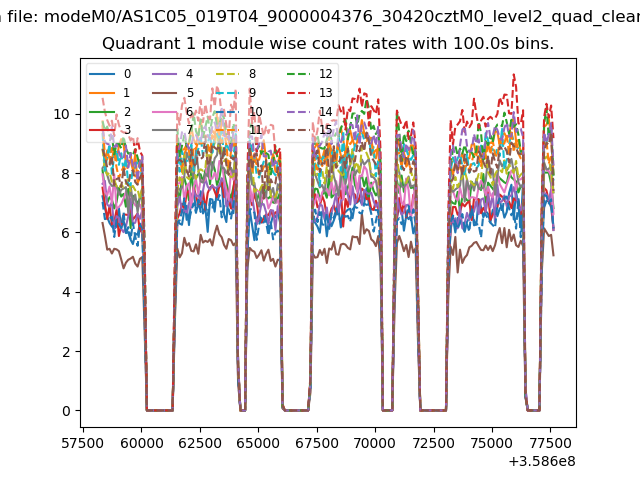
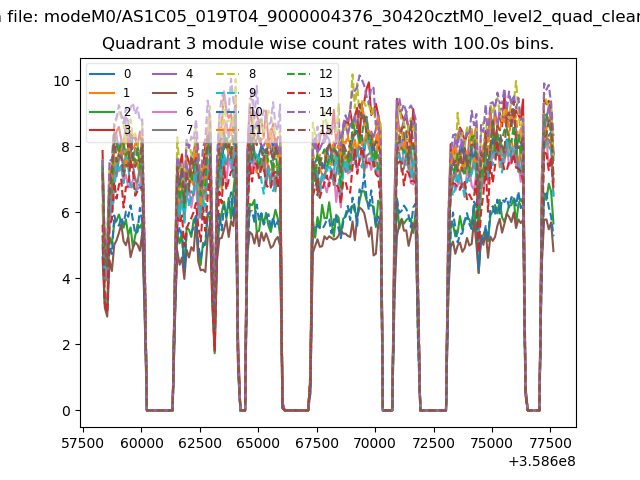
| Module-wise count rates for Quadrant A Data is divided into 100 sec bins |
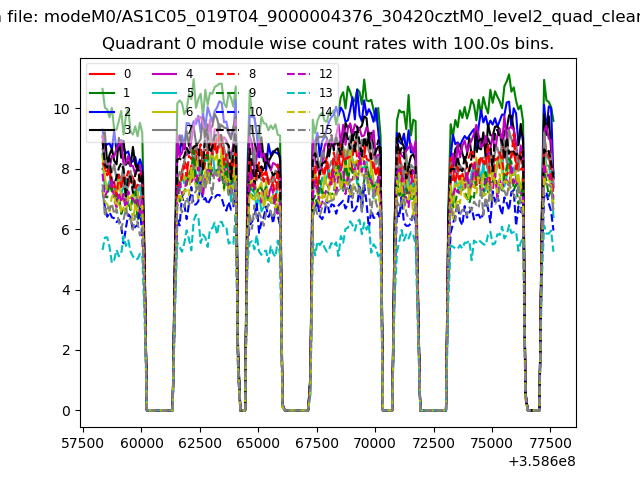 |
 |
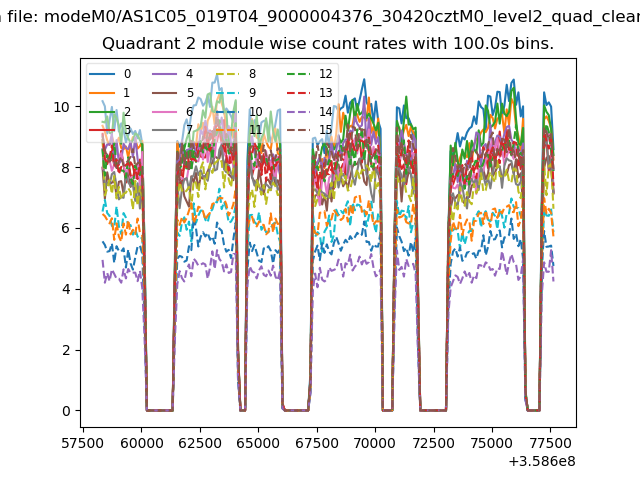
| Module-wise count rates for Quadrant B Data is divided into 100 sec bins |
 |
 |
| Module-wise count rates for Quadrant C Data is divided into 100 sec bins |
 |
 |
| Module-wise count rates for Quadrant D Data is divided into 100 sec bins |
 |
 |
| Parameter | Plot |
|---|---|
| CZT HV Monitor |  |
| D_VDD | 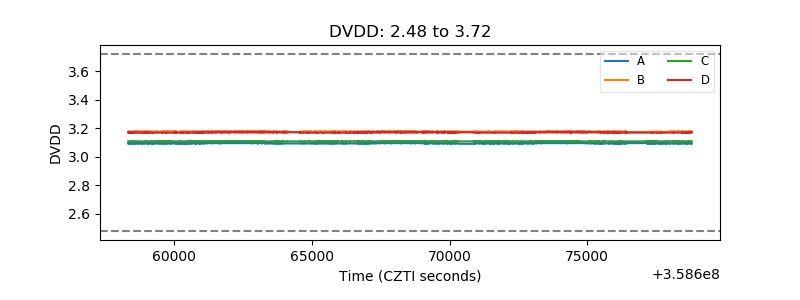 |
| Temperature 1 | 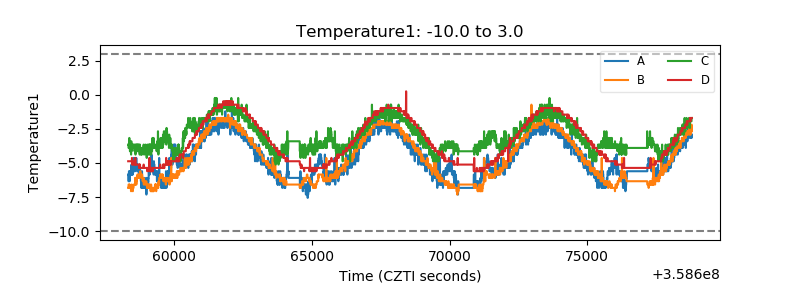 |
| Veto HV Monitor | 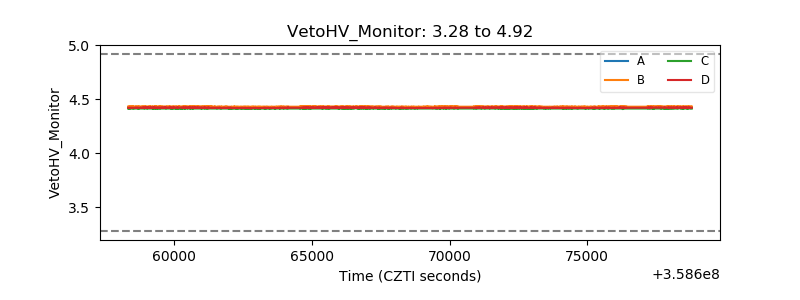 |
| Veto LLD |  |
| Alpha Counter | 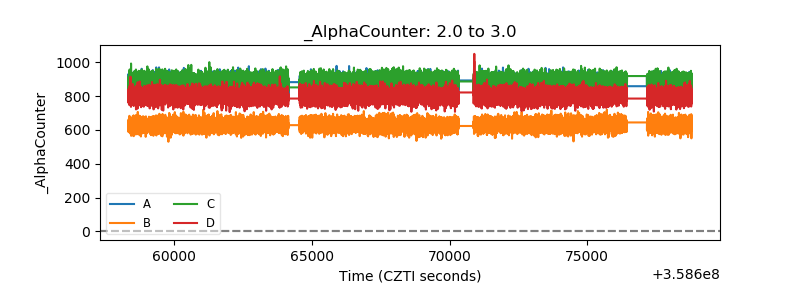 |
| _CPM_Rate | 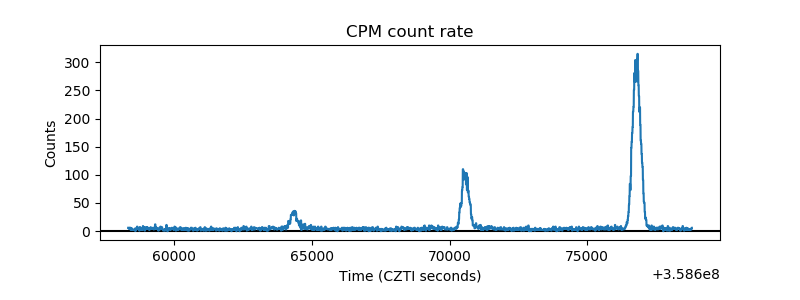 |
| CZT Counter | 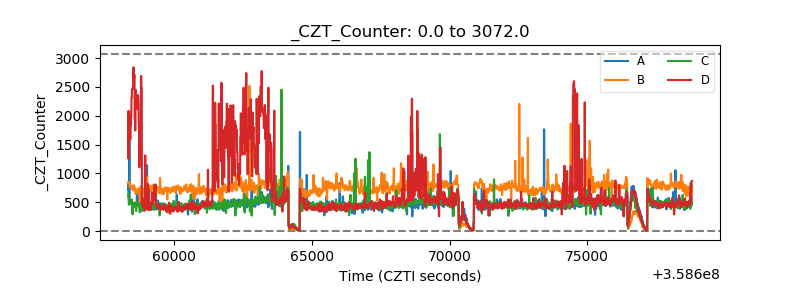 |
| +2.5 Volts monitor |  |
| +5 Volts monitor | 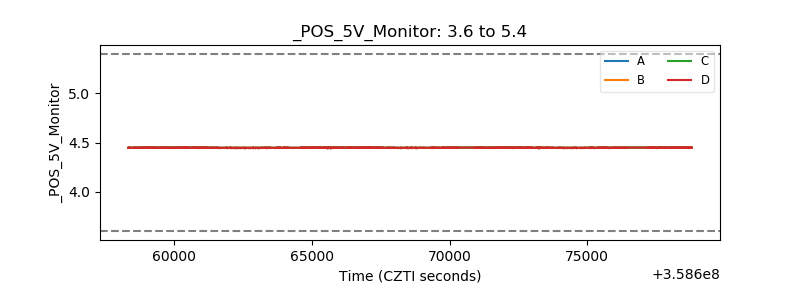 |
| _ROLL_ROT | 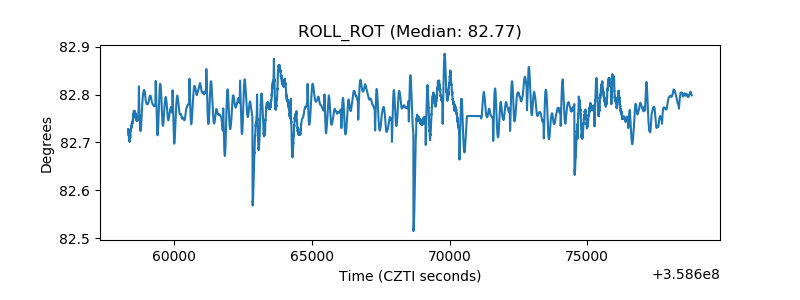 |
| _Roll_DEC | 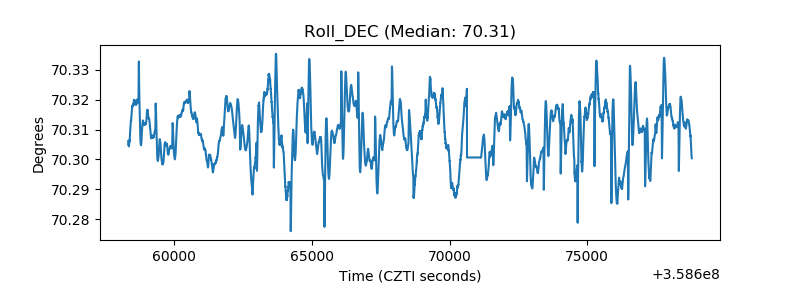 |
| _Roll_RA | 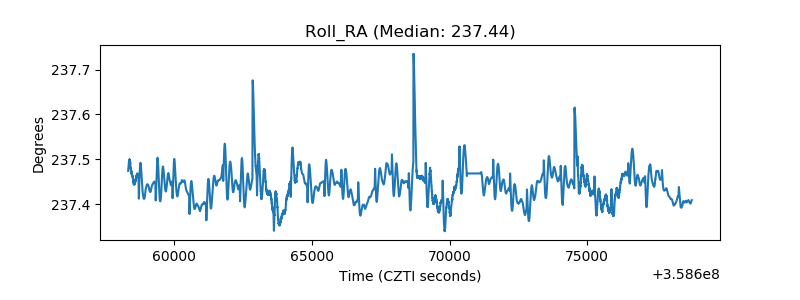 |
| Veto Counter | 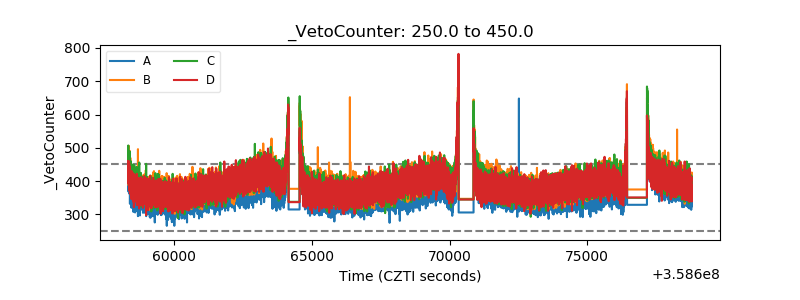 |