| Param | Original file | Final file |
|---|---|---|
| Filename | modeM0/AS1C05_019T04_9000004376_30421cztM0_level2.evt | modeM0/AS1C05_019T04_9000004376_30421cztM0_level2_quad_clean.evt |
| Size (bytes) | 518,112,000 | 82,442,880 |
| Size | 494.1 MB | 78.6 MB |
| Events in quadrant A | 3,190,998 | 518,761 |
| Events in quadrant B | 5,423,448 | 515,457 |
| Events in quadrant C | 3,222,468 | 501,940 |
| Events in quadrant D | 3,402,538 | 495,953 |
| Mode M9 | |||
|---|---|---|---|
| Quadrant | BADHDUFLAG | Total packets | Discarded packets |
| A | 0 | 9 | 0 |
| B | 0 | 9 | 0 |
| C | 0 | 9 | 0 |
| D | 0 | 9 | 0 |
| Mode SS | |||
|---|---|---|---|
| Quadrant | BADHDUFLAG | Total packets | Discarded packets |
| A | 0 | 134 | 0 |
| B | 0 | 134 | 0 |
| C | 0 | 134 | 0 |
| D | 0 | 134 | 0 |
| Mode M0 | |||
|---|---|---|---|
| Quadrant | BADHDUFLAG | Total packets | Discarded packets |
| A | 0 | 13755 | 0 |
| B | 0 | 20969 | 0 |
| C | 0 | 13647 | 0 |
| D | 0 | 14230 | 0 |
| Quadrant | Total seconds | Saturated seconds | Saturation percentage |
|---|---|---|---|
| A | 6665 | 74 | 1.110278% |
| B | 6665 | 154 | 2.310578% |
| C | 6665 | 99 | 1.485371% |
| D | 6665 | 67 | 1.005251% |
Noise dominated data is calculated using 1-second bins in cleaned event files. If a bin has >2000 counts, and if more than 50% of those come from <1% of pixels, then it is considered to be noise-dominated and hence unusable.
| Quadrant | # 1 sec bins | Bins with >0 counts | Bins with >2000 counts | High rate bins dominated by noise | Noise dominated (total time) | Noise dominated (detector-on time) | Marked lightcurve |
|---|---|---|---|---|---|---|---|
| A | 7525 | 6665 | 1 | 1 | 0.01% | 0.02% | 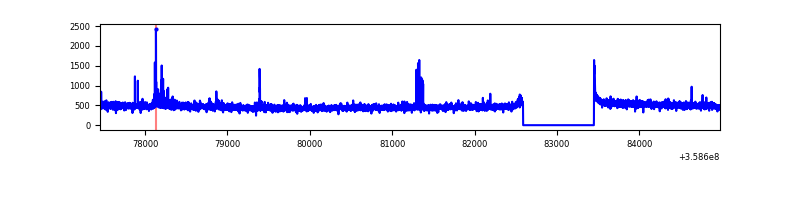 |
| B | 7525 | 6665 | 16 | 16 | 0.21% | 0.24% | 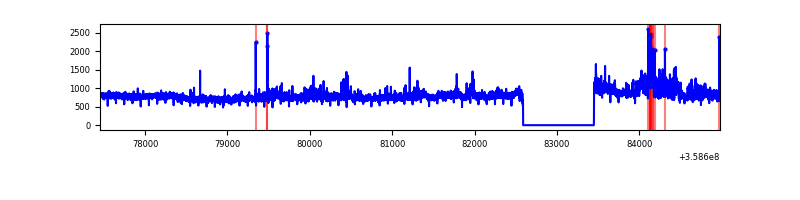 |
| C | 7525 | 6665 | 2 | 2 | 0.03% | 0.03% | 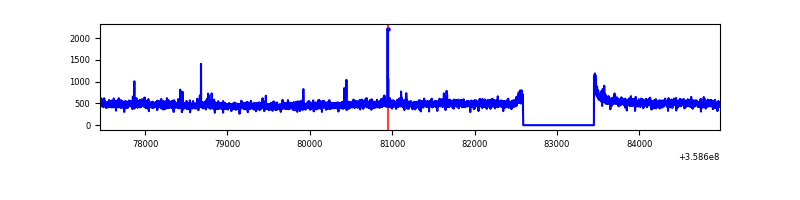 |
| D | 7525 | 6665 | 28 | 28 | 0.37% | 0.42% | 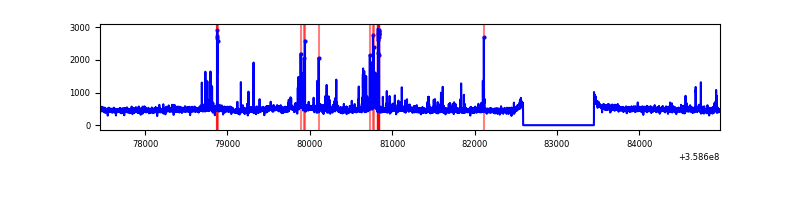 |
Top three noisy pixels from each quadrant. If the there are fewer than three noisy pixels in the level2.evt file, extra rows are filled as -1
| Pixel properties | Quadrant properties | ||||||
|---|---|---|---|---|---|---|---|
| Quadrant | DetID | PixID | Counts | Sigma | Mean | Median | Sigma |
| A | 14 | 239 | 41121 | 247.43 | 807 | 790 | 163.0 |
| A | 0 | 13 | 21430 | 126.62 | 807 | 790 | 163.0 |
| A | 13 | 254 | 12850 | 73.99 | 807 | 790 | 163.0 |
| B | 6 | 159 | 1839229 | 12070.23 | 794 | 773 | 152.3 |
| B | 0 | 229 | 407921 | 2673.1 | 794 | 773 | 152.3 |
| B | 4 | 80 | 25976 | 165.47 | 794 | 773 | 152.3 |
| C | 14 | 238 | 124387 | 692.04 | 767 | 768 | 178.6 |
| C | 3 | 233 | 76396 | 423.38 | 767 | 768 | 178.6 |
| C | 10 | 22 | 18772 | 100.79 | 767 | 768 | 178.6 |
| D | 8 | 195 | 152290 | 758.12 | 769 | 753 | 199.9 |
| D | 13 | 249 | 130114 | 647.18 | 769 | 753 | 199.9 |
| D | 2 | 250 | 62464 | 308.73 | 769 | 753 | 199.9 |
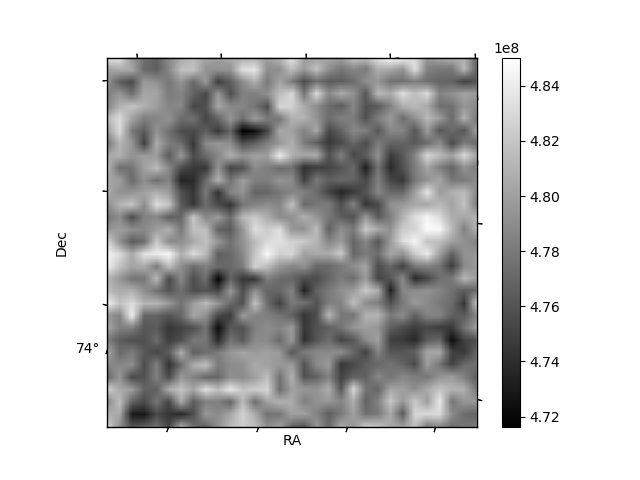
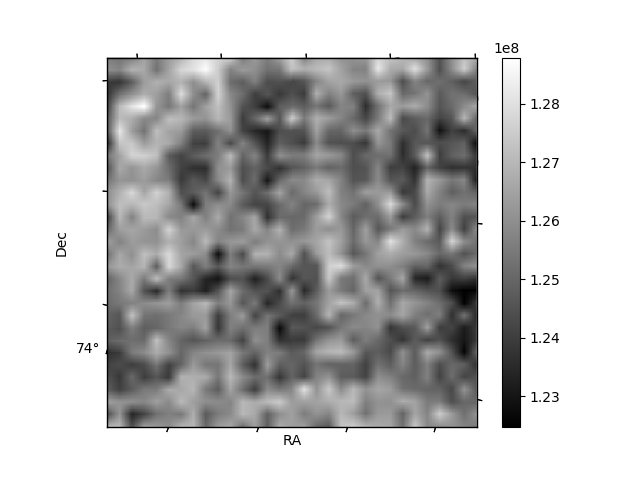
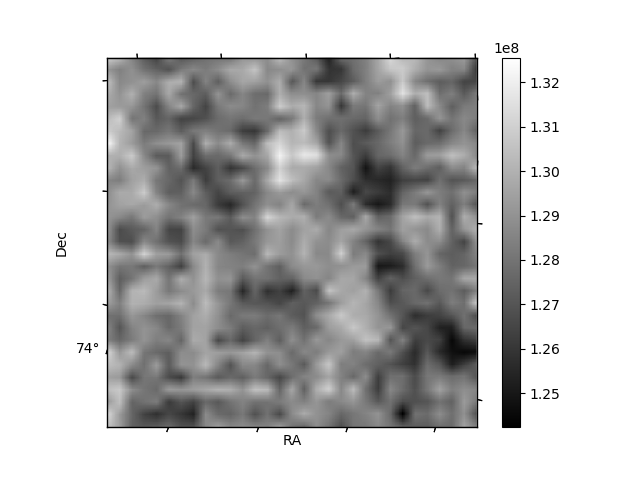
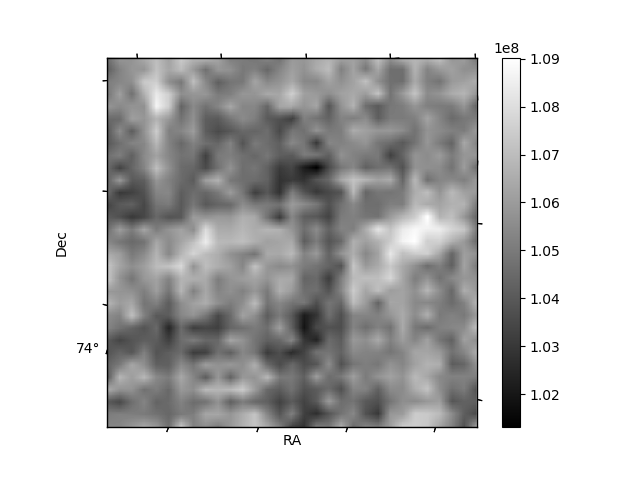
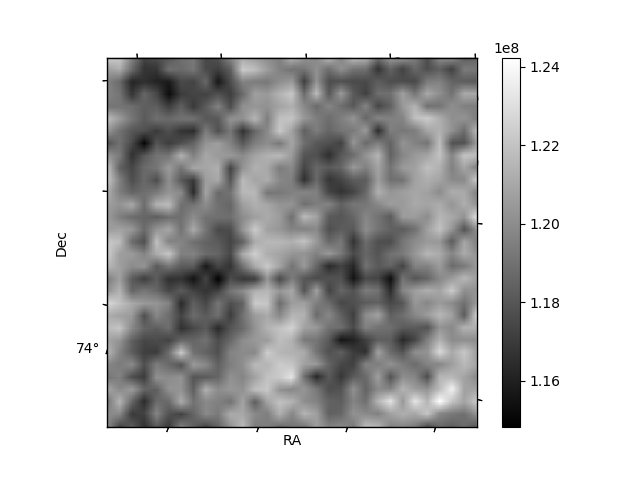
Histogram calculated using DETX and DETY for each event in the final _common_clean file
| Quadrant A | 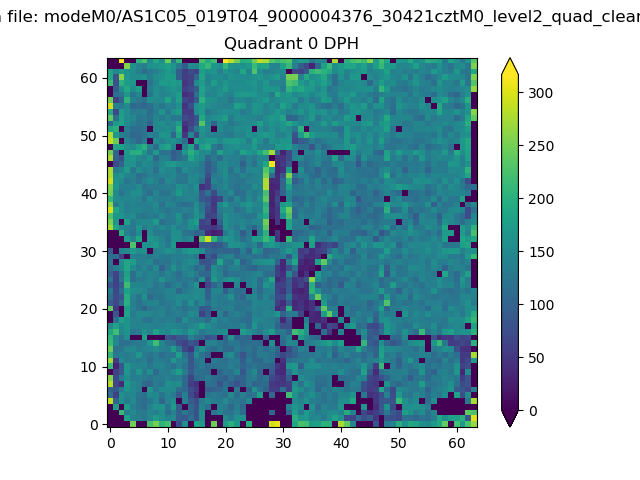 |
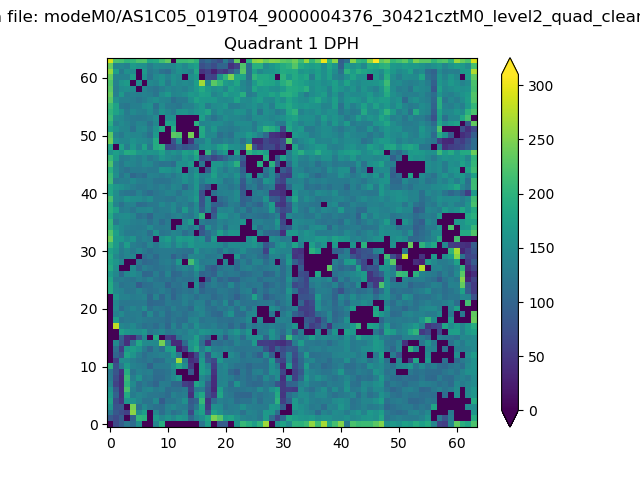 |
Quadrant B |
|---|---|---|---|
| Quadrant D | 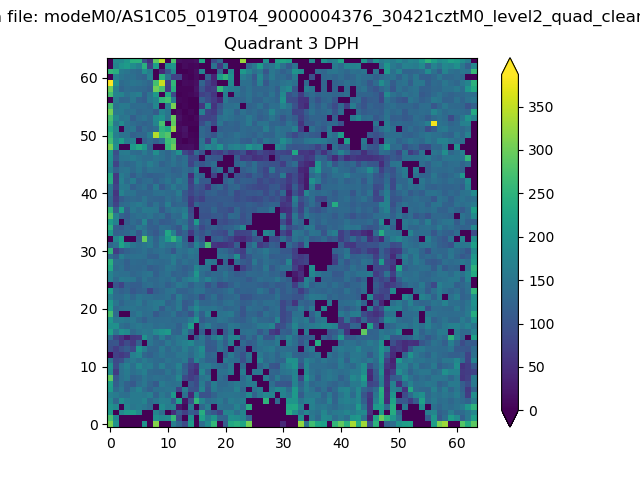 |
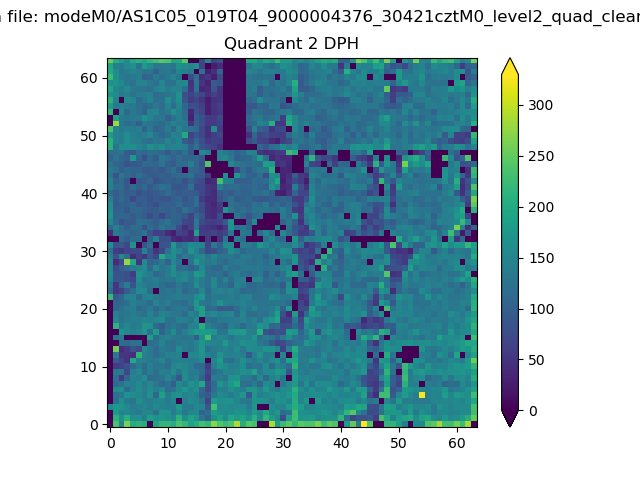 |
Quadrant C |
| Plot type | Count rate plots | Images |
|---|---|---|
| Comparison with Poisson distribution Blue bars denote a histogram of data divided into 1 sec bins. Red curve is a Poisson curve with rate = median count rate of data. |
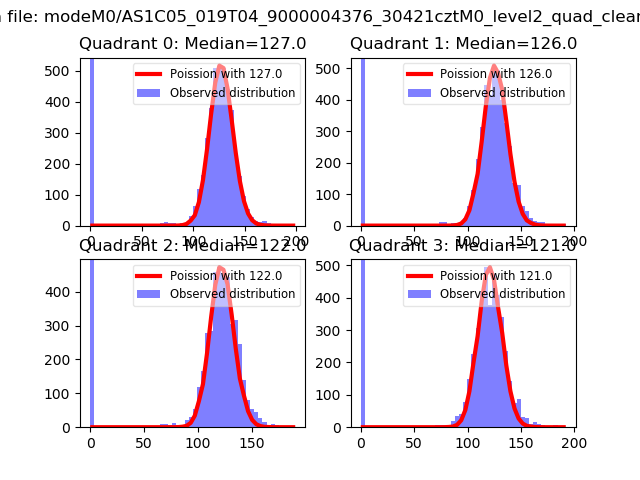 |
 |
| Quadrant-wise count rates Data is divided into 100 sec bins |
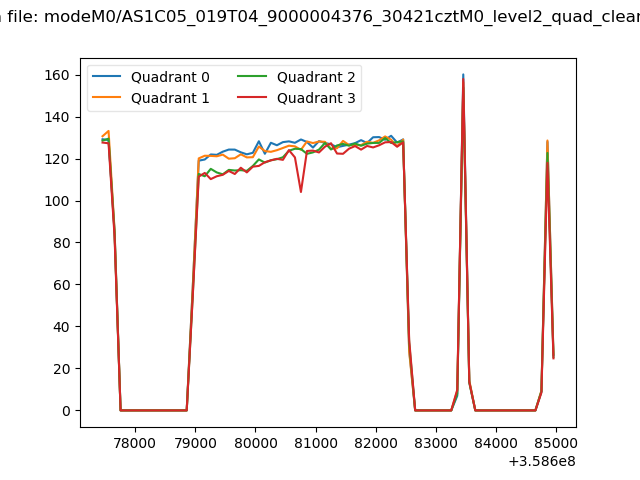 |
|
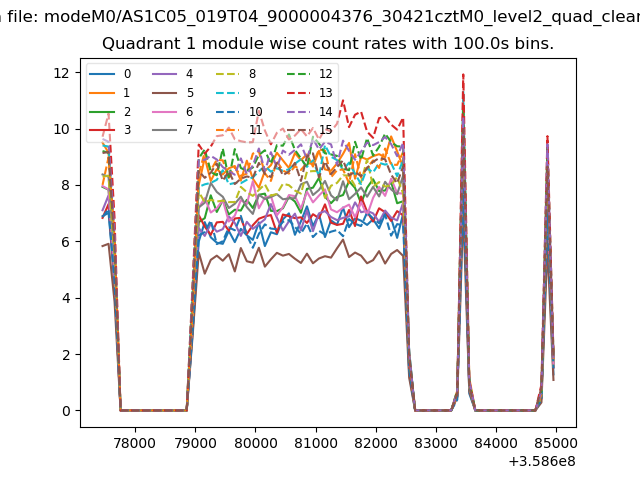
| Module-wise count rates for Quadrant A Data is divided into 100 sec bins |
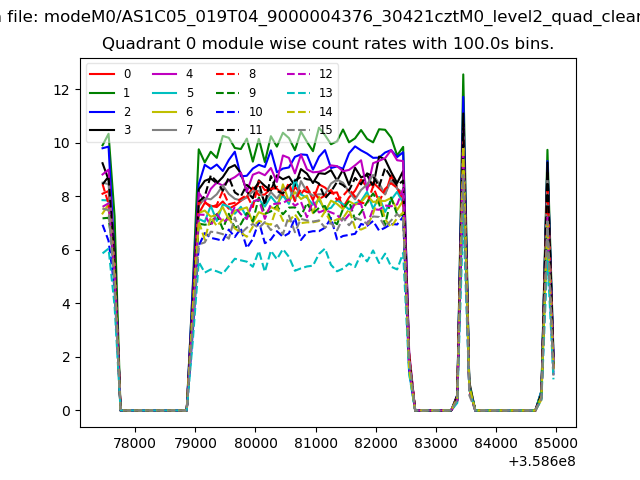 |
 |
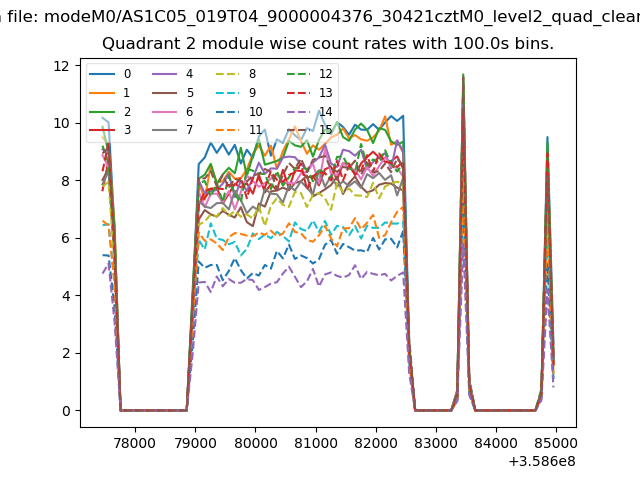
| Module-wise count rates for Quadrant B Data is divided into 100 sec bins |
 |
 |
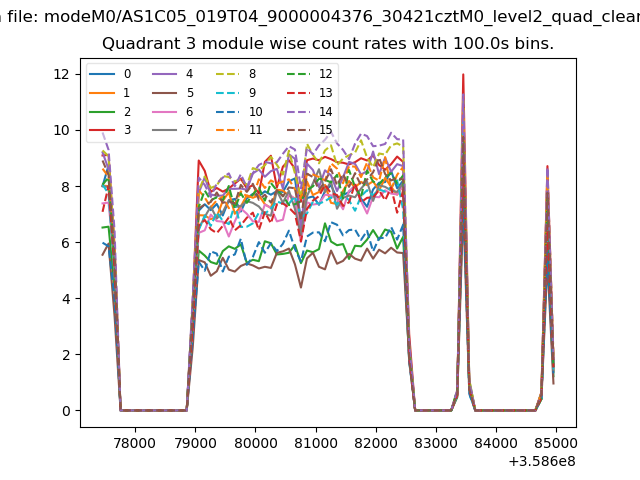
| Module-wise count rates for Quadrant C Data is divided into 100 sec bins |
 |
 |
| Module-wise count rates for Quadrant D Data is divided into 100 sec bins |
 |
 |
| Parameter | Plot |
|---|---|
| CZT HV Monitor | 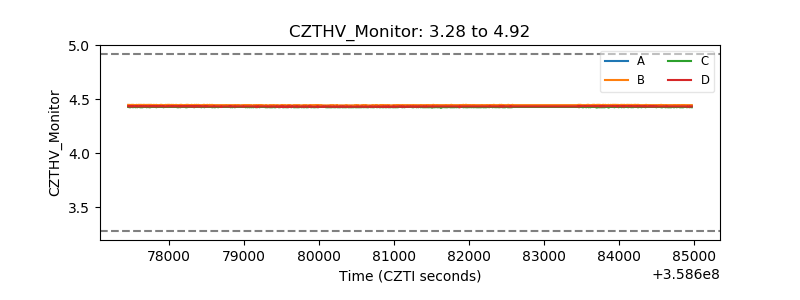 |
| D_VDD | 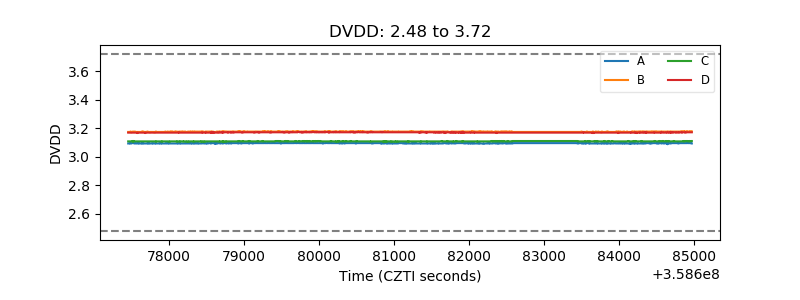 |
| Temperature 1 | 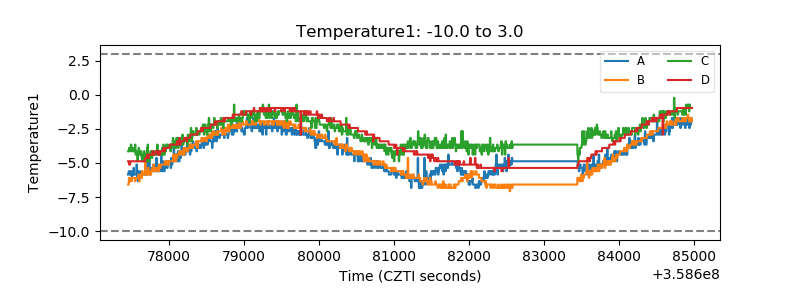 |
| Veto HV Monitor | 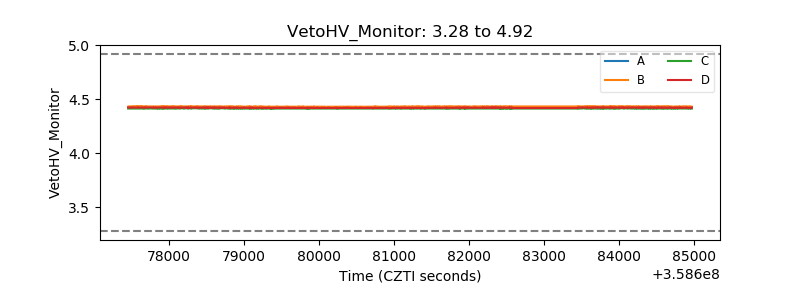 |
| Veto LLD |  |
| Alpha Counter | 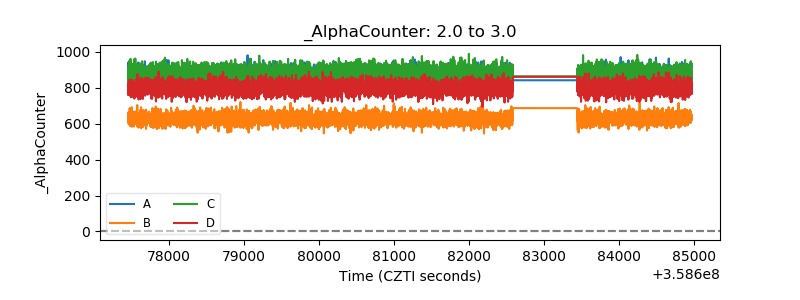 |
| _CPM_Rate | 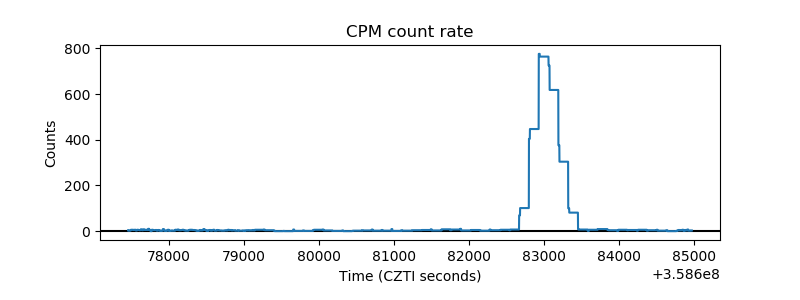 |
| CZT Counter | 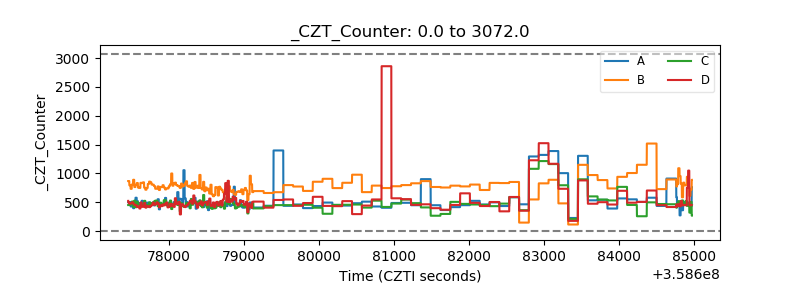 |
| +2.5 Volts monitor |  |
| +5 Volts monitor |  |
| _ROLL_ROT | 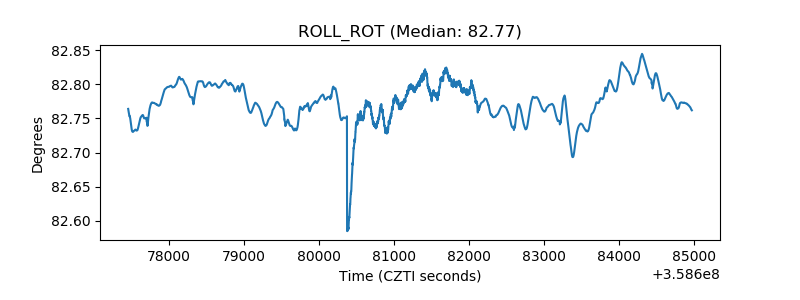 |
| _Roll_DEC | 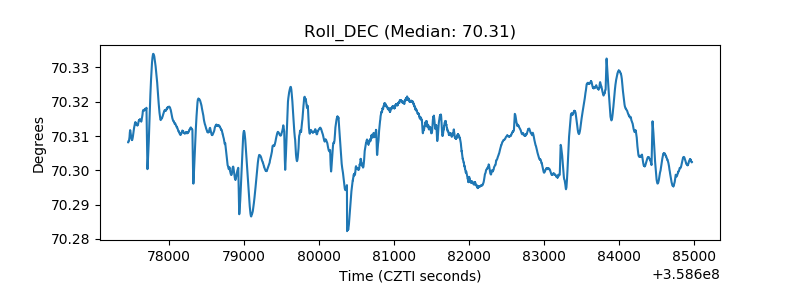 |
| _Roll_RA | 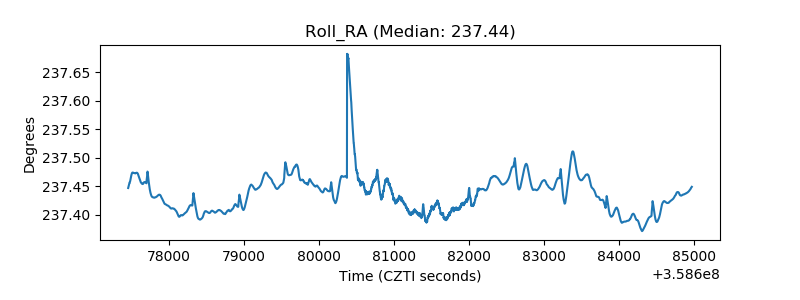 |
| Veto Counter | 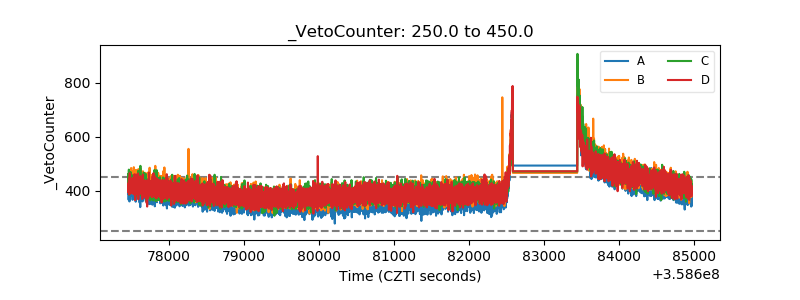 |