| Param | Original file | Final file |
|---|---|---|
| Filename | modeM0/AS1C05_019T04_9000004376_30422cztM0_level2.evt | modeM0/AS1C05_019T04_9000004376_30422cztM0_level2_quad_clean.evt |
| Size (bytes) | 571,682,880 | 92,635,200 |
| Size | 545.2 MB | 88.3 MB |
| Events in quadrant A | 3,827,967 | 597,144 |
| Events in quadrant B | 5,680,669 | 592,026 |
| Events in quadrant C | 3,565,080 | 571,362 |
| Events in quadrant D | 3,777,497 | 568,936 |
| Mode M9 | |||
|---|---|---|---|
| Quadrant | BADHDUFLAG | Total packets | Discarded packets |
| A | 0 | 14 | 0 |
| B | 0 | 15 | 0 |
| C | 0 | 15 | 0 |
| D | 0 | 15 | 0 |
| Mode SS | |||
|---|---|---|---|
| Quadrant | BADHDUFLAG | Total packets | Discarded packets |
| A | 0 | 138 | 0 |
| B | 0 | 138 | 0 |
| C | 0 | 138 | 0 |
| D | 0 | 138 | 0 |
| Mode M0 | |||
|---|---|---|---|
| Quadrant | BADHDUFLAG | Total packets | Discarded packets |
| A | 0 | 15833 | 1 |
| B | 0 | 21637 | 1 |
| C | 0 | 14770 | 1 |
| D | 0 | 15536 | 2 |
| Quadrant | Total seconds | Saturated seconds | Saturation percentage |
|---|---|---|---|
| A | 6830 | 120 | 1.756955% |
| B | 6830 | 183 | 2.679356% |
| C | 6830 | 188 | 2.752562% |
| D | 6829 | 68 | 0.995753% |
Noise dominated data is calculated using 1-second bins in cleaned event files. If a bin has >2000 counts, and if more than 50% of those come from <1% of pixels, then it is considered to be noise-dominated and hence unusable.
| Quadrant | # 1 sec bins | Bins with >0 counts | Bins with >2000 counts | High rate bins dominated by noise | Noise dominated (total time) | Noise dominated (detector-on time) | Marked lightcurve |
|---|---|---|---|---|---|---|---|
| A | 7840 | 6830 | 34 | 34 | 0.43% | 0.50% | 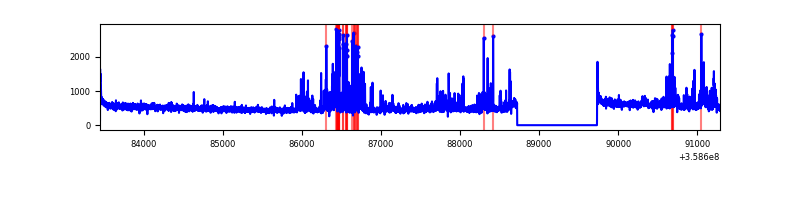 |
| B | 7840 | 6830 | 19 | 19 | 0.24% | 0.28% | 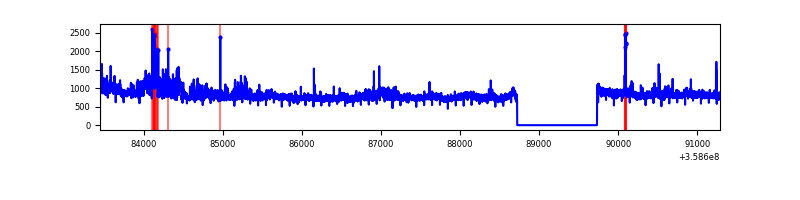 |
| C | 7840 | 6830 | 0 | 0 | 0.00% | 0.00% |  |
| D | 7839 | 6829 | 15 | 15 | 0.19% | 0.22% | 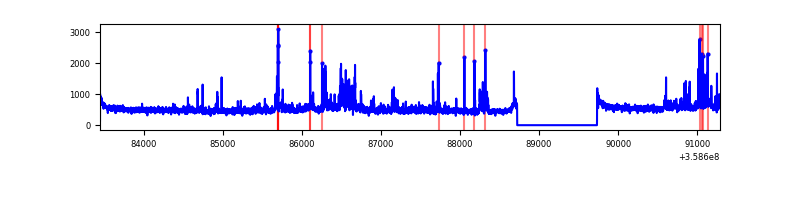 |
Top three noisy pixels from each quadrant. If the there are fewer than three noisy pixels in the level2.evt file, extra rows are filled as -1
| Pixel properties | Quadrant properties | ||||||
|---|---|---|---|---|---|---|---|
| Quadrant | DetID | PixID | Counts | Sigma | Mean | Median | Sigma |
| A | 0 | 13 | 488580 | 2830.74 | 859 | 842 | 172.3 |
| A | 8 | 192 | 19847 | 110.3 | 859 | 842 | 172.3 |
| A | 13 | 254 | 12673 | 68.66 | 859 | 842 | 172.3 |
| B | 6 | 159 | 1871141 | 11621.24 | 842 | 823 | 160.9 |
| B | 0 | 229 | 395699 | 2453.57 | 842 | 823 | 160.9 |
| B | 4 | 80 | 75928 | 466.67 | 842 | 823 | 160.9 |
| C | 3 | 233 | 188836 | 988.23 | 816 | 820 | 190.3 |
| C | 14 | 238 | 151446 | 791.71 | 816 | 820 | 190.3 |
| C | 14 | 254 | 28240 | 144.12 | 816 | 820 | 190.3 |
| D | 13 | 104 | 222850 | 1039.44 | 824 | 807 | 213.6 |
| D | 12 | 227 | 188837 | 880.22 | 824 | 807 | 213.6 |
| D | 8 | 195 | 94892 | 440.44 | 824 | 807 | 213.6 |
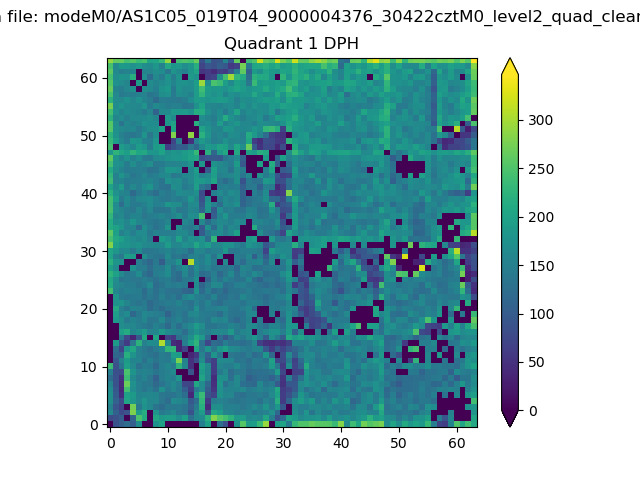
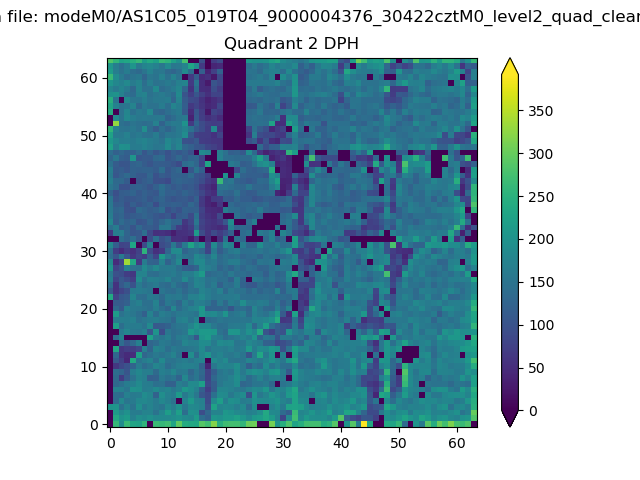
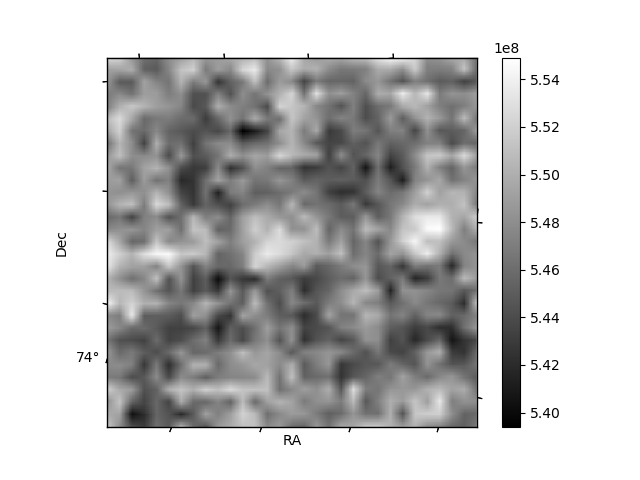
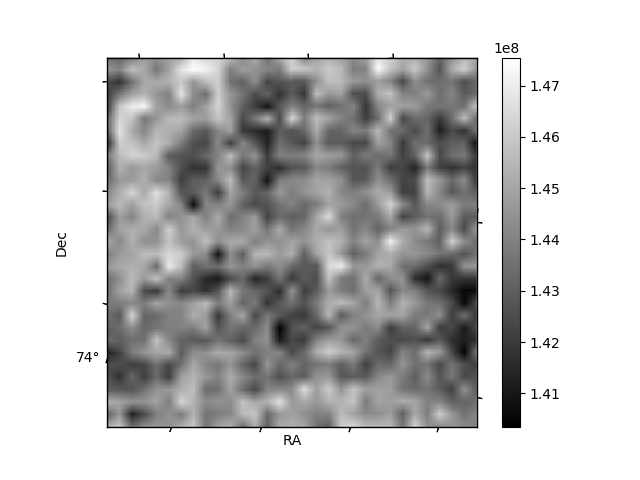
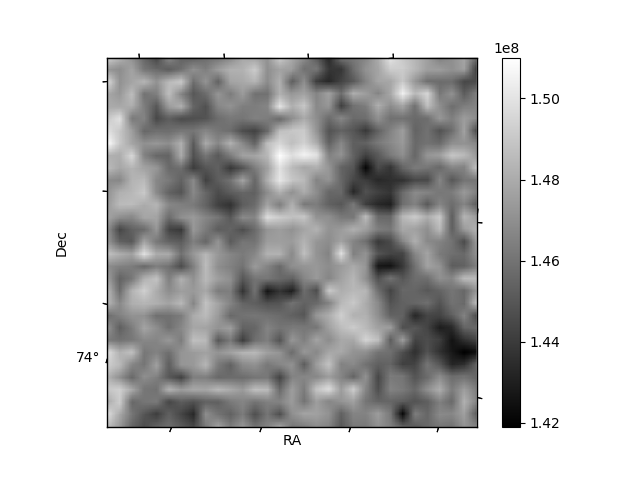
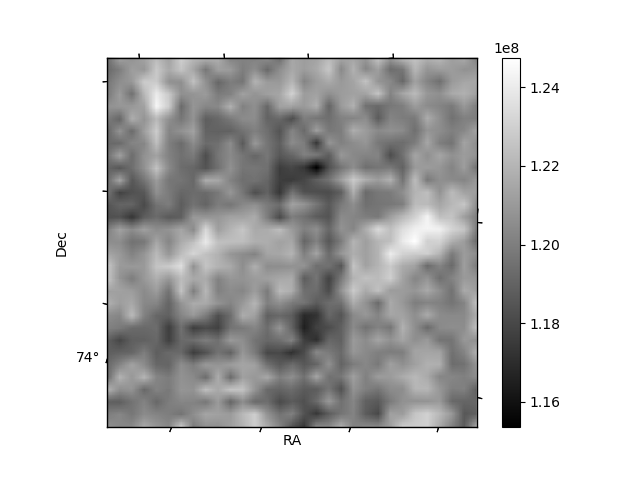
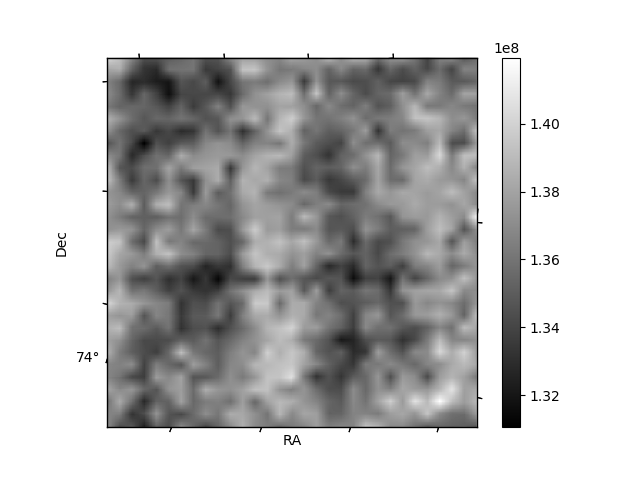
Histogram calculated using DETX and DETY for each event in the final _common_clean file
| Quadrant A | 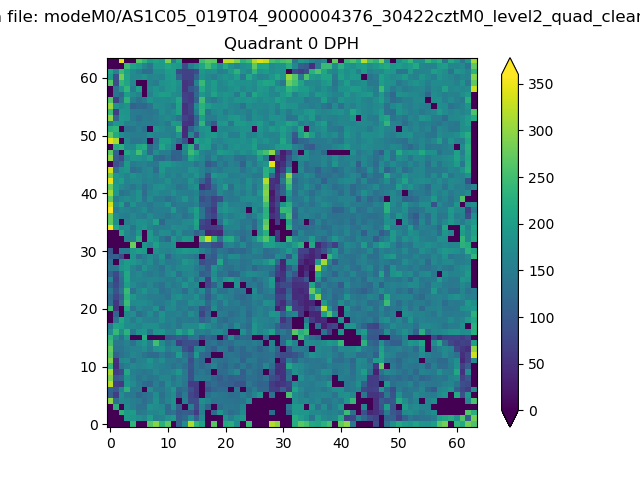 |
 |
Quadrant B |
|---|---|---|---|
| Quadrant D | 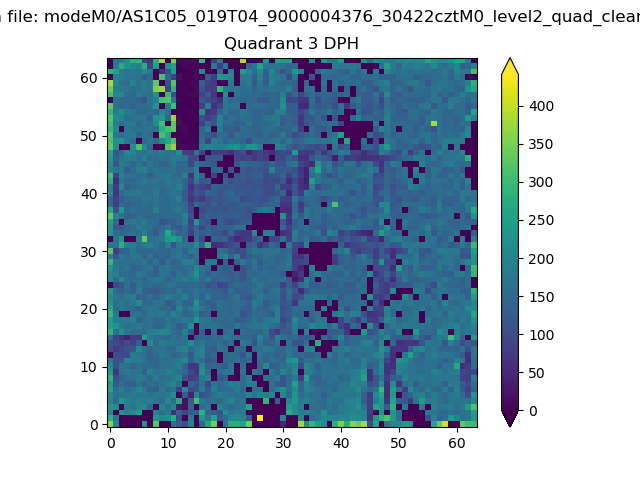 |
 |
Quadrant C |
| Plot type | Count rate plots | Images |
|---|---|---|
| Comparison with Poisson distribution Blue bars denote a histogram of data divided into 1 sec bins. Red curve is a Poisson curve with rate = median count rate of data. |
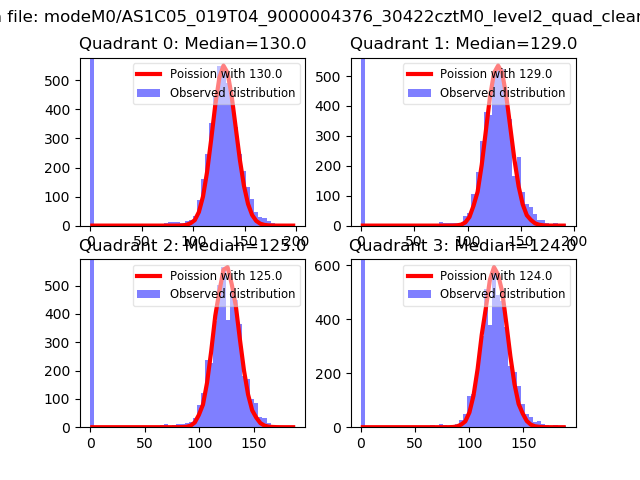 |
 |
| Quadrant-wise count rates Data is divided into 100 sec bins |
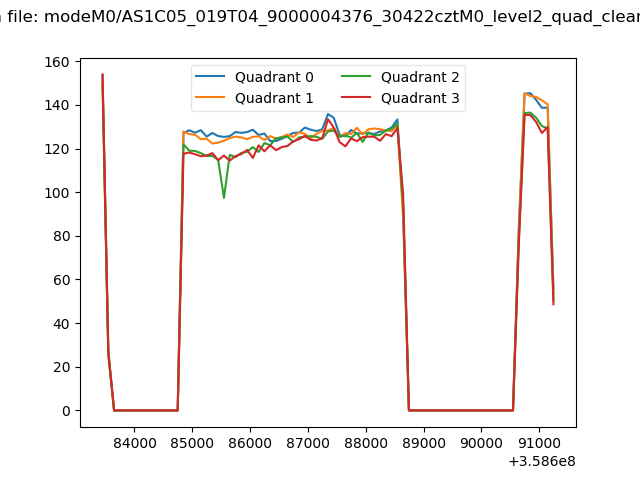 |
|
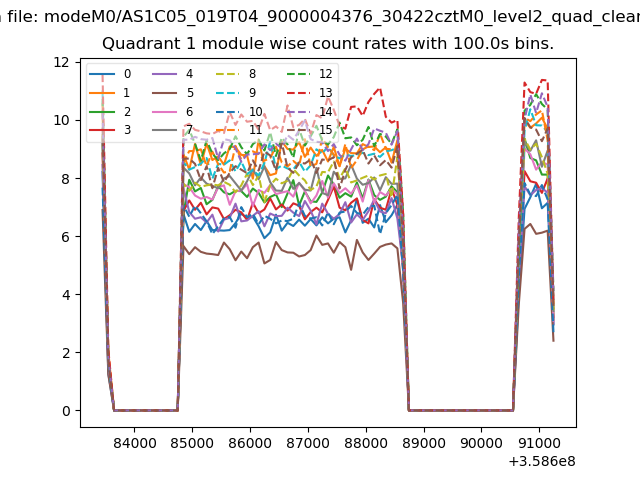
| Module-wise count rates for Quadrant A Data is divided into 100 sec bins |
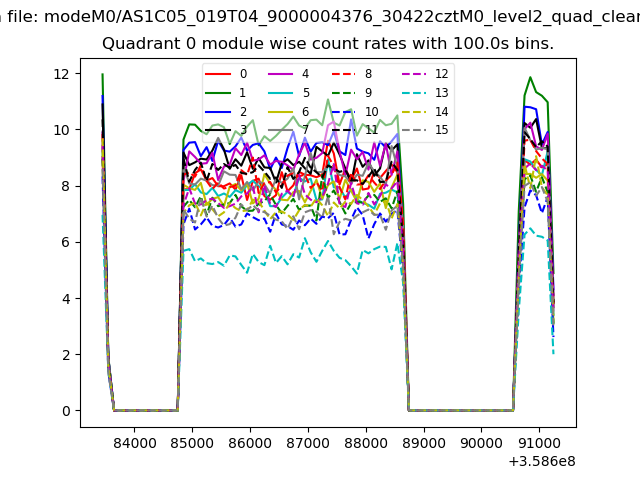 |
 |
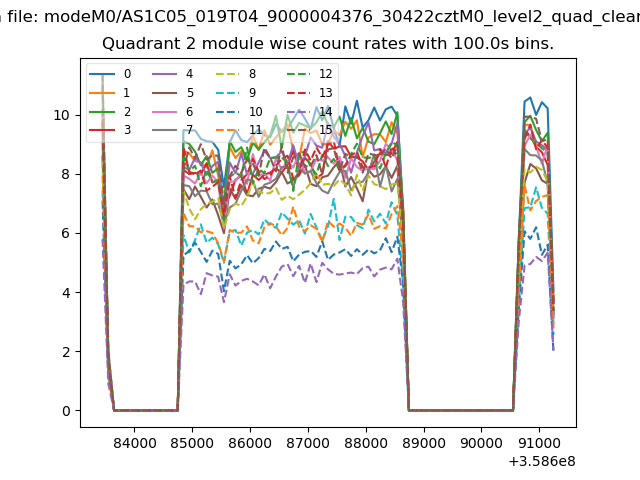
| Module-wise count rates for Quadrant B Data is divided into 100 sec bins |
 |
 |
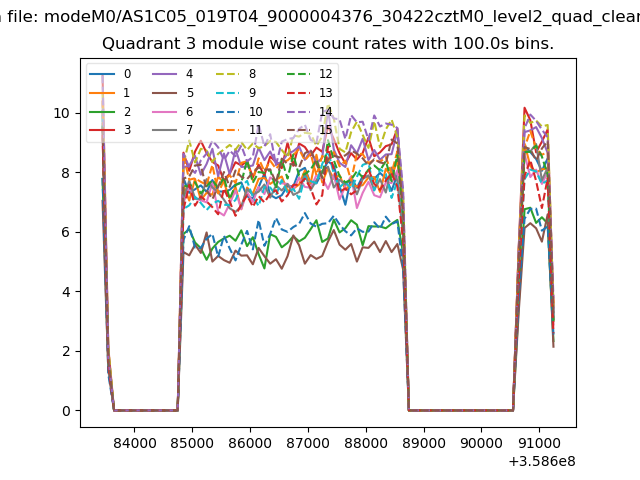
| Module-wise count rates for Quadrant C Data is divided into 100 sec bins |
 |
 |
| Module-wise count rates for Quadrant D Data is divided into 100 sec bins |
 |
 |
| Parameter | Plot |
|---|---|
| CZT HV Monitor | 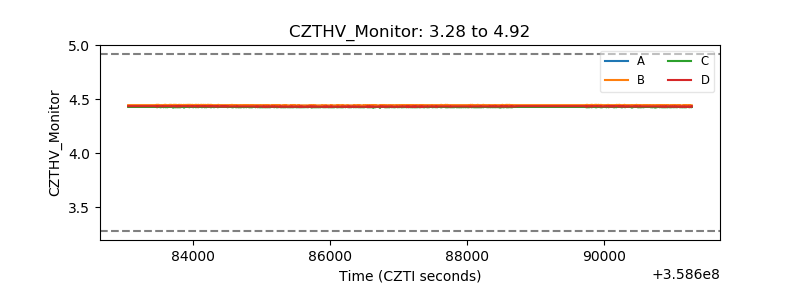 |
| D_VDD | 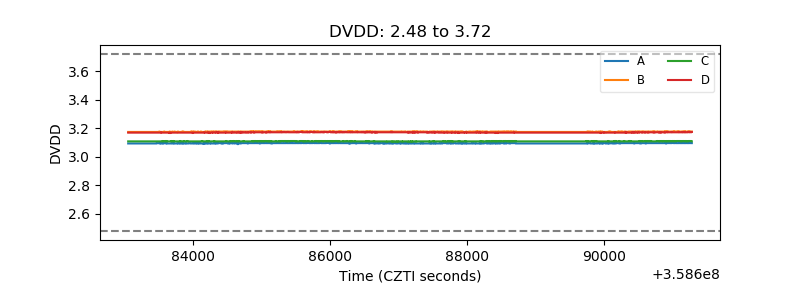 |
| Temperature 1 | 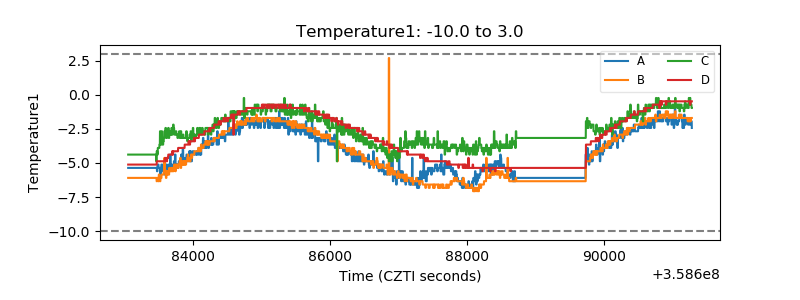 |
| Veto HV Monitor | 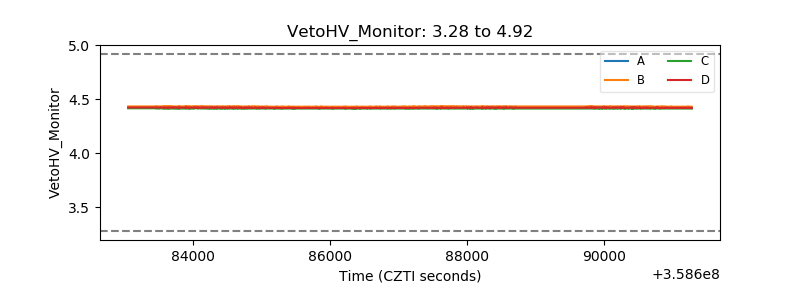 |
| Veto LLD |  |
| Alpha Counter | 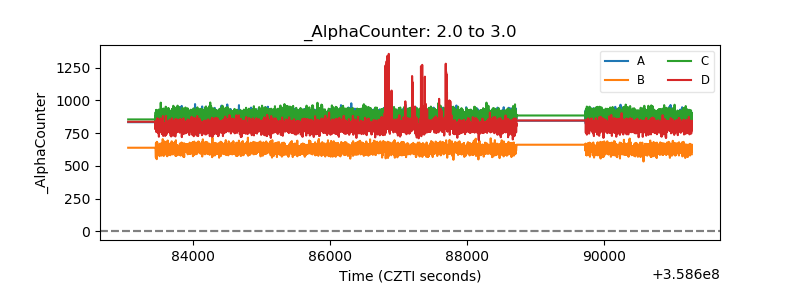 |
| _CPM_Rate | 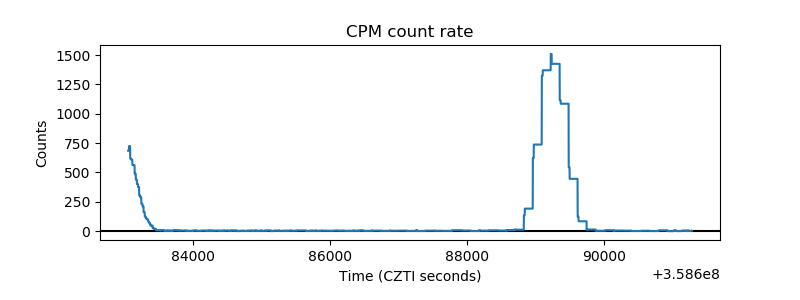 |
| CZT Counter | 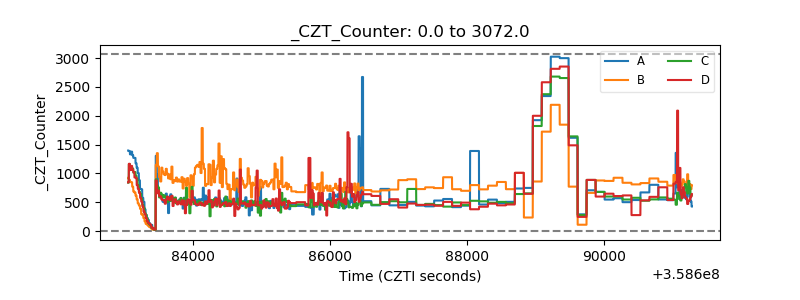 |
| +2.5 Volts monitor |  |
| +5 Volts monitor |  |
| _ROLL_ROT | 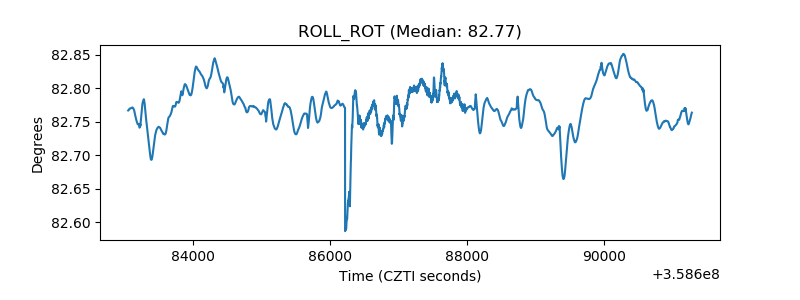 |
| _Roll_DEC | 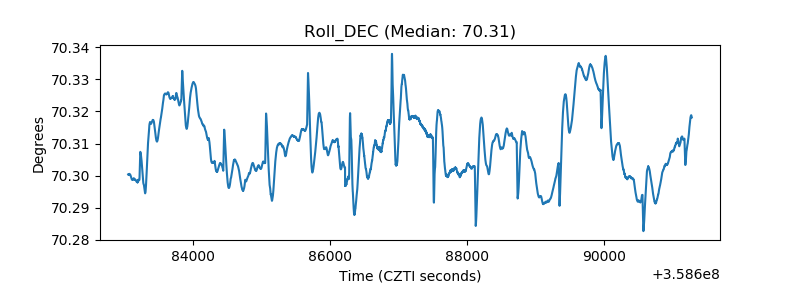 |
| _Roll_RA | 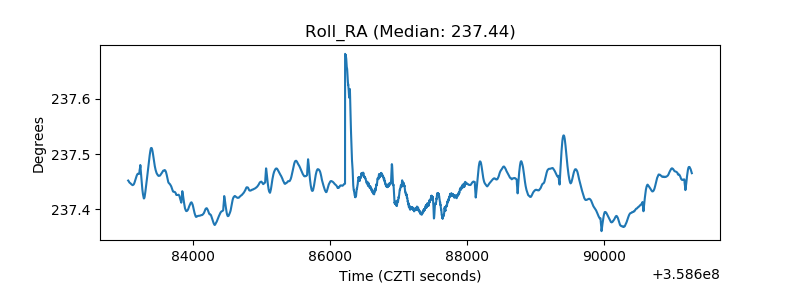 |
| Veto Counter | 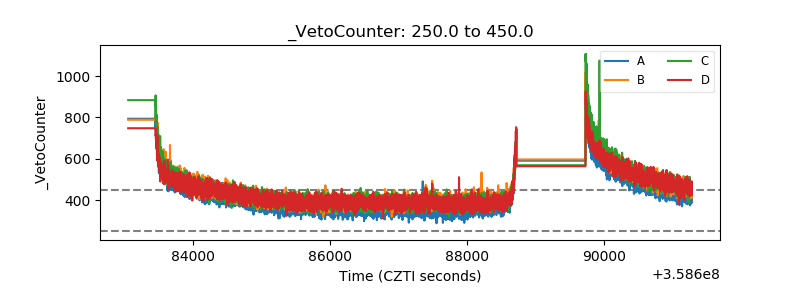 |