| Param | Original file | Final file |
|---|---|---|
| Filename | modeM0/AS1C05_019T04_9000004376_30424cztM0_level2.evt | modeM0/AS1C05_019T04_9000004376_30424cztM0_level2_quad_clean.evt |
| Size (bytes) | 594,849,600 | 107,683,200 |
| Size | 567.3 MB | 102.7 MB |
| Events in quadrant A | 3,623,463 | 720,707 |
| Events in quadrant B | 5,439,356 | 712,646 |
| Events in quadrant C | 3,727,711 | 691,193 |
| Events in quadrant D | 4,776,944 | 675,160 |
| Mode M9 | |||
|---|---|---|---|
| Quadrant | BADHDUFLAG | Total packets | Discarded packets |
| A | 0 | 13 | 0 |
| B | 0 | 14 | 0 |
| C | 0 | 14 | 0 |
| D | 0 | 14 | 0 |
| Mode SS | |||
|---|---|---|---|
| Quadrant | BADHDUFLAG | Total packets | Discarded packets |
| A | 0 | 136 | 0 |
| B | 0 | 136 | 0 |
| C | 0 | 136 | 0 |
| D | 0 | 136 | 0 |
| Mode M0 | |||
|---|---|---|---|
| Quadrant | BADHDUFLAG | Total packets | Discarded packets |
| A | 0 | 15305 | 2 |
| B | 0 | 20508 | 2 |
| C | 0 | 15328 | 2 |
| D | 0 | 18776 | 2 |
| Quadrant | Total seconds | Saturated seconds | Saturation percentage |
|---|---|---|---|
| A | 6616 | 100 | 1.511487% |
| B | 6616 | 163 | 2.463724% |
| C | 6616 | 168 | 2.539299% |
| D | 6616 | 99 | 1.496372% |
Noise dominated data is calculated using 1-second bins in cleaned event files. If a bin has >2000 counts, and if more than 50% of those come from <1% of pixels, then it is considered to be noise-dominated and hence unusable.
| Quadrant | # 1 sec bins | Bins with >0 counts | Bins with >2000 counts | High rate bins dominated by noise | Noise dominated (total time) | Noise dominated (detector-on time) | Marked lightcurve |
|---|---|---|---|---|---|---|---|
| A | 7776 | 6616 | 9 | 9 | 0.12% | 0.14% | 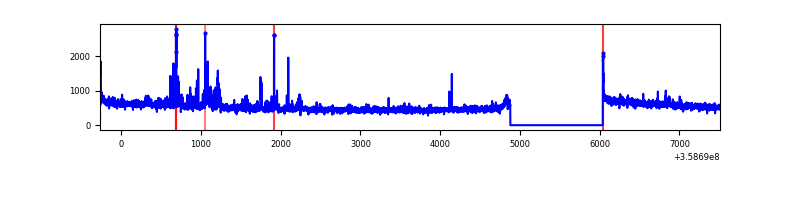 |
| B | 7776 | 6616 | 8 | 8 | 0.10% | 0.12% |  |
| C | 7776 | 6616 | 1 | 1 | 0.01% | 0.02% | 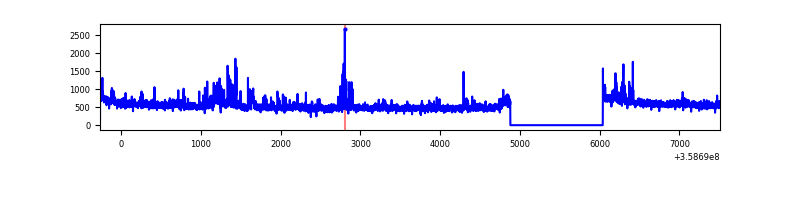 |
| D | 7776 | 6616 | 28 | 28 | 0.36% | 0.42% | 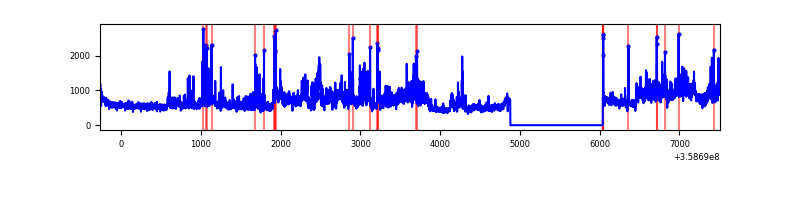 |
Top three noisy pixels from each quadrant. If the there are fewer than three noisy pixels in the level2.evt file, extra rows are filled as -1
| Pixel properties | Quadrant properties | ||||||
|---|---|---|---|---|---|---|---|
| Quadrant | DetID | PixID | Counts | Sigma | Mean | Median | Sigma |
| A | 0 | 13 | 252556 | 1462.72 | 865 | 850 | 172.1 |
| A | 8 | 192 | 22481 | 125.7 | 865 | 850 | 172.1 |
| A | 13 | 254 | 12406 | 67.15 | 865 | 850 | 172.1 |
| B | 6 | 159 | 1853086 | 11671.94 | 847 | 827 | 158.7 |
| B | 0 | 229 | 159264 | 998.38 | 847 | 827 | 158.7 |
| B | 4 | 80 | 70136 | 436.75 | 847 | 827 | 158.7 |
| C | 3 | 233 | 248013 | 1290.23 | 829 | 834 | 191.6 |
| C | 14 | 238 | 142176 | 737.78 | 829 | 834 | 191.6 |
| C | 10 | 22 | 70355 | 362.89 | 829 | 834 | 191.6 |
| D | 13 | 104 | 1014813 | 4654.72 | 832 | 819 | 217.8 |
| D | 12 | 227 | 205575 | 939.93 | 832 | 819 | 217.8 |
| D | 8 | 195 | 205219 | 938.29 | 832 | 819 | 217.8 |
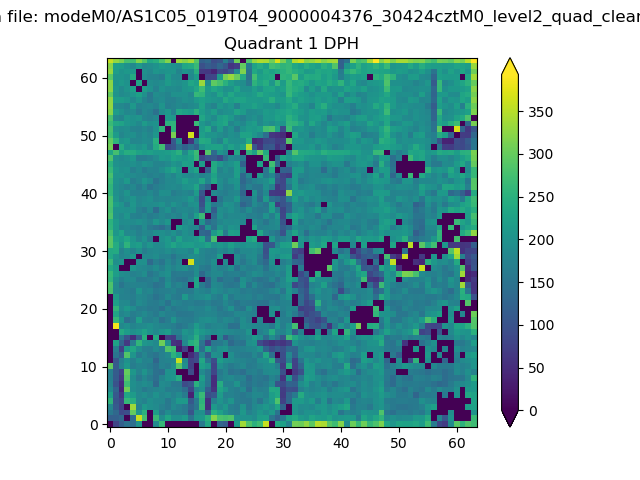
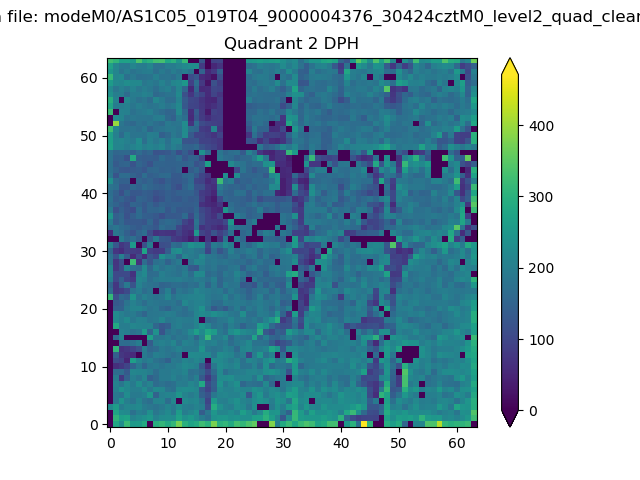
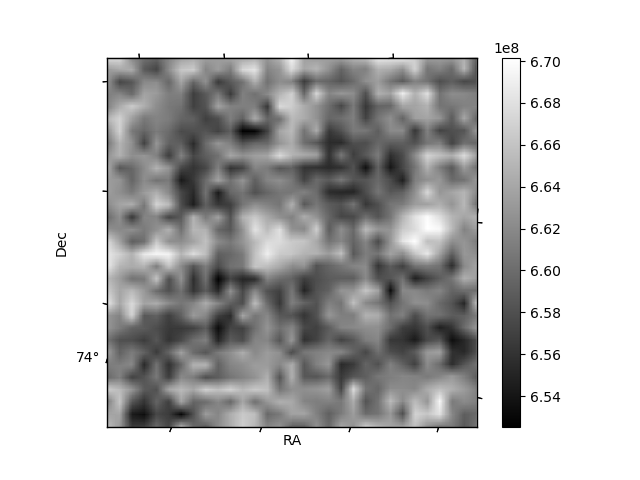
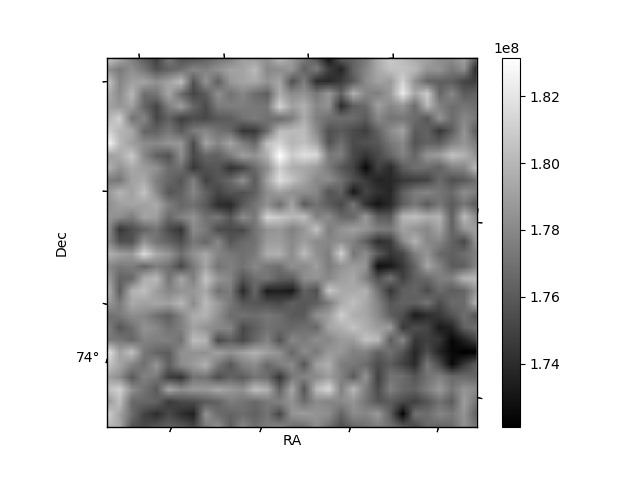
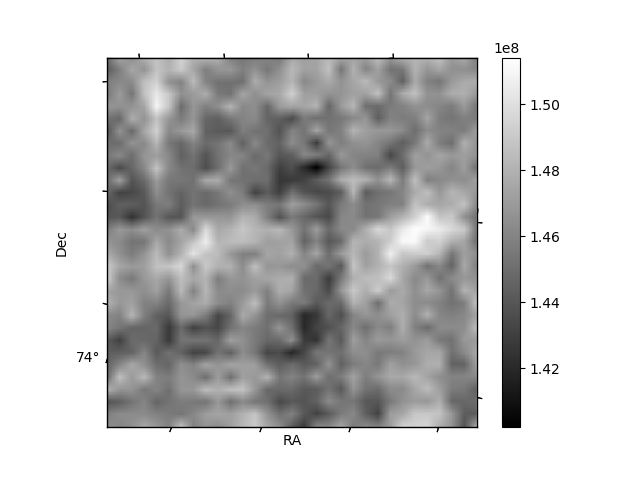
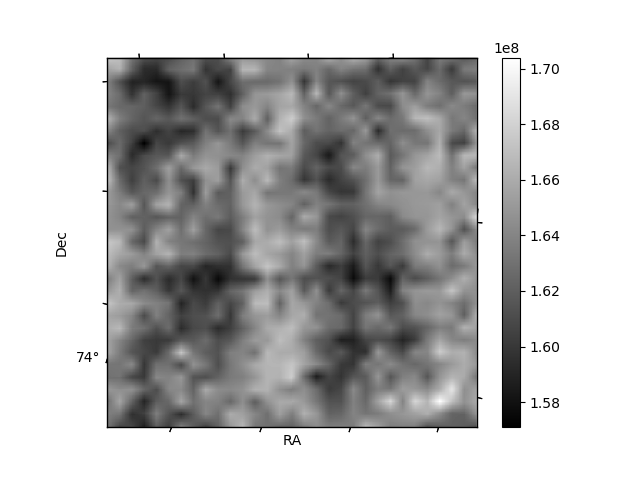
Histogram calculated using DETX and DETY for each event in the final _common_clean file
| Quadrant A | 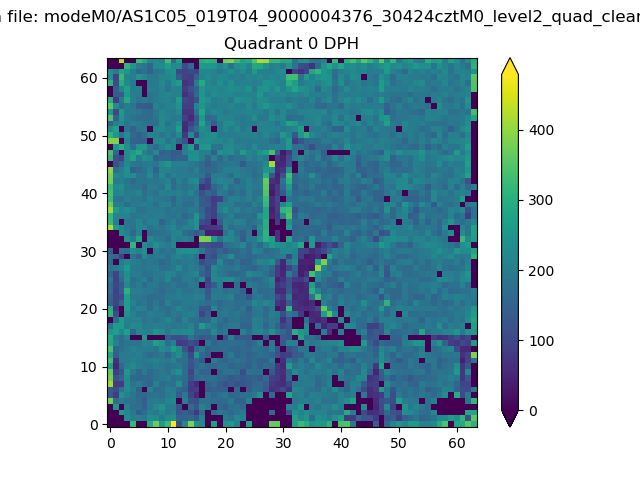 |
 |
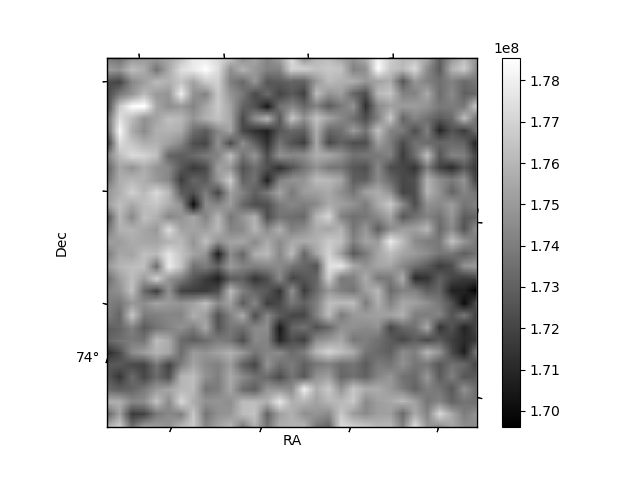
Quadrant B |
|---|---|---|---|
| Quadrant D | 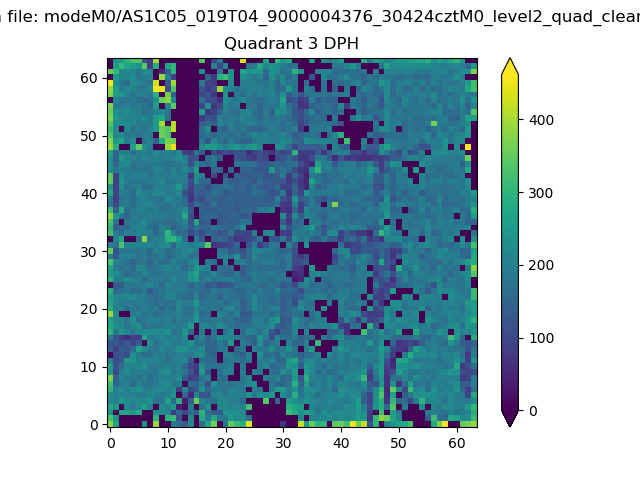 |
 |
Quadrant C |
| Plot type | Count rate plots | Images |
|---|---|---|
| Comparison with Poisson distribution Blue bars denote a histogram of data divided into 1 sec bins. Red curve is a Poisson curve with rate = median count rate of data. |
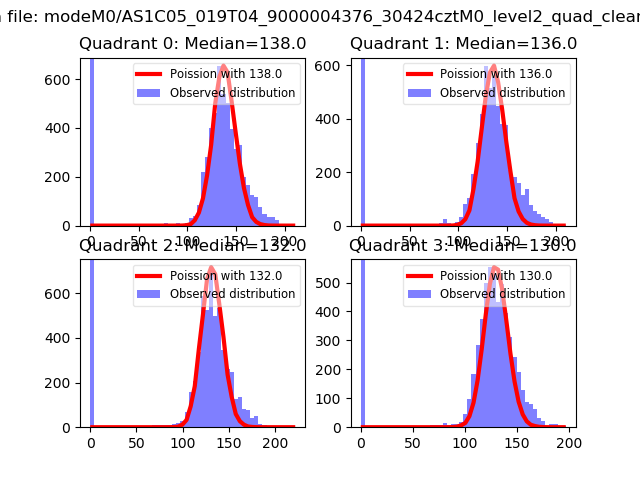 |
 |
| Quadrant-wise count rates Data is divided into 100 sec bins |
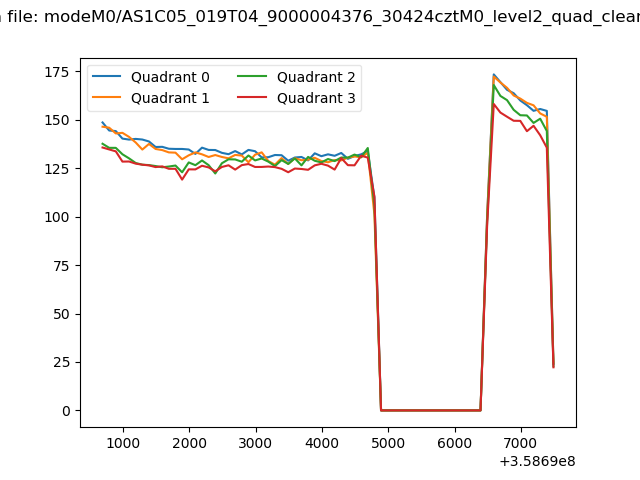 |
|
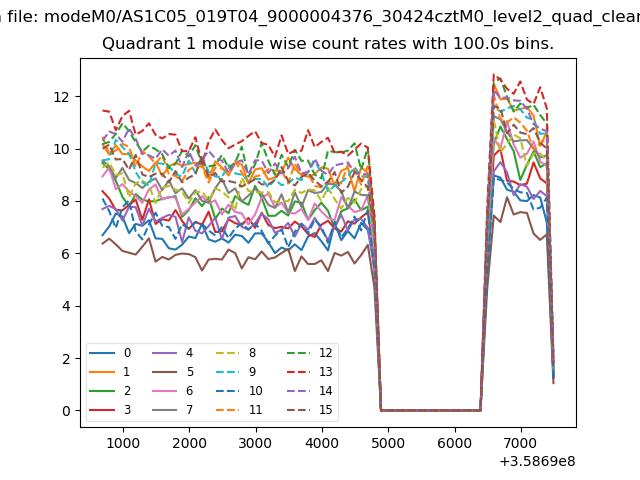
| Module-wise count rates for Quadrant A Data is divided into 100 sec bins |
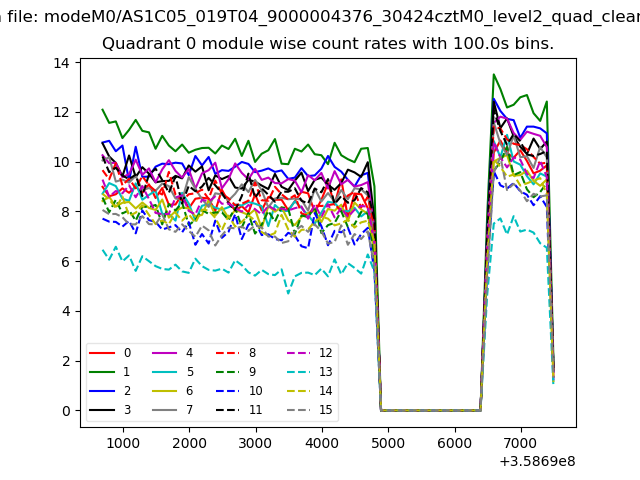 |
 |
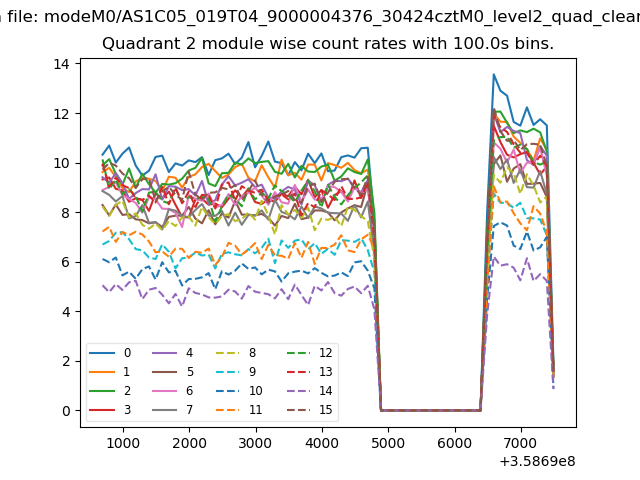
| Module-wise count rates for Quadrant B Data is divided into 100 sec bins |
 |
 |
| Module-wise count rates for Quadrant C Data is divided into 100 sec bins |
 |
 |
| Module-wise count rates for Quadrant D Data is divided into 100 sec bins |
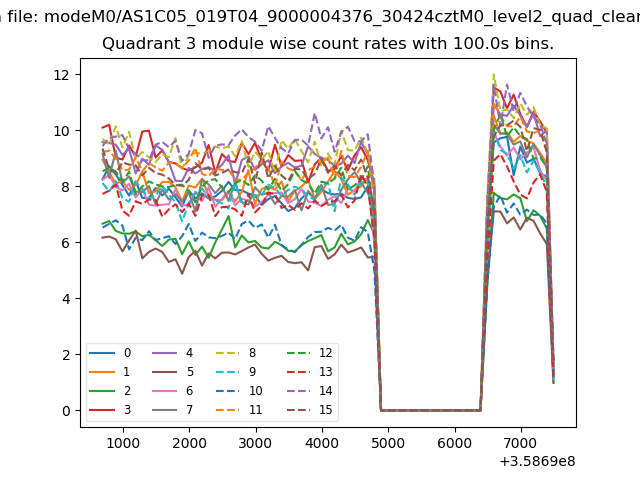 |
 |
| Parameter | Plot |
|---|---|
| CZT HV Monitor | 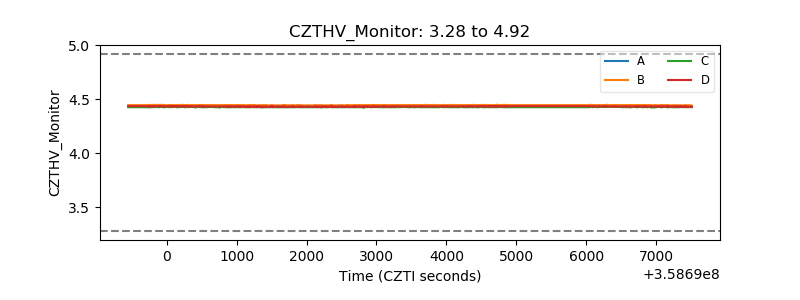 |
| D_VDD | 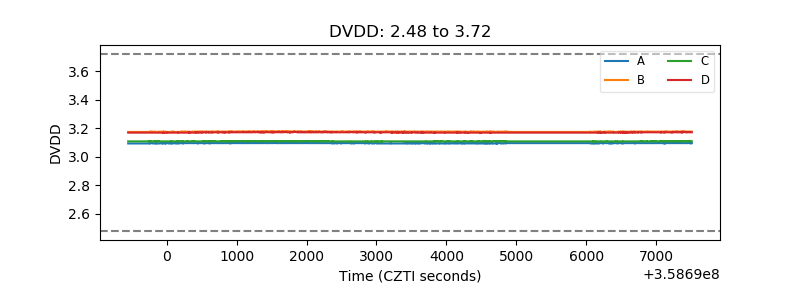 |
| Temperature 1 | 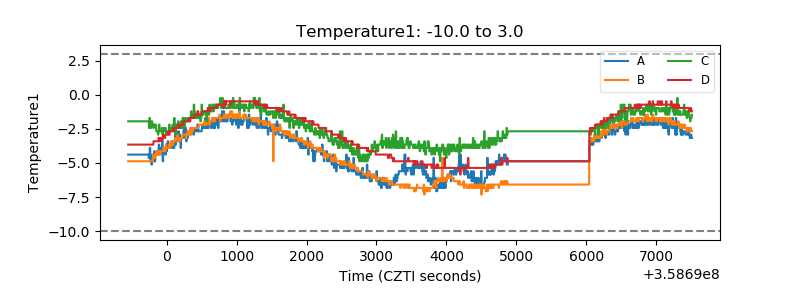 |
| Veto HV Monitor | 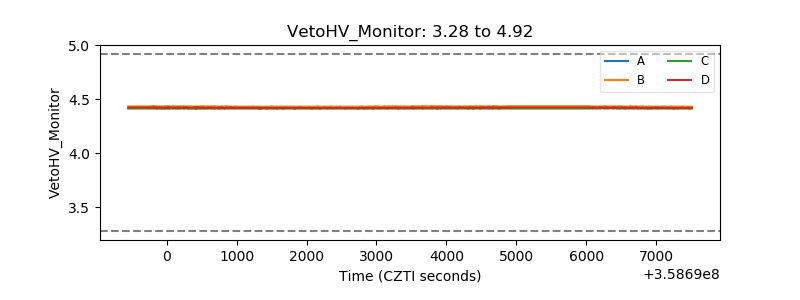 |
| Veto LLD | 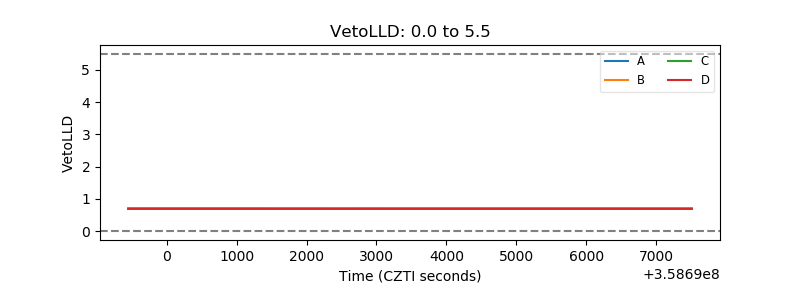 |
| Alpha Counter | 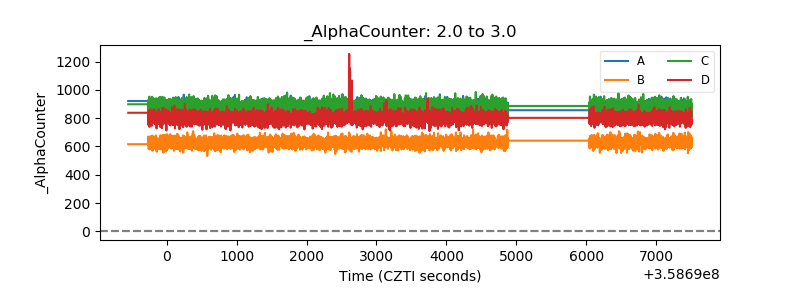 |
| _CPM_Rate |  |
| CZT Counter | 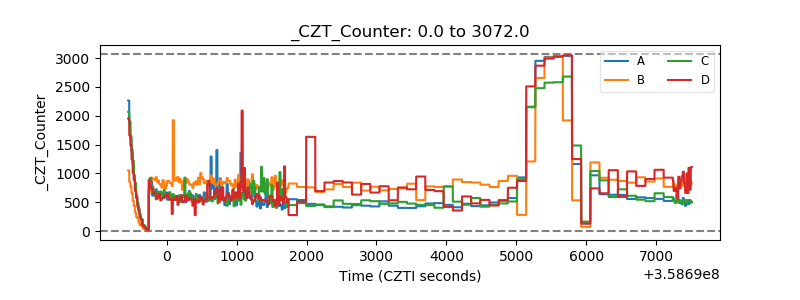 |
| +2.5 Volts monitor |  |
| +5 Volts monitor |  |
| _ROLL_ROT | 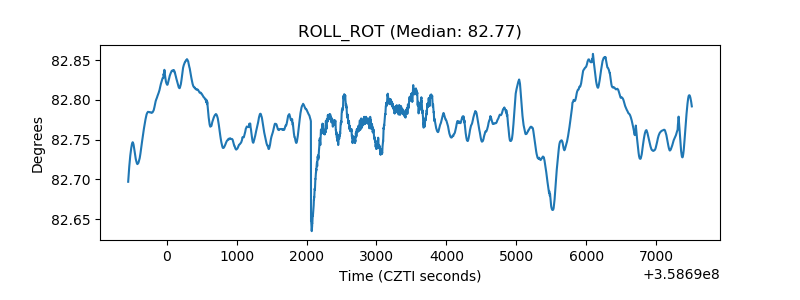 |
| _Roll_DEC | 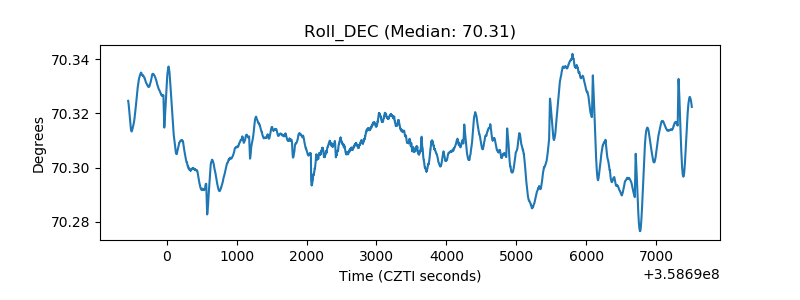 |
| _Roll_RA | 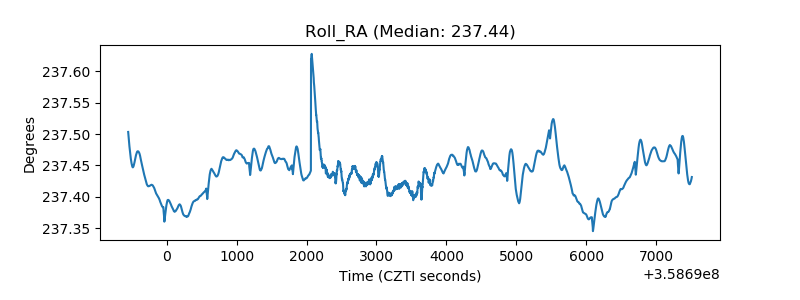 |
| Veto Counter | 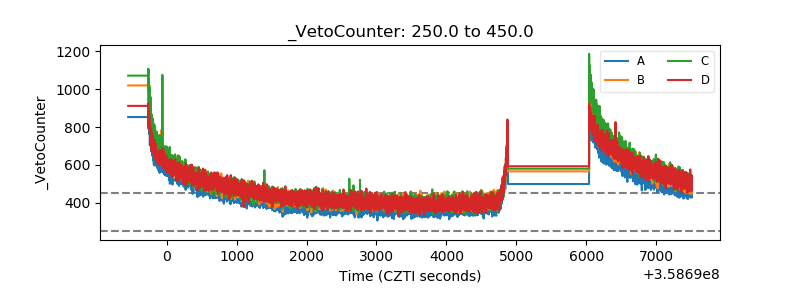 |