| Param | Original file | Final file |
|---|---|---|
| Filename | modeM0/AS1C05_019T04_9000004376_30425cztM0_level2.evt | modeM0/AS1C05_019T04_9000004376_30425cztM0_level2_quad_clean.evt |
| Size (bytes) | 313,162,560 | 73,048,320 |
| Size | 298.7 MB | 69.7 MB |
| Events in quadrant A | 1,793,911 | 502,321 |
| Events in quadrant B | 2,910,548 | 497,231 |
| Events in quadrant C | 1,986,000 | 484,714 |
| Events in quadrant D | 2,546,532 | 471,229 |
| Mode SS | |||
|---|---|---|---|
| Quadrant | BADHDUFLAG | Total packets | Discarded packets |
| A | 0 | 74 | 0 |
| B | 0 | 74 | 0 |
| C | 0 | 74 | 0 |
| D | 0 | 74 | 0 |
| Mode M0 | |||
|---|---|---|---|
| Quadrant | BADHDUFLAG | Total packets | Discarded packets |
| A | 0 | 7741 | 0 |
| B | 0 | 11061 | 0 |
| C | 0 | 8126 | 0 |
| D | 0 | 10024 | 0 |
| Quadrant | Total seconds | Saturated seconds | Saturation percentage |
|---|---|---|---|
| A | 3620 | 4 | 0.110497% |
| B | 3621 | 22 | 0.607567% |
| C | 3621 | 80 | 2.209334% |
| D | 3621 | 37 | 1.021817% |
Noise dominated data is calculated using 1-second bins in cleaned event files. If a bin has >2000 counts, and if more than 50% of those come from <1% of pixels, then it is considered to be noise-dominated and hence unusable.
| Quadrant | # 1 sec bins | Bins with >0 counts | Bins with >2000 counts | High rate bins dominated by noise | Noise dominated (total time) | Noise dominated (detector-on time) | Marked lightcurve |
|---|---|---|---|---|---|---|---|
| A | 3620 | 3620 | 0 | 0 | 0.00% | 0.00% | 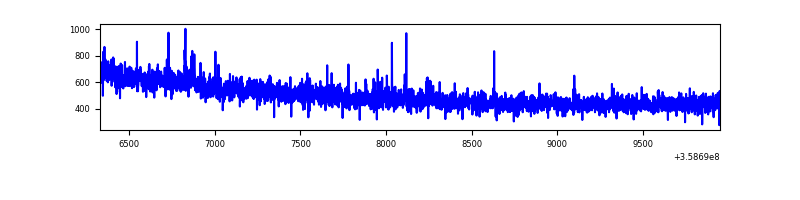 |
| B | 3621 | 3621 | 3 | 3 | 0.08% | 0.08% | 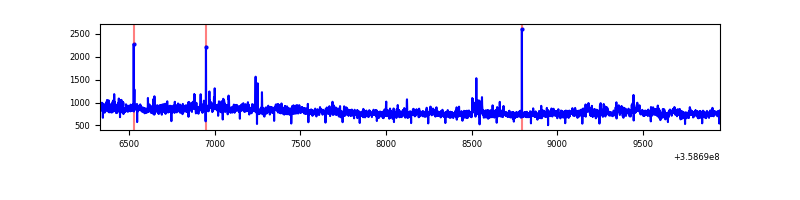 |
| C | 3621 | 3621 | 0 | 0 | 0.00% | 0.00% | 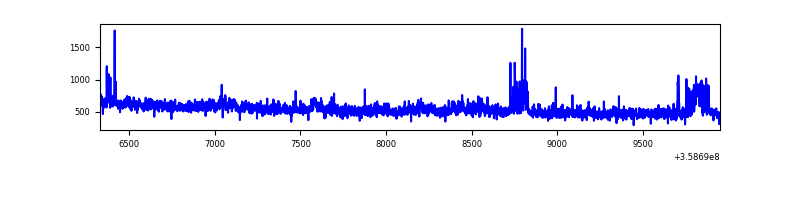 |
| D | 3621 | 3621 | 28 | 28 | 0.77% | 0.77% | 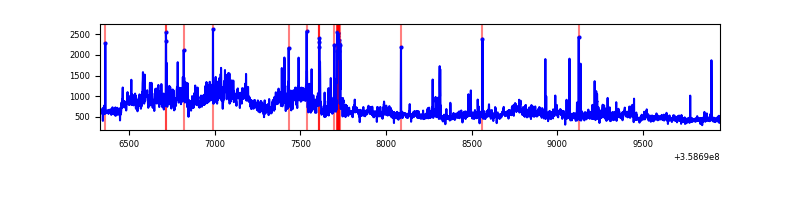 |
Top three noisy pixels from each quadrant. If the there are fewer than three noisy pixels in the level2.evt file, extra rows are filled as -1
| Pixel properties | Quadrant properties | ||||||
|---|---|---|---|---|---|---|---|
| Quadrant | DetID | PixID | Counts | Sigma | Mean | Median | Sigma |
| A | 0 | 13 | 37413 | 404.06 | 455 | 446 | 91.5 |
| A | 13 | 254 | 6953 | 71.12 | 455 | 446 | 91.5 |
| A | 3 | 137 | 4147 | 40.45 | 455 | 446 | 91.5 |
| B | 6 | 159 | 1015997 | 11944.46 | 449 | 438 | 85.0 |
| B | 0 | 229 | 105820 | 1239.45 | 449 | 438 | 85.0 |
| B | 4 | 80 | 11865 | 134.4 | 449 | 438 | 85.0 |
| C | 3 | 233 | 92922 | 893.26 | 444 | 447 | 103.5 |
| C | 14 | 238 | 92555 | 889.71 | 444 | 447 | 103.5 |
| C | 10 | 22 | 35075 | 334.49 | 444 | 447 | 103.5 |
| D | 13 | 104 | 460325 | 4358.52 | 446 | 435 | 105.5 |
| D | 12 | 227 | 159170 | 1504.38 | 446 | 435 | 105.5 |
| D | 8 | 195 | 102952 | 971.59 | 446 | 435 | 105.5 |
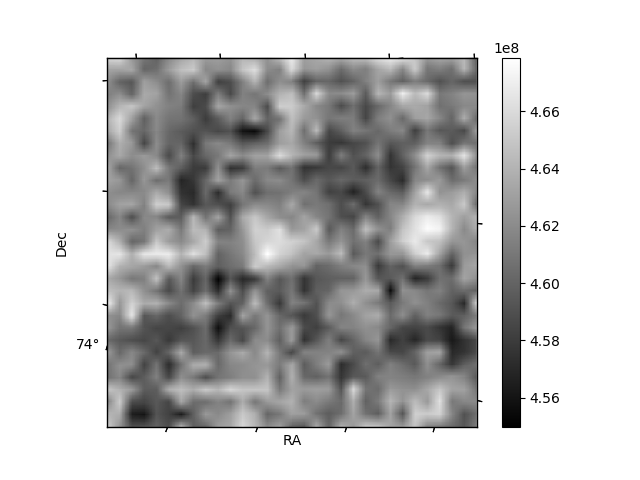
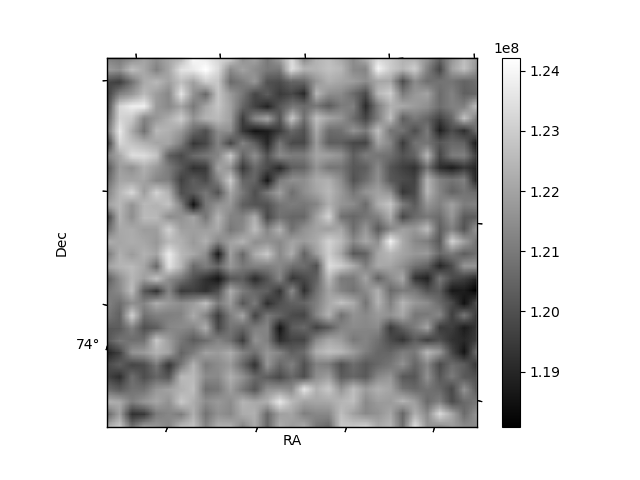
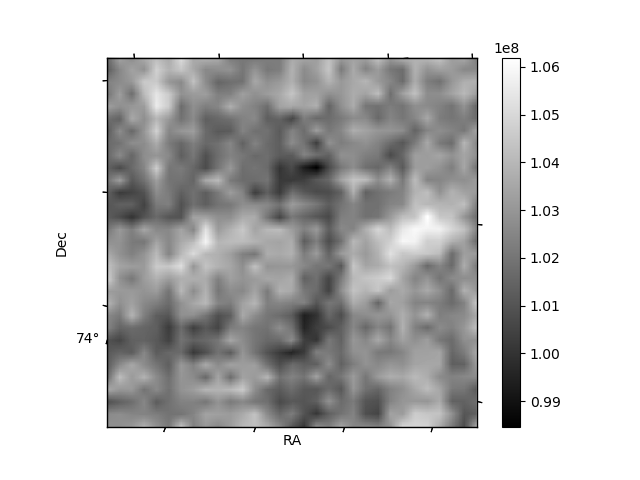
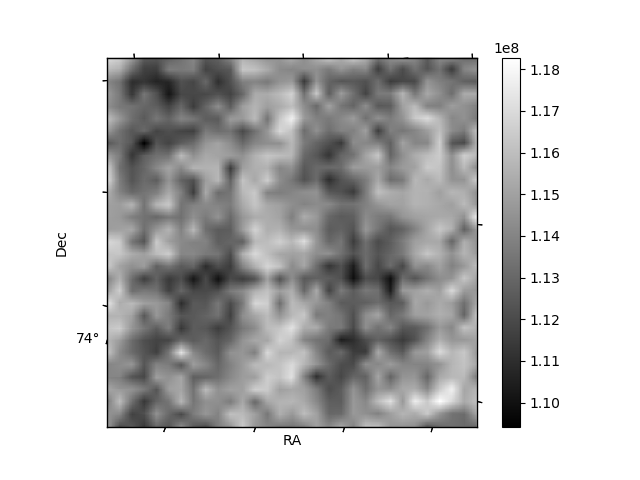
Histogram calculated using DETX and DETY for each event in the final _common_clean file
| Quadrant A | 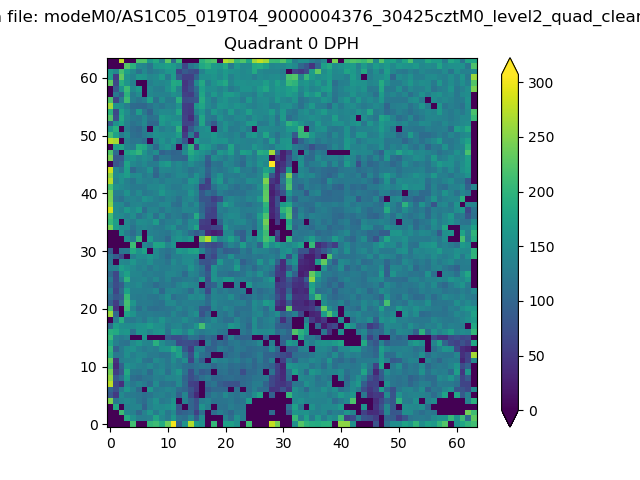 |
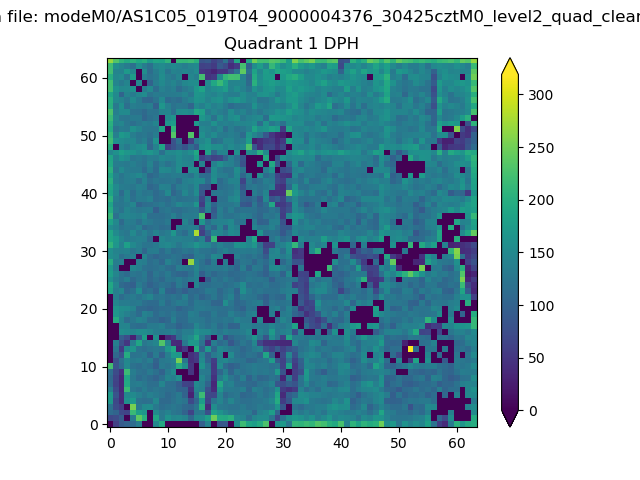 |
Quadrant B |
|---|---|---|---|
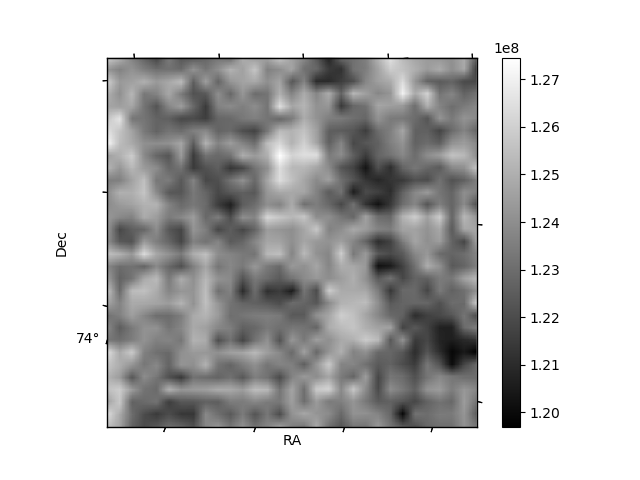
| Quadrant D | 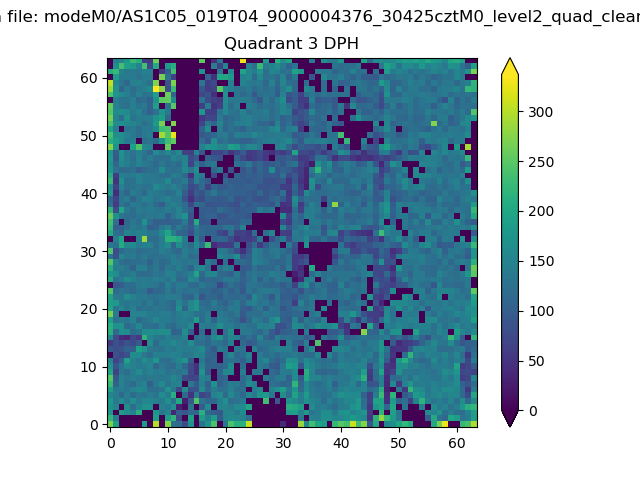 |
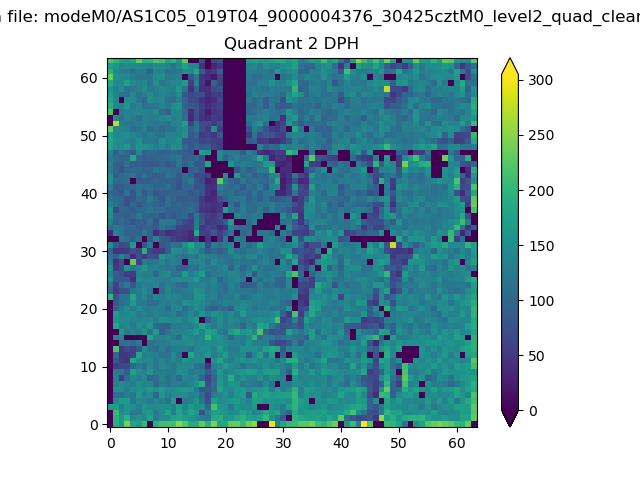 |
Quadrant C |
| Plot type | Count rate plots | Images |
|---|---|---|
| Comparison with Poisson distribution Blue bars denote a histogram of data divided into 1 sec bins. Red curve is a Poisson curve with rate = median count rate of data. |
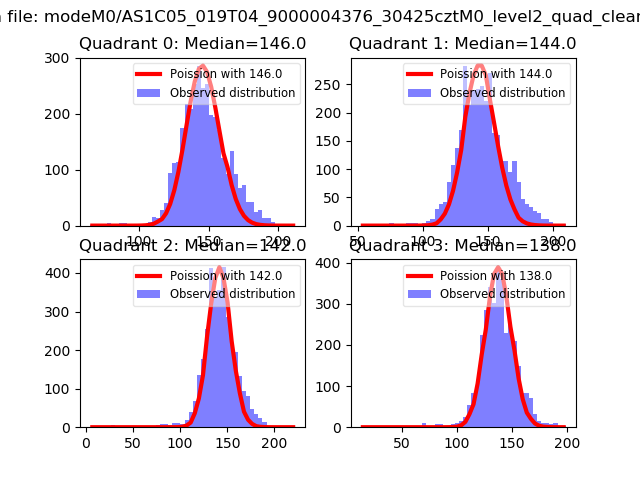 |
 |
| Quadrant-wise count rates Data is divided into 100 sec bins |
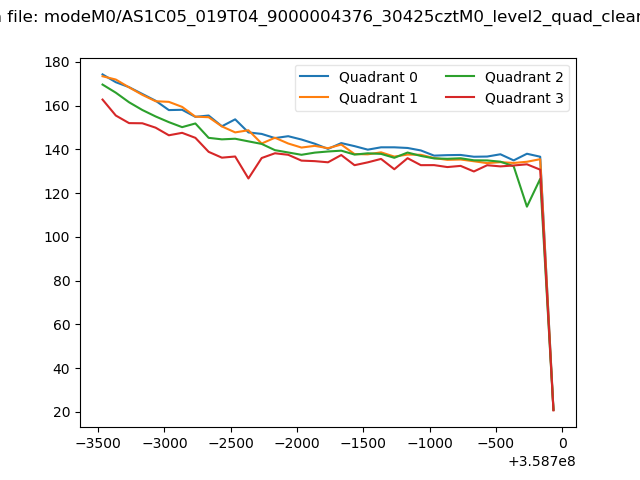 |
|
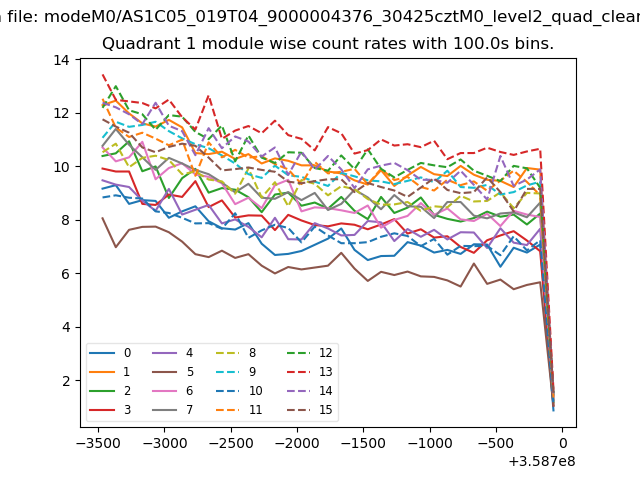
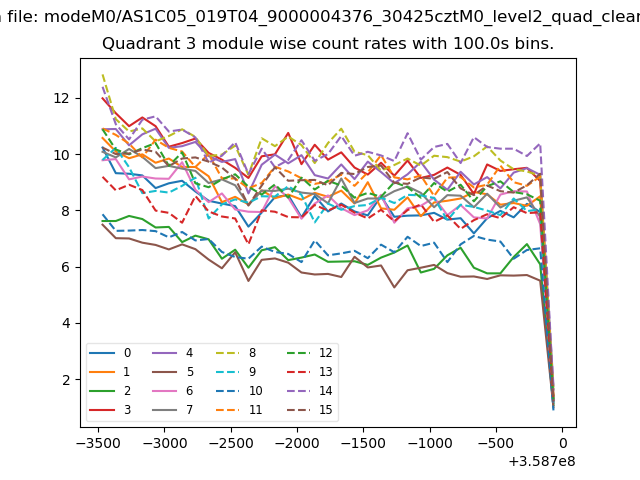
| Module-wise count rates for Quadrant A Data is divided into 100 sec bins |
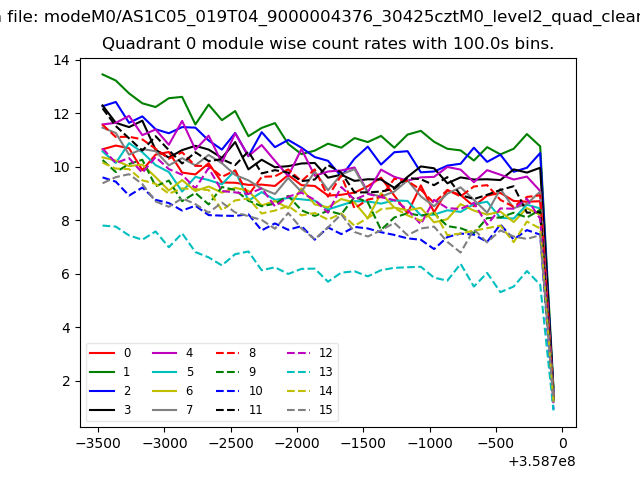 |
 |
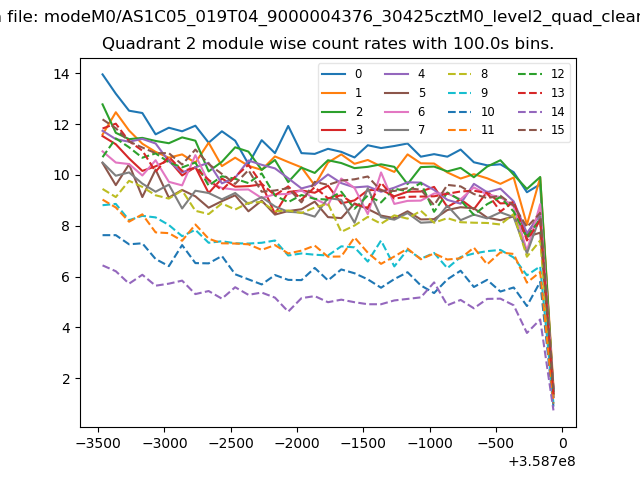
| Module-wise count rates for Quadrant B Data is divided into 100 sec bins |
 |
 |
| Module-wise count rates for Quadrant C Data is divided into 100 sec bins |
 |
 |
| Module-wise count rates for Quadrant D Data is divided into 100 sec bins |
 |
 |
| Parameter | Plot |
|---|---|
| CZT HV Monitor | 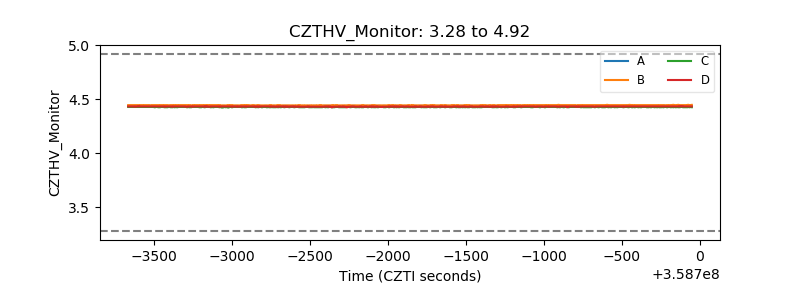 |
| D_VDD | 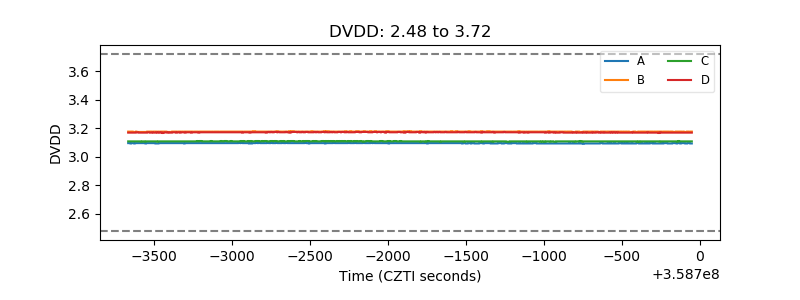 |
| Temperature 1 | 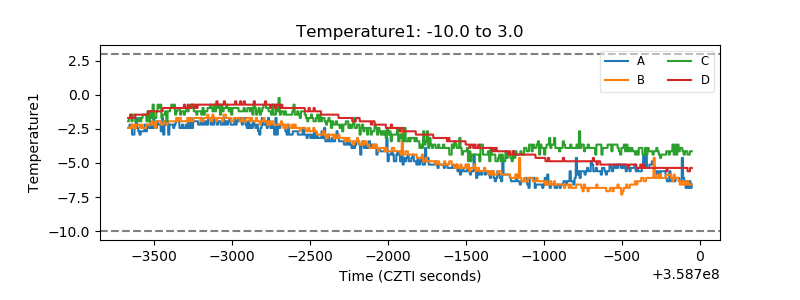 |
| Veto HV Monitor | 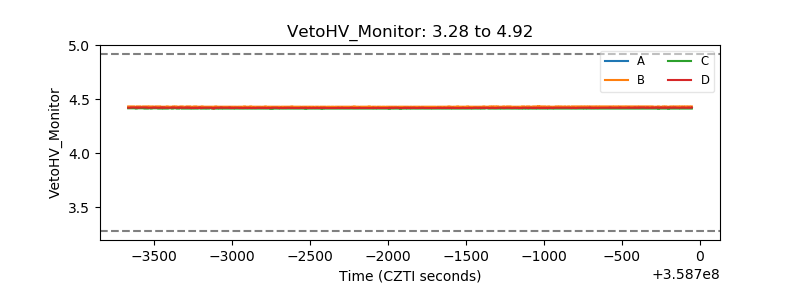 |
| Veto LLD | 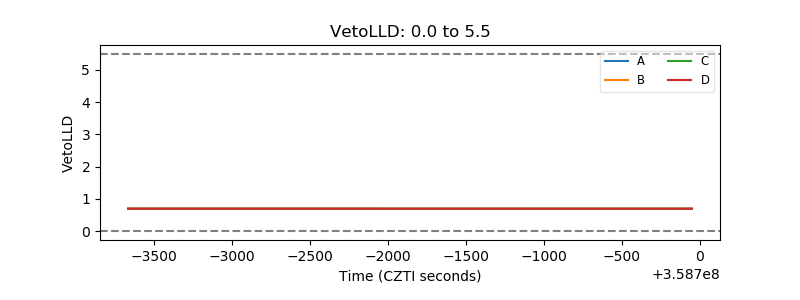 |
| Alpha Counter | 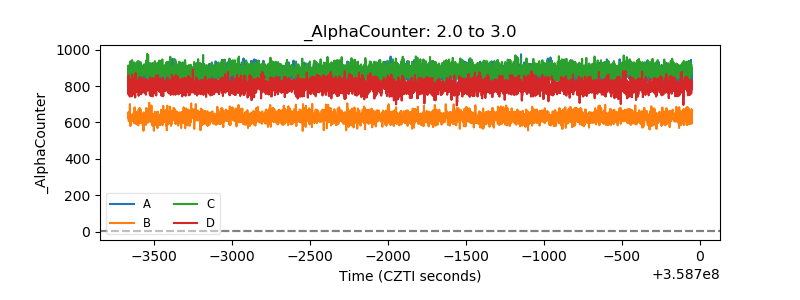 |
| _CPM_Rate | 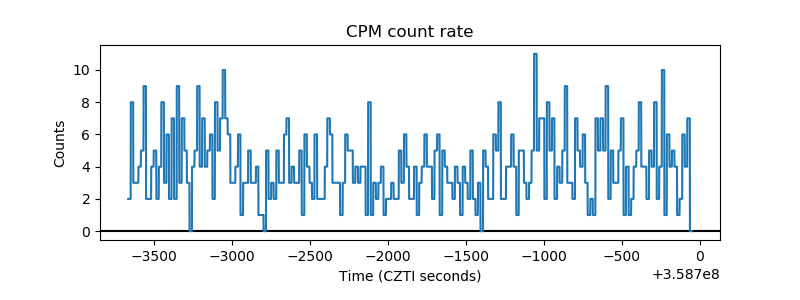 |
| CZT Counter | 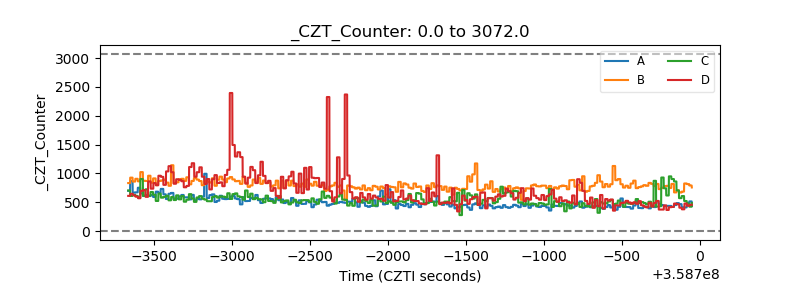 |
| +2.5 Volts monitor | 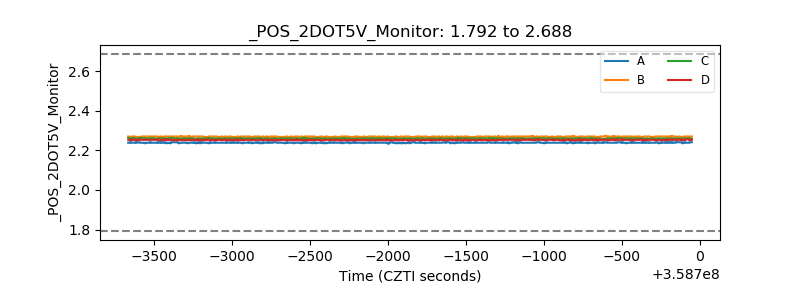 |
| +5 Volts monitor | 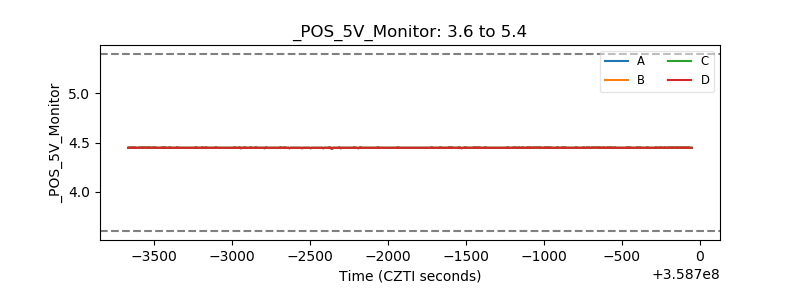 |
| _ROLL_ROT | 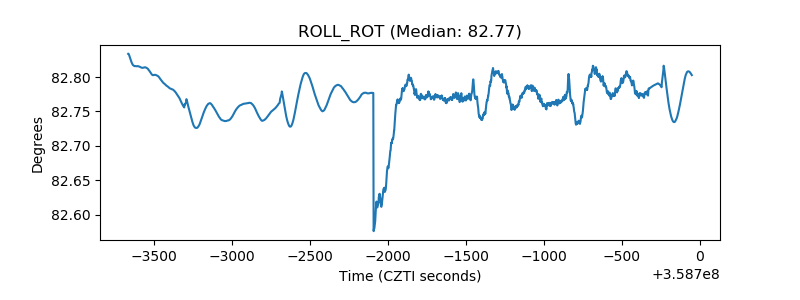 |
| _Roll_DEC | 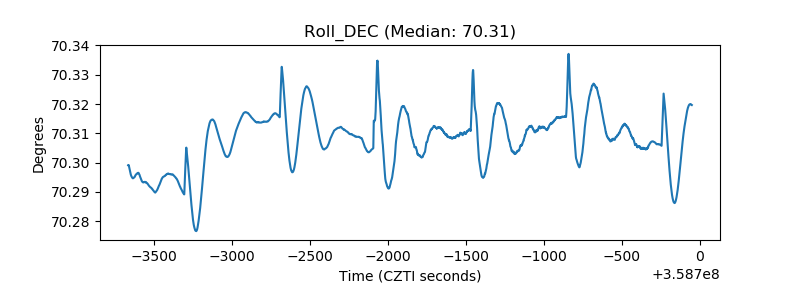 |
| _Roll_RA | 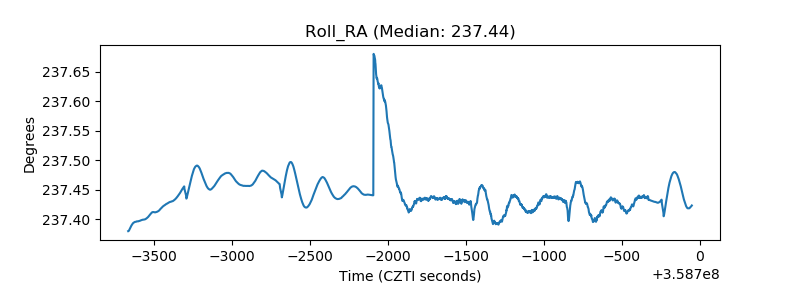 |
| Veto Counter | 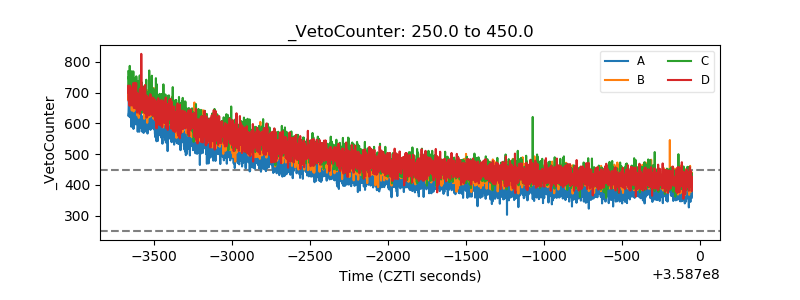 |