| Param | Original file | Final file |
|---|---|---|
| Filename | modeM0/AS1A10_121T02_9000004378cztM0_level2.fits | modeM0/AS1A10_121T02_9000004378cztM0_level2_quad_clean.evt |
| Size (bytes) | 2,550,758,400 | 1,792,103,040 |
| Size | 2.4 GB | 1.7 GB |
| Events in quadrant A | 17,700,249 | 10,856,484 |
| Events in quadrant B | 15,870,065 | 11,012,224 |
| Events in quadrant C | 16,302,995 | 10,543,417 |
| Events in quadrant D | 14,435,959 | 8,920,856 |
| Mode M0 | |||
|---|---|---|---|
| Quadrant | BADHDUFLAG | Total packets | Discarded packets |
| A | 0 | 408244 | 0 |
| B | 0 | 579793 | 0 |
| C | 0 | 439655 | 0 |
| D | 0 | 576531 | 0 |
| Mode SS | |||
|---|---|---|---|
| Quadrant | BADHDUFLAG | Total packets | Discarded packets |
| A | 0 | 3814 | 0 |
| B | 0 | 3814 | 0 |
| C | 0 | 3918 | 0 |
| D | 0 | 3814 | 0 |
| Mode M9 | |||
|---|---|---|---|
| Quadrant | BADHDUFLAG | Total packets | Discarded packets |
| A | 0 | 308 | 0 |
| B | 0 | 308 | 0 |
| C | 0 | 308 | 0 |
| D | 0 | 308 | 0 |
| Quadrant | Total seconds | Saturated seconds | Saturation percentage |
|---|---|---|---|
| A | 189542 | 2519 | 1.328993% |
| B | 188630 | 4251 | 2.253618% |
| C | 188657 | 6067 | 3.215889% |
| D | 189085 | 19220 | 10.164741% |
Noise dominated data is calculated using 1-second bins in cleaned event files. If a bin has >2000 counts, and if more than 50% of those come from <1% of pixels, then it is considered to be noise-dominated and hence unusable.
| Quadrant | # 1 sec bins | Bins with >0 counts | Bins with >2000 counts | High rate bins dominated by noise | Noise dominated (total time) | Noise dominated (detector-on time) | Marked lightcurve |
|---|---|---|---|---|---|---|---|
| A | 232107 | 190678 | 0 | 0 | 0.00% | 0.00% |  |
| B | 232107 | 188621 | 0 | 0 | 0.00% | 0.00% |  |
| C | 232107 | 189105 | 0 | 0 | 0.00% | 0.00% | 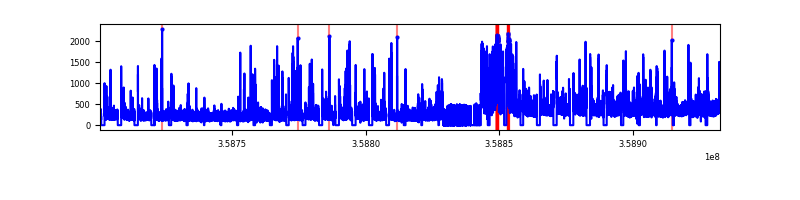 |
| D | 232107 | 189322 | 0 | 0 | 0.00% | 0.00% | 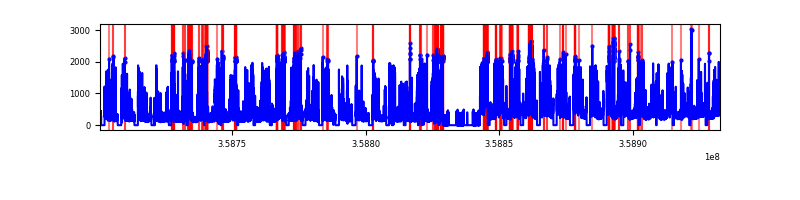 |
Top three noisy pixels from each quadrant. If the there are fewer than three noisy pixels in the level2.evt file, extra rows are filled as -1
| Pixel properties | Quadrant properties | ||||||
|---|---|---|---|---|---|---|---|
| Quadrant | DetID | PixID | Counts | Sigma | Mean | Median | Sigma |
| A | 0 | 29 | 10824 | 6.76 | 4651 | 4456 | 941.6 |
| A | 7 | 110 | 10176 | 6.07 | 4651 | 4456 | 941.6 |
| A | 14 | 95 | 10025 | 5.91 | 4651 | 4456 | 941.6 |
| B | 2 | 9 | 9990 | 7.44 | 4235 | 4086 | 793.7 |
| B | 5 | 232 | 9497 | 6.82 | 4235 | 4086 | 793.7 |
| B | 5 | 225 | 8548 | 5.62 | 4235 | 4086 | 793.7 |
| C | 3 | 203 | 11182 | 7.04 | 4341 | 4202 | 991.9 |
| C | 9 | 209 | 10736 | 6.59 | 4341 | 4202 | 991.9 |
| C | 3 | 202 | 10560 | 6.41 | 4341 | 4202 | 991.9 |
| D | 15 | 46 | 8817 | 5.21 | 4165 | 3931 | 937.8 |
| D | 6 | 231 | 8730 | 5.12 | 4165 | 3931 | 937.8 |
| D | -1 | -1 | -1 | -1.0 | 4165 | 3931 | 937.8 |
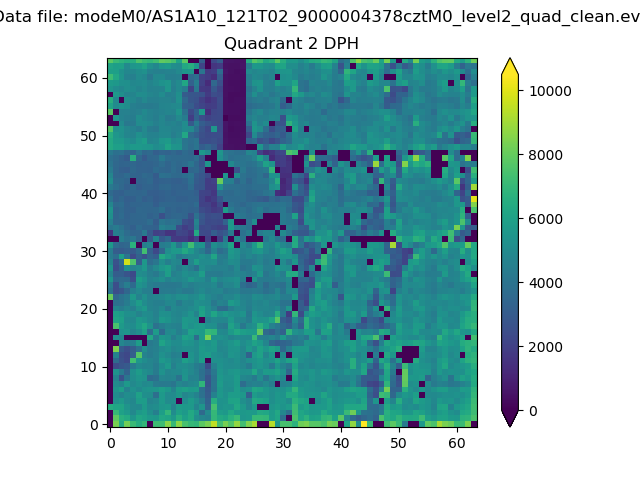
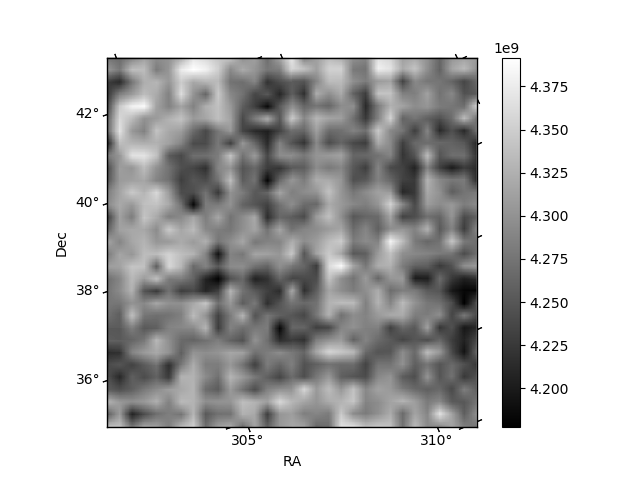
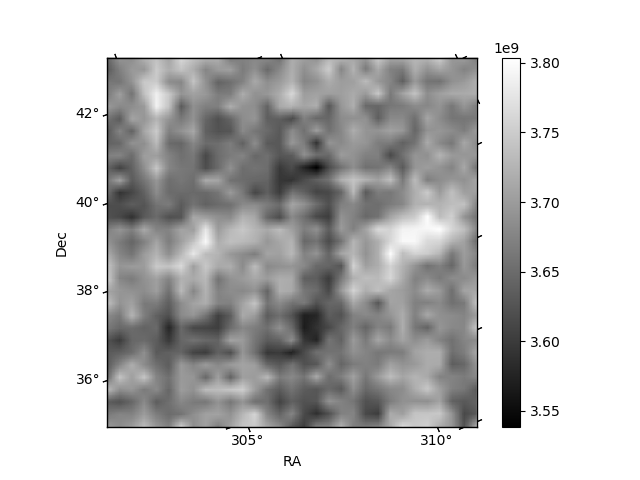
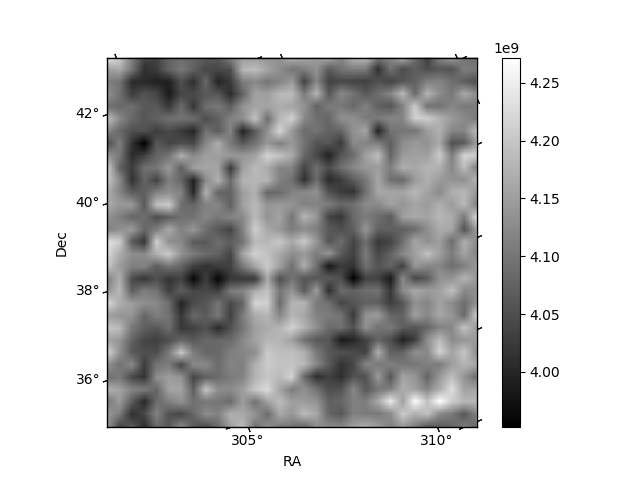
Histogram calculated using DETX and DETY for each event in the final _common_clean file
| Quadrant A | 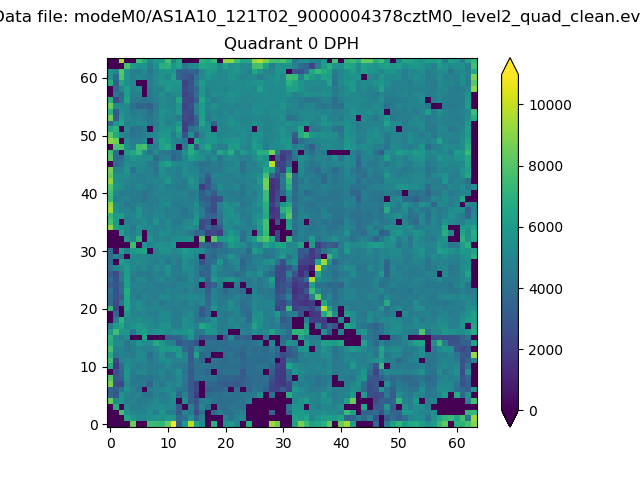 |
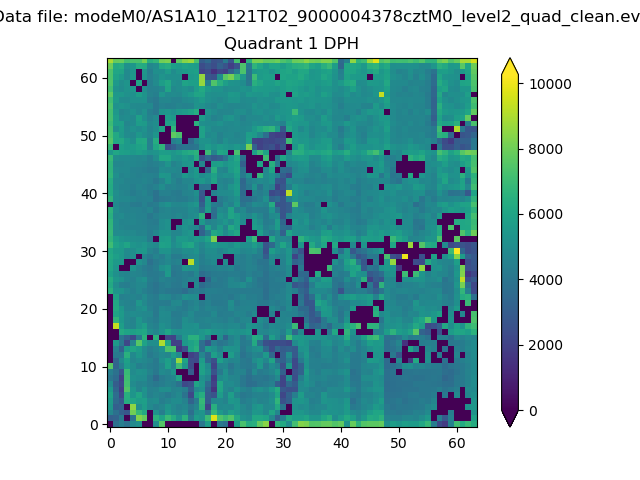 |
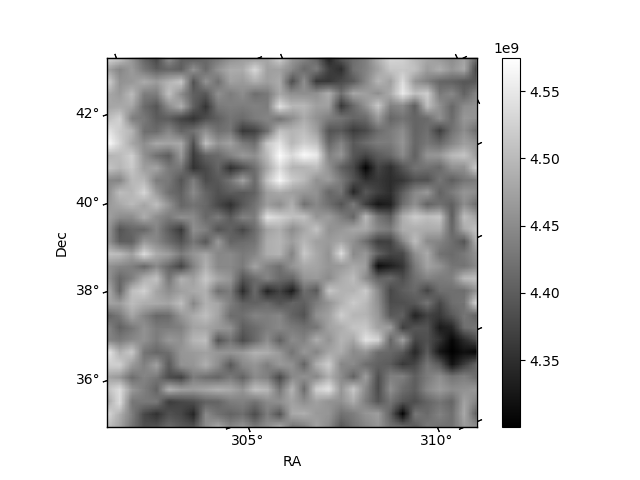
Quadrant B |
|---|---|---|---|
| Quadrant D | 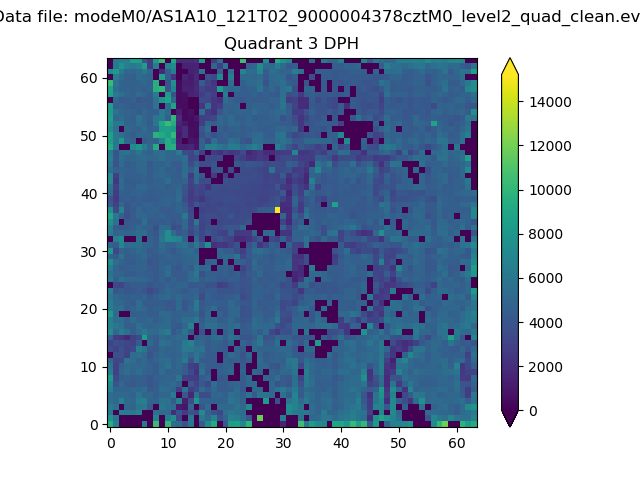 |
 |
Quadrant C |
| Plot type | Count rate plots | Images |
|---|---|---|
| Comparison with Poisson distribution Blue bars denote a histogram of data divided into 1 sec bins. Red curve is a Poisson curve with rate = median count rate of data. |
 |
 |
| Quadrant-wise count rates Data is divided into 100 sec bins |
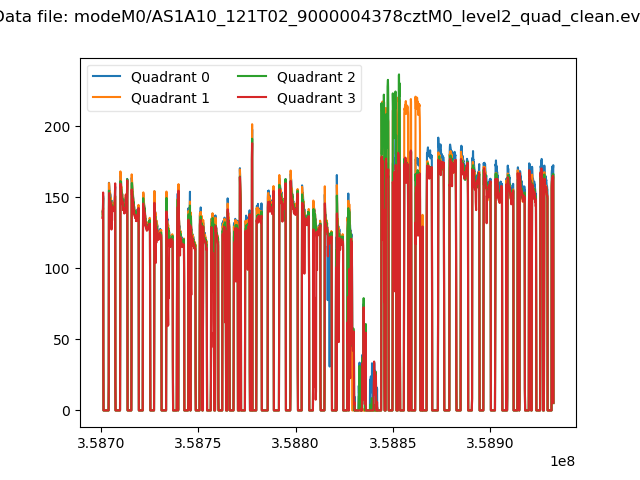 |
|
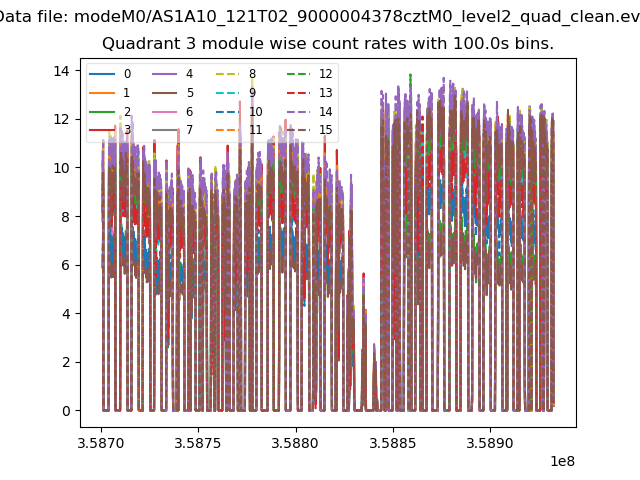
| Module-wise count rates for Quadrant A Data is divided into 100 sec bins |
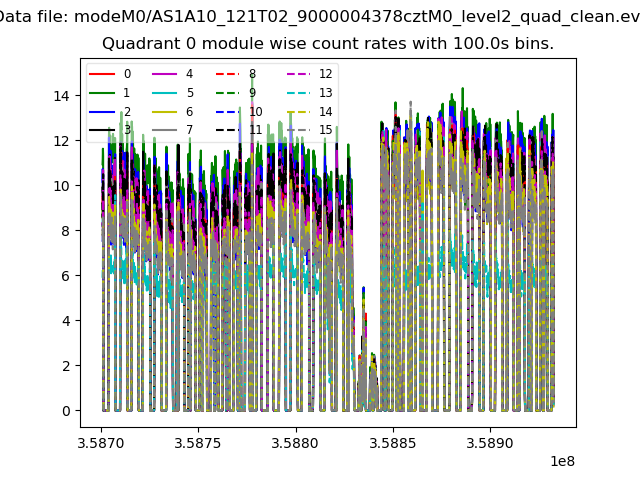 |
 |
| Module-wise count rates for Quadrant B Data is divided into 100 sec bins |
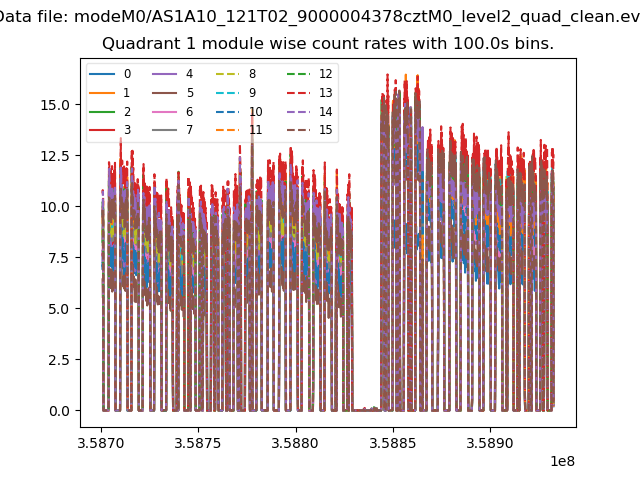 |
 |
| Module-wise count rates for Quadrant C Data is divided into 100 sec bins |
 |
 |
| Module-wise count rates for Quadrant D Data is divided into 100 sec bins |
 |
 |
| Parameter | Plot |
|---|---|
| CZT HV Monitor | 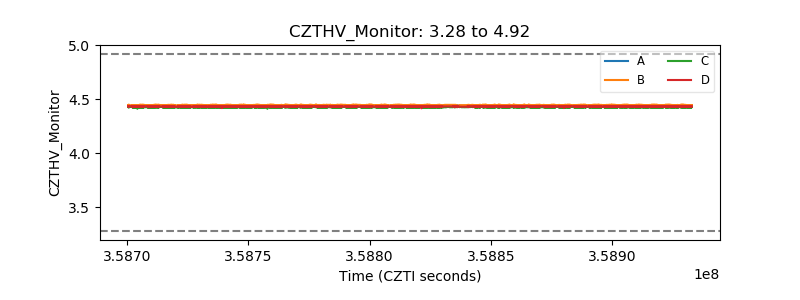 |
| D_VDD | 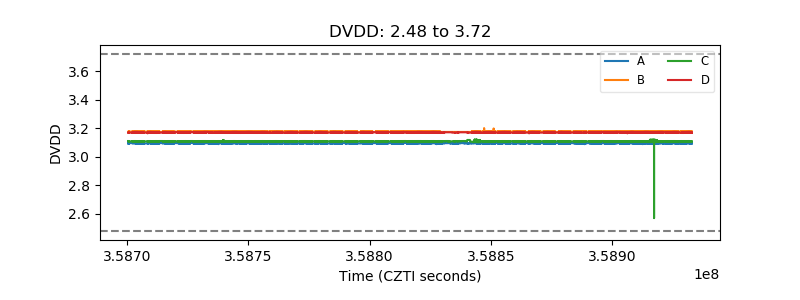 |
| Temperature 1 |  |
| Veto HV Monitor |  |
| Veto LLD | 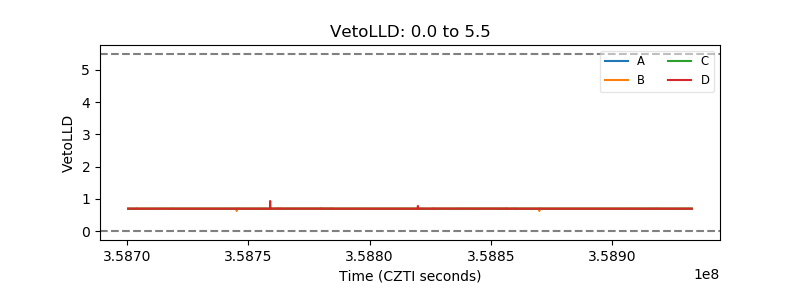 |
| Alpha Counter |  |
| _CPM_Rate | 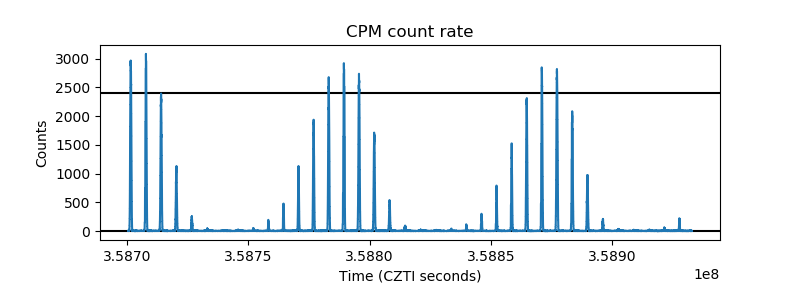 |
| CZT Counter | 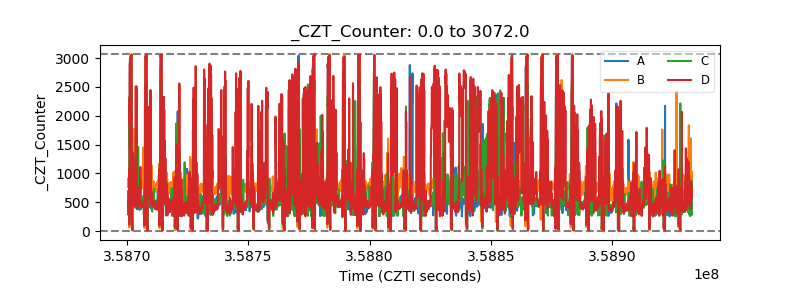 |
| +2.5 Volts monitor | 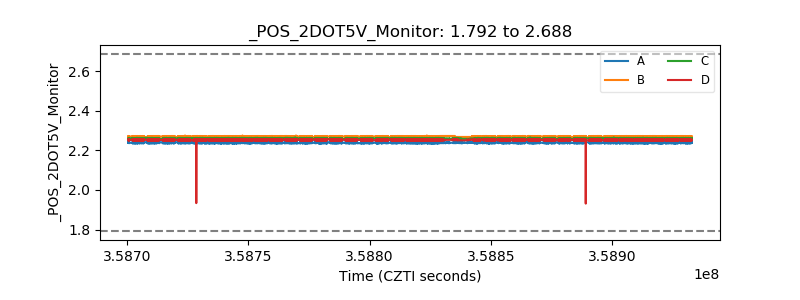 |
| +5 Volts monitor |  |
| _ROLL_ROT | 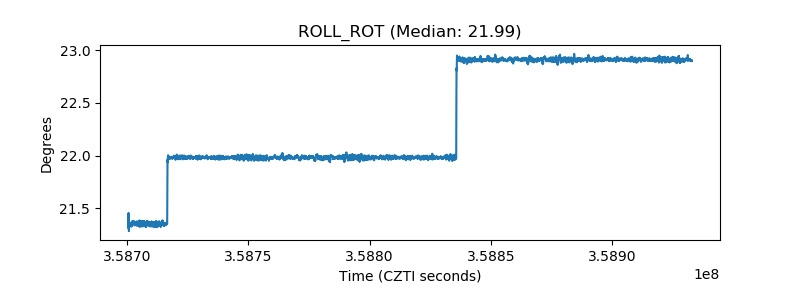 |
| _Roll_DEC | 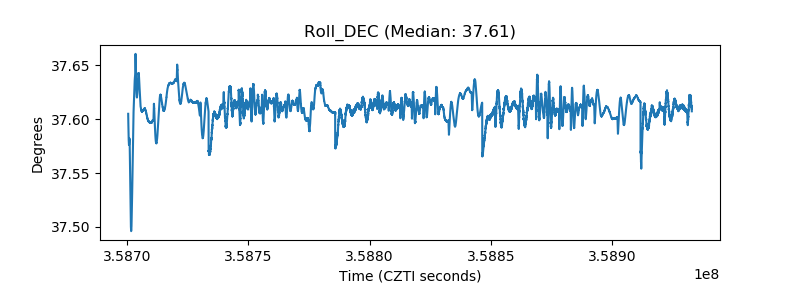 |
| _Roll_RA | 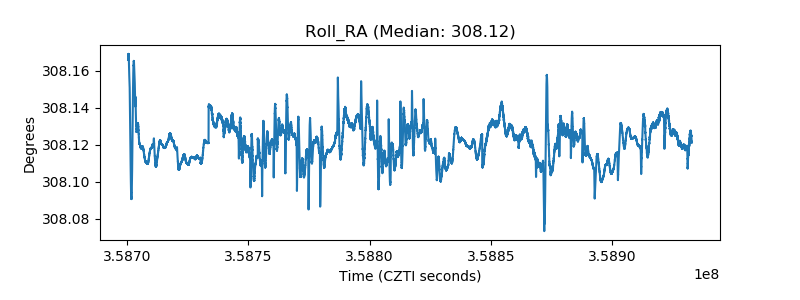 |
| Veto Counter | 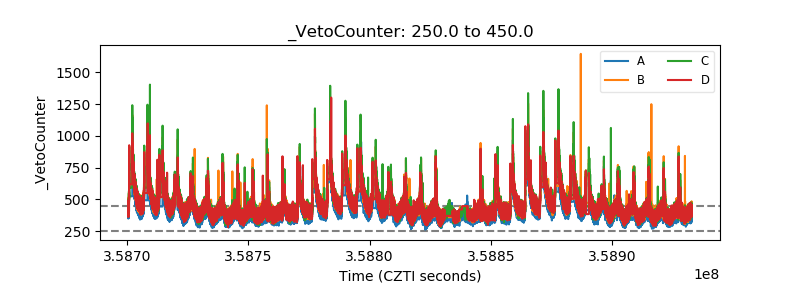 |