| Param | Original file | Final file |
|---|---|---|
| Filename | modeM0/AS1A10_121T02_9000004378_30425cztM0_level2.evt | modeM0/AS1A10_121T02_9000004378_30425cztM0_level2_quad_clean.evt |
| Size (bytes) | 174,133,440 | 12,257,280 |
| Size | 166.1 MB | 11.7 MB |
| Events in quadrant A | 1,116,805 | 60,915 |
| Events in quadrant B | 1,634,155 | 60,012 |
| Events in quadrant C | 1,188,588 | 60,212 |
| Events in quadrant D | 1,212,507 | 60,359 |
| Mode M0 | |||
|---|---|---|---|
| Quadrant | BADHDUFLAG | Total packets | Discarded packets |
| A | 0 | 4613 | 1 |
| B | 0 | 6090 | 1 |
| C | 0 | 4932 | 1 |
| D | 0 | 4966 | 1 |
| Mode SS | |||
|---|---|---|---|
| Quadrant | BADHDUFLAG | Total packets | Discarded packets |
| A | 0 | 36 | 0 |
| B | 0 | 36 | 0 |
| C | 0 | 36 | 0 |
| D | 0 | 36 | 0 |
| Mode M9 | |||
|---|---|---|---|
| Quadrant | BADHDUFLAG | Total packets | Discarded packets |
| A | 0 | 13 | 0 |
| B | 0 | 13 | 0 |
| C | 0 | 13 | 0 |
| D | 0 | 13 | 0 |
| Quadrant | Total seconds | Saturated seconds | Saturation percentage |
|---|---|---|---|
| A | 1764 | 69 | 3.911565% |
| B | 1764 | 112 | 6.349206% |
| C | 1764 | 112 | 6.349206% |
| D | 1764 | 65 | 3.684807% |
Noise dominated data is calculated using 1-second bins in cleaned event files. If a bin has >2000 counts, and if more than 50% of those come from <1% of pixels, then it is considered to be noise-dominated and hence unusable.
| Quadrant | # 1 sec bins | Bins with >0 counts | Bins with >2000 counts | High rate bins dominated by noise | Noise dominated (total time) | Noise dominated (detector-on time) | Marked lightcurve |
|---|---|---|---|---|---|---|---|
| A | 3024 | 1764 | 3 | 3 | 0.10% | 0.17% | 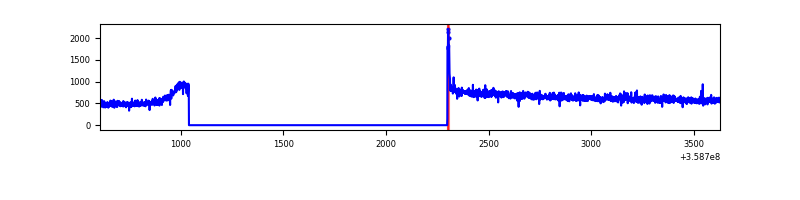 |
| B | 3024 | 1764 | 0 | 0 | 0.00% | 0.00% | 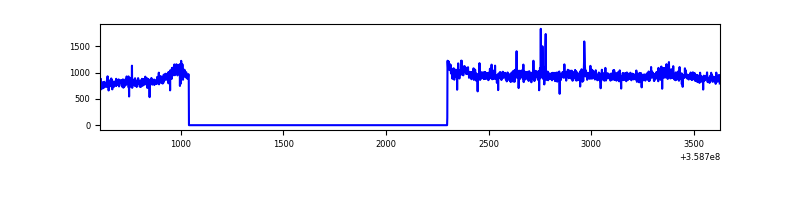 |
| C | 3024 | 1764 | 0 | 0 | 0.00% | 0.00% | 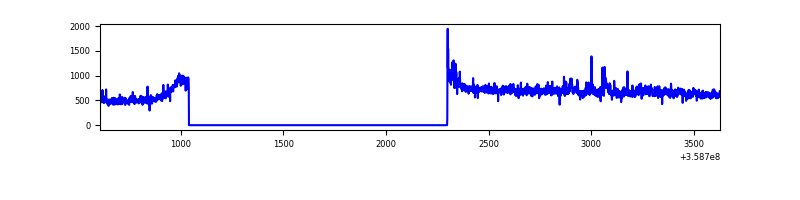 |
| D | 3024 | 1764 | 11 | 11 | 0.36% | 0.62% | 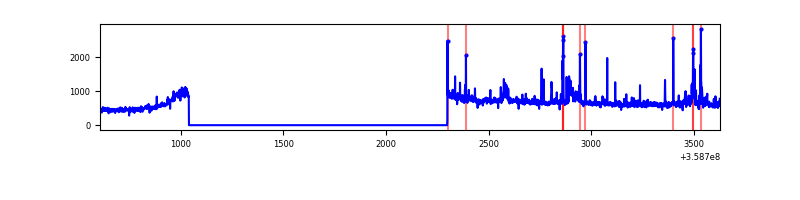 |
Top three noisy pixels from each quadrant. If the there are fewer than three noisy pixels in the level2.evt file, extra rows are filled as -1
| Pixel properties | Quadrant properties | ||||||
|---|---|---|---|---|---|---|---|
| Quadrant | DetID | PixID | Counts | Sigma | Mean | Median | Sigma |
| A | 8 | 192 | 12699 | 214.84 | 284 | 279 | 57.8 |
| A | 0 | 13 | 7134 | 118.58 | 284 | 279 | 57.8 |
| A | 13 | 254 | 3303 | 52.31 | 284 | 279 | 57.8 |
| B | 6 | 159 | 505510 | 9514.39 | 278 | 271 | 53.1 |
| B | 0 | 229 | 16436 | 304.4 | 278 | 271 | 53.1 |
| B | 4 | 80 | 11233 | 206.42 | 278 | 271 | 53.1 |
| C | 3 | 233 | 63432 | 993.11 | 271 | 273 | 63.6 |
| C | 14 | 238 | 48309 | 755.31 | 271 | 273 | 63.6 |
| C | 0 | 10 | 10800 | 165.53 | 271 | 273 | 63.6 |
| D | 8 | 195 | 52950 | 760.82 | 277 | 271 | 69.2 |
| D | 13 | 104 | 31135 | 445.76 | 277 | 271 | 69.2 |
| D | 13 | 249 | 27110 | 387.62 | 277 | 271 | 69.2 |
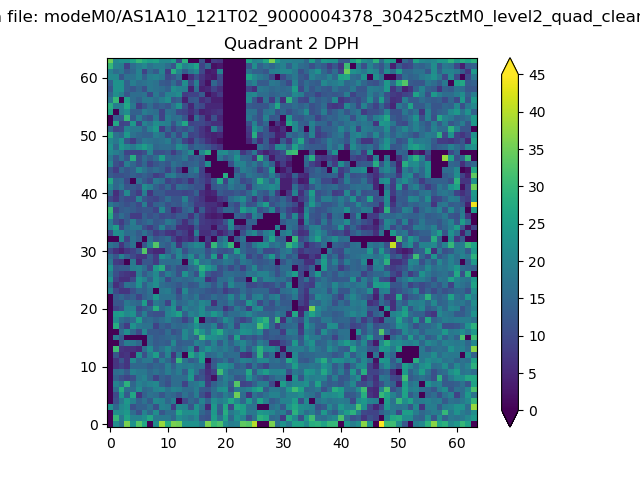
Histogram calculated using DETX and DETY for each event in the final _common_clean file
| Quadrant A | 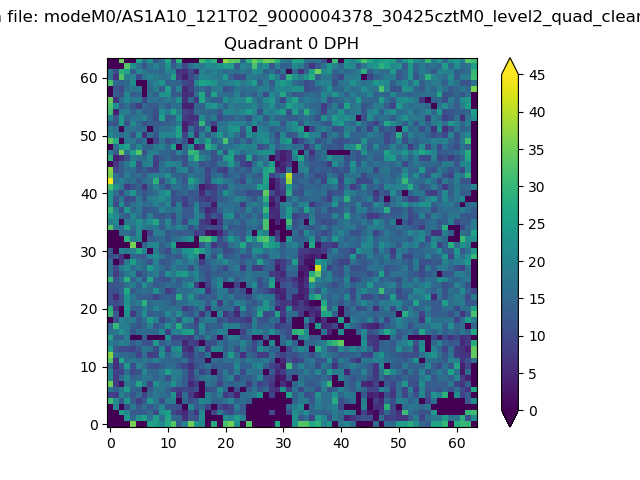 |
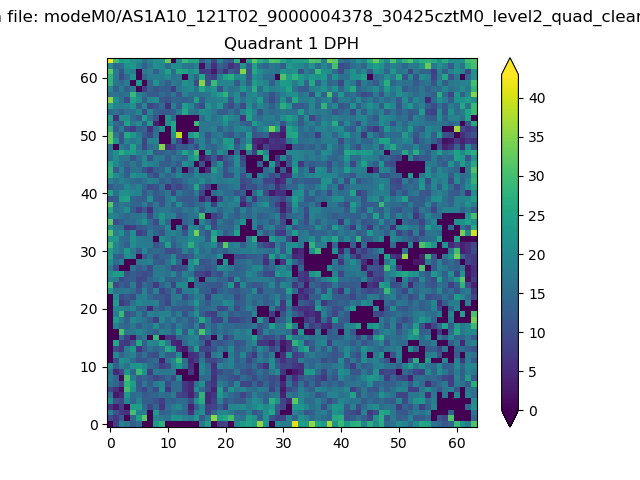 |
Quadrant B |
|---|---|---|---|
| Quadrant D | 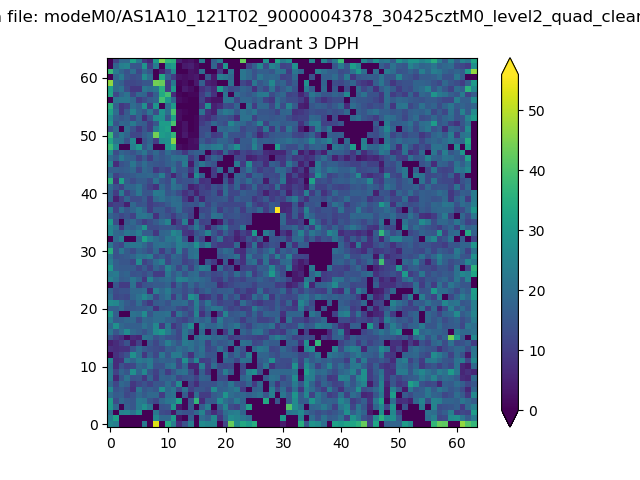 |
 |
Quadrant C |
| Plot type | Count rate plots | Images |
|---|---|---|
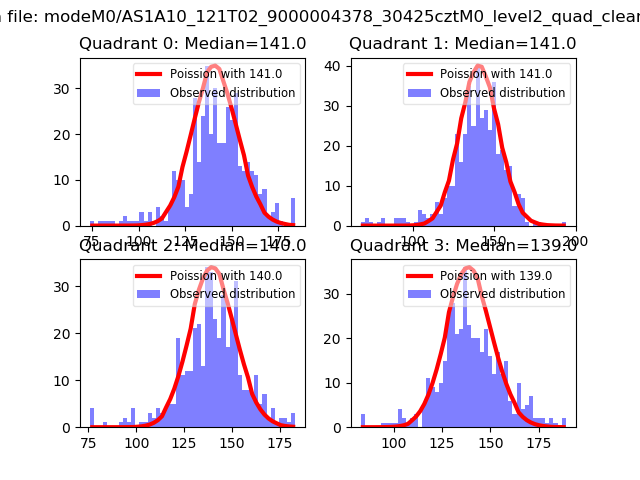
| Comparison with Poisson distribution Blue bars denote a histogram of data divided into 1 sec bins. Red curve is a Poisson curve with rate = median count rate of data. |
 |
 |
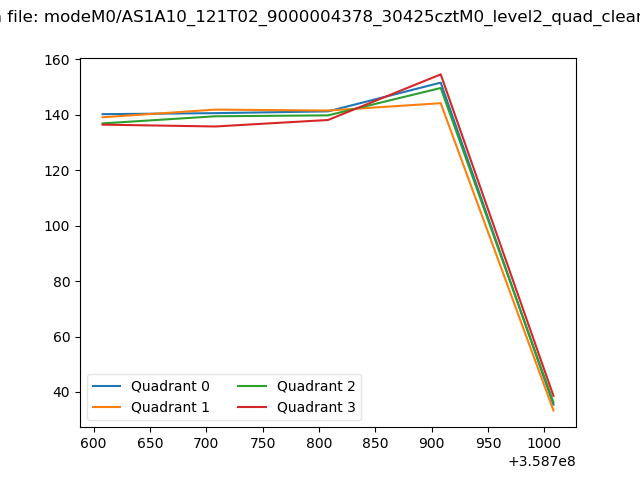
| Quadrant-wise count rates Data is divided into 100 sec bins |
 |
|
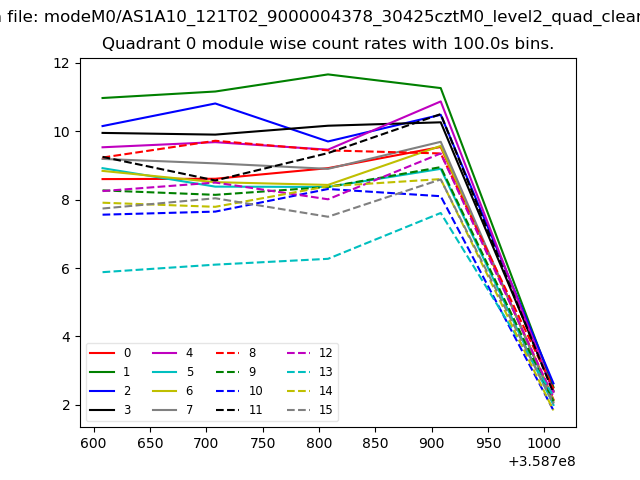
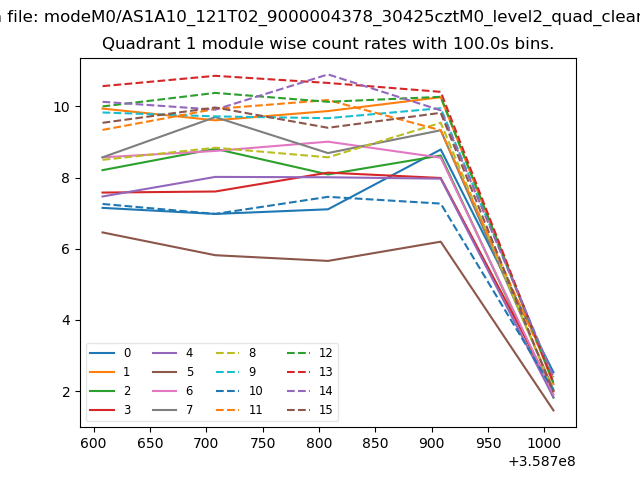
| Module-wise count rates for Quadrant A Data is divided into 100 sec bins |
 |
 |
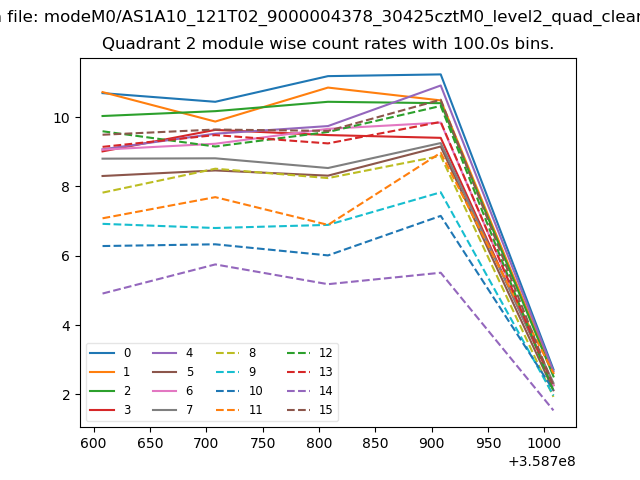
| Module-wise count rates for Quadrant B Data is divided into 100 sec bins |
 |
 |
| Module-wise count rates for Quadrant C Data is divided into 100 sec bins |
 |
 |
| Module-wise count rates for Quadrant D Data is divided into 100 sec bins |
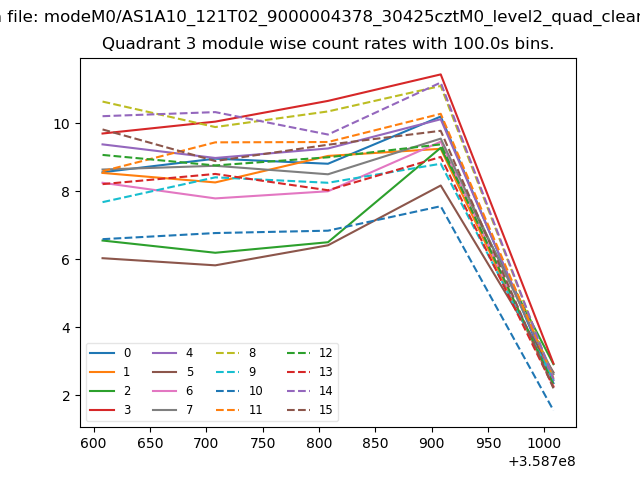 |
 |
| Parameter | Plot |
|---|---|
| CZT HV Monitor | 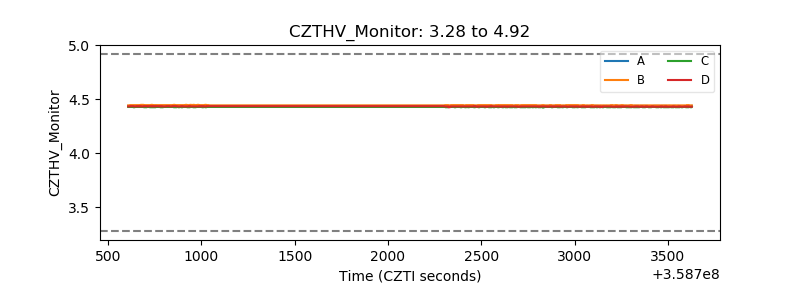 |
| D_VDD | 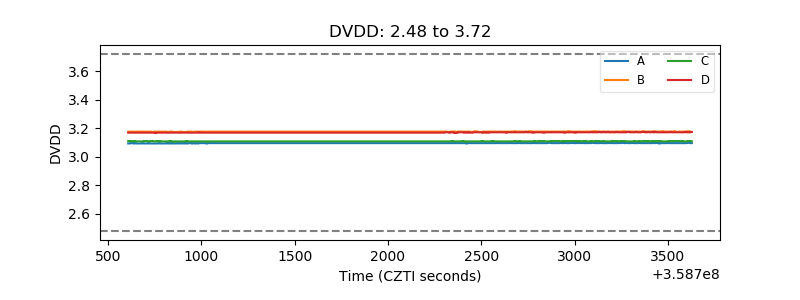 |
| Temperature 1 | 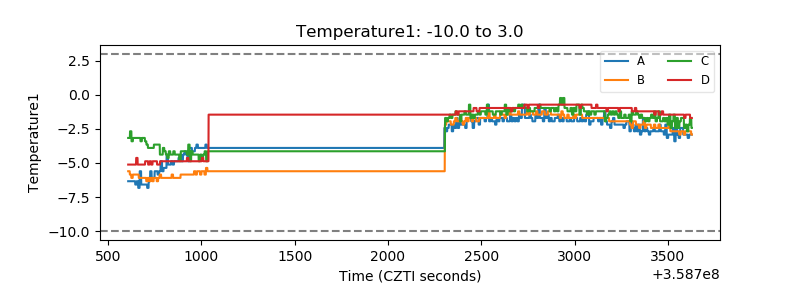 |
| Veto HV Monitor | 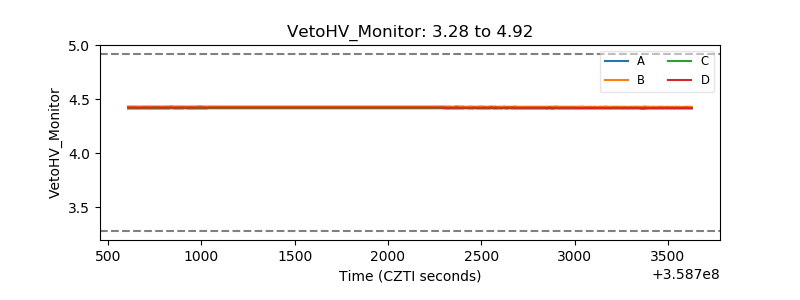 |
| Veto LLD | 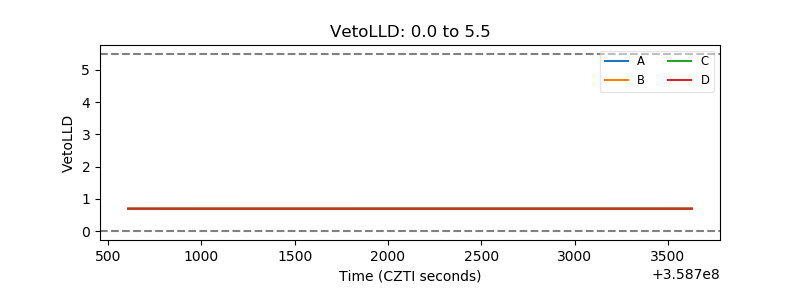 |
| Alpha Counter | 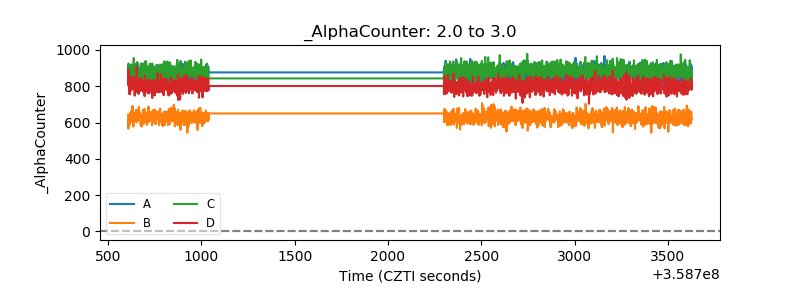 |
| _CPM_Rate | 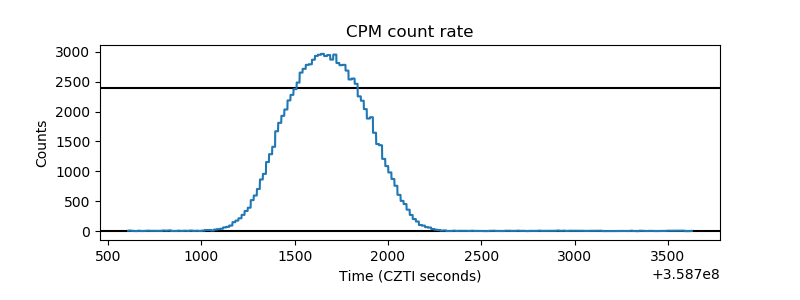 |
| CZT Counter | 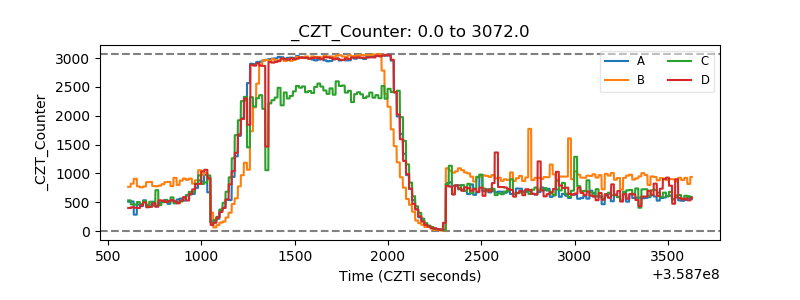 |
| +2.5 Volts monitor |  |
| +5 Volts monitor |  |
| _ROLL_ROT | 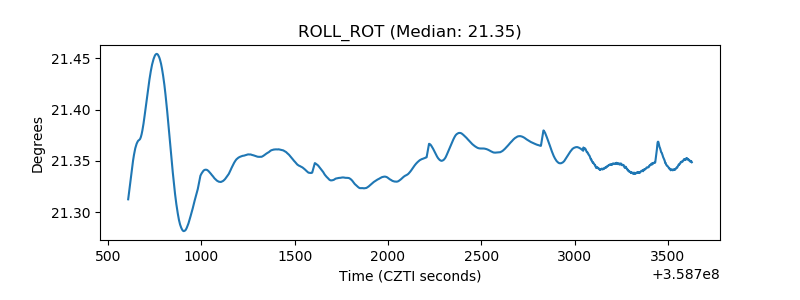 |
| _Roll_DEC | 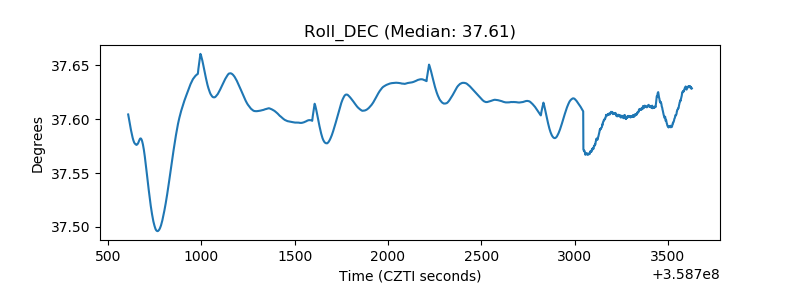 |
| _Roll_RA | 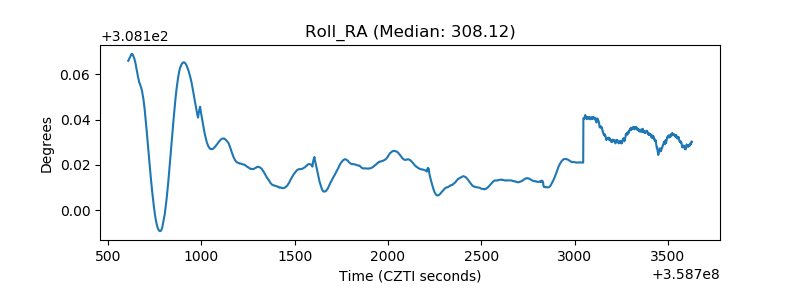 |
| Veto Counter | 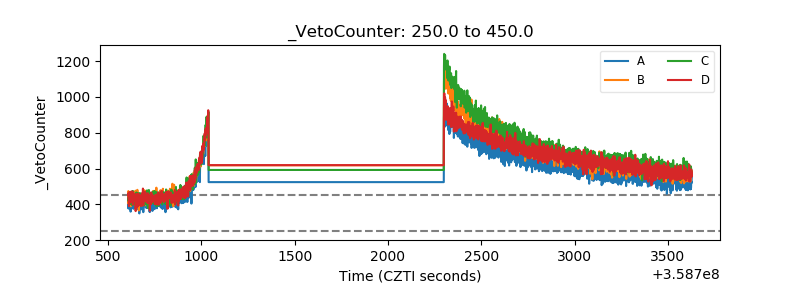 |