| Param | Original file | Final file |
|---|---|---|
| Filename | modeM0/AS1A10_121T02_9000004378_30427cztM0_level2.evt | modeM0/AS1A10_121T02_9000004378_30427cztM0_level2_quad_clean.evt |
| Size (bytes) | 551,767,680 | 95,944,320 |
| Size | 526.2 MB | 91.5 MB |
| Events in quadrant A | 3,298,278 | 626,354 |
| Events in quadrant B | 5,124,285 | 627,439 |
| Events in quadrant C | 3,617,264 | 619,784 |
| Events in quadrant D | 4,260,907 | 609,483 |
| Mode M0 | |||
|---|---|---|---|
| Quadrant | BADHDUFLAG | Total packets | Discarded packets |
| A | 0 | 13714 | 1 |
| B | 0 | 19062 | 1 |
| C | 0 | 14869 | 1 |
| D | 0 | 16762 | 1 |
| Mode SS | |||
|---|---|---|---|
| Quadrant | BADHDUFLAG | Total packets | Discarded packets |
| A | 0 | 124 | 0 |
| B | 0 | 124 | 0 |
| C | 0 | 124 | 0 |
| D | 0 | 124 | 0 |
| Mode M9 | |||
|---|---|---|---|
| Quadrant | BADHDUFLAG | Total packets | Discarded packets |
| A | 0 | 13 | 0 |
| B | 0 | 13 | 0 |
| C | 0 | 13 | 0 |
| D | 0 | 13 | 0 |
| Quadrant | Total seconds | Saturated seconds | Saturation percentage |
|---|---|---|---|
| A | 6049 | 78 | 1.289469% |
| B | 6050 | 143 | 2.363636% |
| C | 6050 | 193 | 3.190083% |
| D | 6050 | 478 | 7.900826% |
Noise dominated data is calculated using 1-second bins in cleaned event files. If a bin has >2000 counts, and if more than 50% of those come from <1% of pixels, then it is considered to be noise-dominated and hence unusable.
| Quadrant | # 1 sec bins | Bins with >0 counts | Bins with >2000 counts | High rate bins dominated by noise | Noise dominated (total time) | Noise dominated (detector-on time) | Marked lightcurve |
|---|---|---|---|---|---|---|---|
| A | 7359 | 6049 | 1 | 1 | 0.01% | 0.02% | 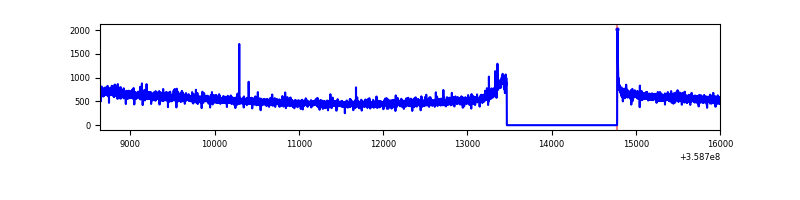 |
| B | 7360 | 6050 | 0 | 0 | 0.00% | 0.00% | 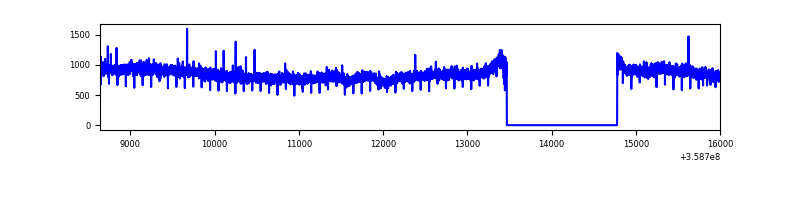 |
| C | 7360 | 6050 | 7 | 7 | 0.10% | 0.12% | 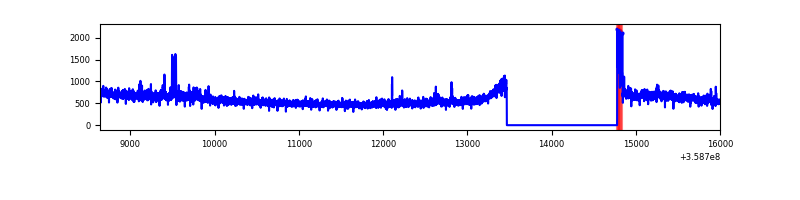 |
| D | 7360 | 6050 | 167 | 167 | 2.27% | 2.76% | 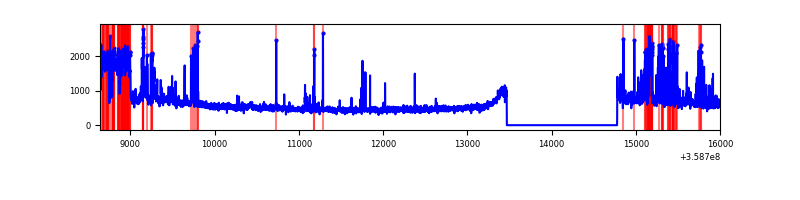 |
Top three noisy pixels from each quadrant. If the there are fewer than three noisy pixels in the level2.evt file, extra rows are filled as -1
| Pixel properties | Quadrant properties | ||||||
|---|---|---|---|---|---|---|---|
| Quadrant | DetID | PixID | Counts | Sigma | Mean | Median | Sigma |
| A | 0 | 13 | 14105 | 79.82 | 848 | 835 | 166.3 |
| A | 8 | 192 | 13002 | 73.18 | 848 | 835 | 166.3 |
| A | 13 | 254 | 12015 | 67.25 | 848 | 835 | 166.3 |
| B | 6 | 159 | 1813414 | 11556.8 | 841 | 821 | 156.8 |
| B | 12 | 111 | 18288 | 111.37 | 841 | 821 | 156.8 |
| B | 0 | 229 | 18087 | 110.09 | 841 | 821 | 156.8 |
| C | 3 | 233 | 167571 | 866.95 | 829 | 837 | 192.3 |
| C | 14 | 238 | 137837 | 712.35 | 829 | 837 | 192.3 |
| C | 0 | 10 | 60843 | 312.01 | 829 | 837 | 192.3 |
| D | 13 | 104 | 556414 | 2649.76 | 806 | 794 | 209.7 |
| D | 13 | 249 | 282756 | 1344.68 | 806 | 794 | 209.7 |
| D | 2 | 250 | 163810 | 777.43 | 806 | 794 | 209.7 |
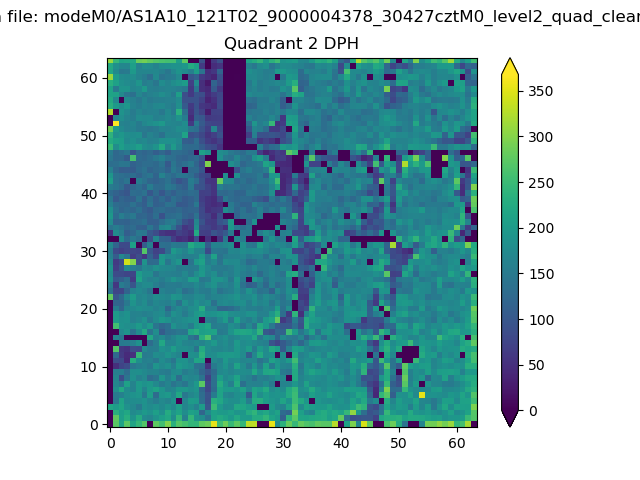
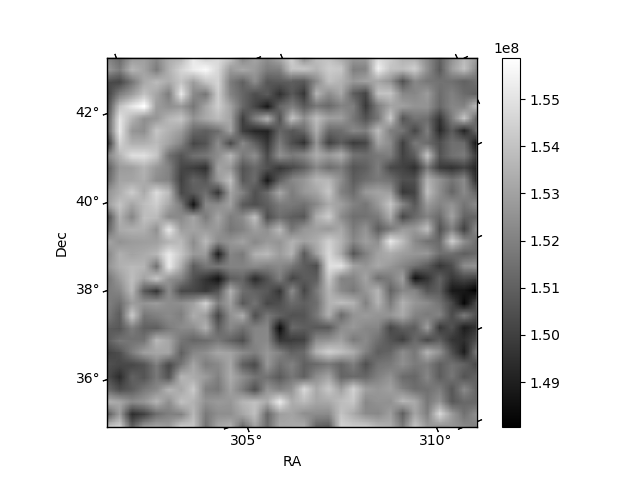
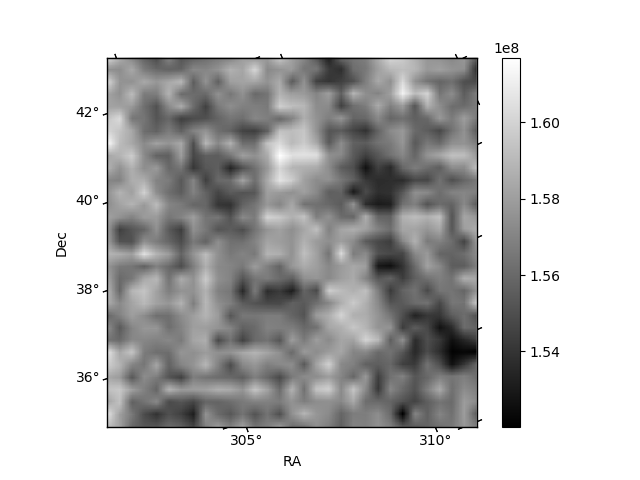
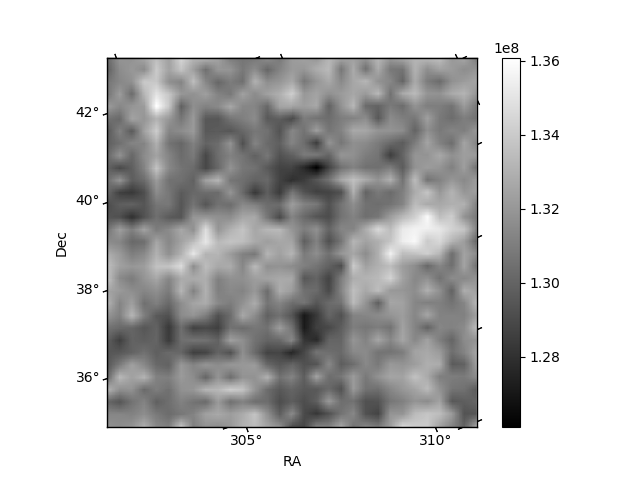
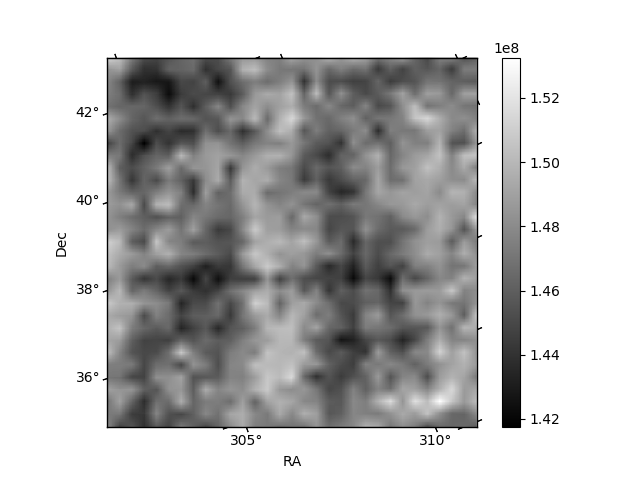
Histogram calculated using DETX and DETY for each event in the final _common_clean file
| Quadrant A | 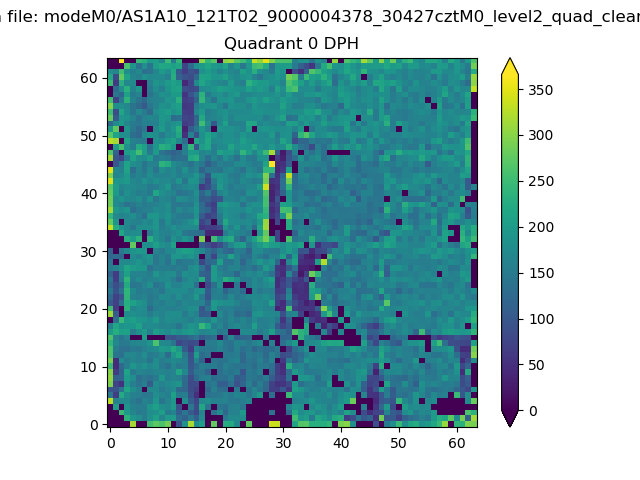 |
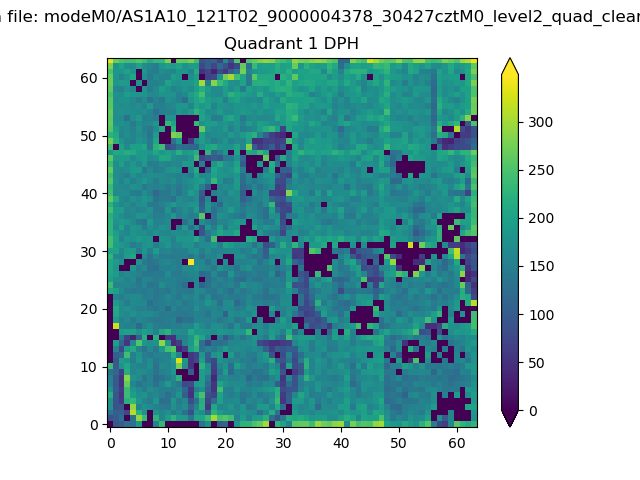 |
Quadrant B |
|---|---|---|---|
| Quadrant D | 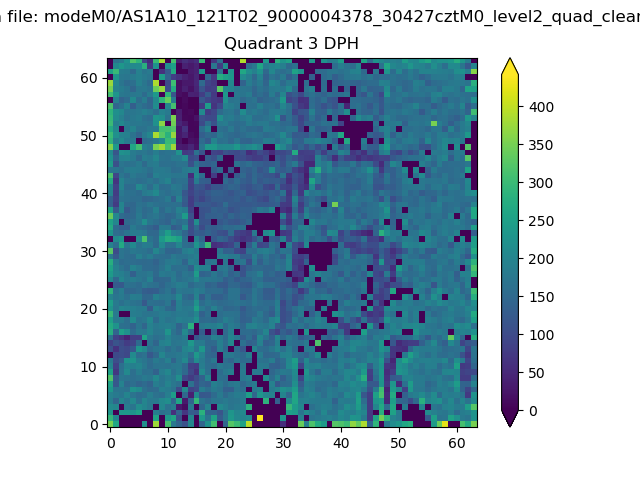 |
 |
Quadrant C |
| Plot type | Count rate plots | Images |
|---|---|---|
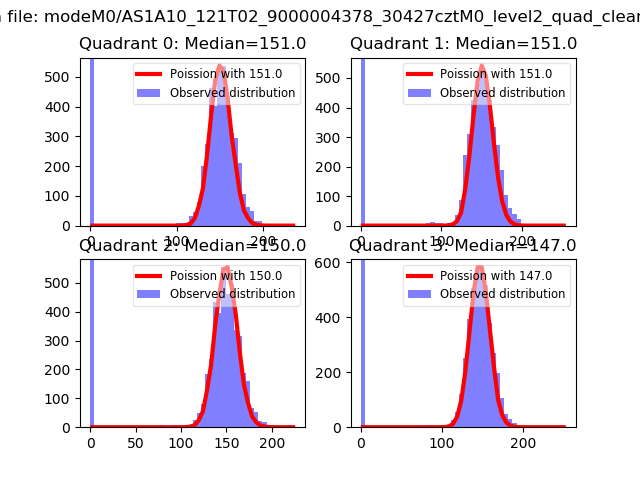
| Comparison with Poisson distribution Blue bars denote a histogram of data divided into 1 sec bins. Red curve is a Poisson curve with rate = median count rate of data. |
 |
 |
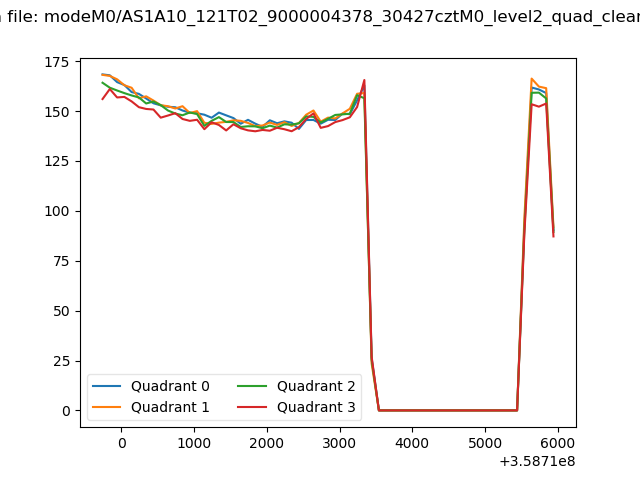
| Quadrant-wise count rates Data is divided into 100 sec bins |
 |
|
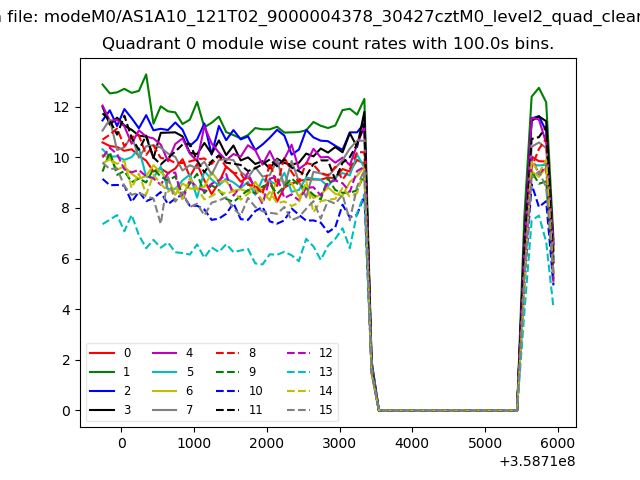
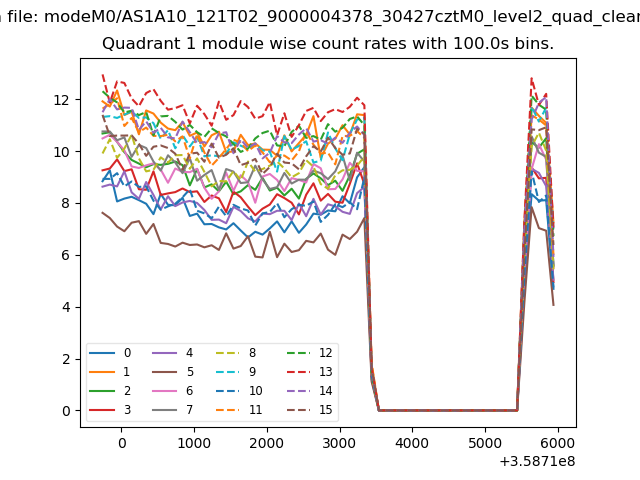
| Module-wise count rates for Quadrant A Data is divided into 100 sec bins |
 |
 |
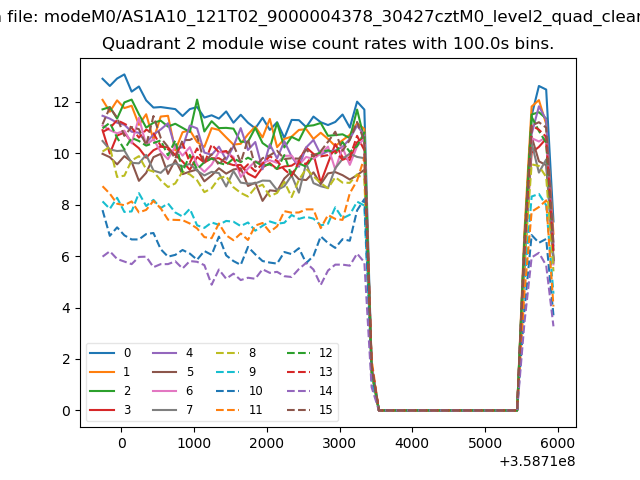
| Module-wise count rates for Quadrant B Data is divided into 100 sec bins |
 |
 |
| Module-wise count rates for Quadrant C Data is divided into 100 sec bins |
 |
 |
| Module-wise count rates for Quadrant D Data is divided into 100 sec bins |
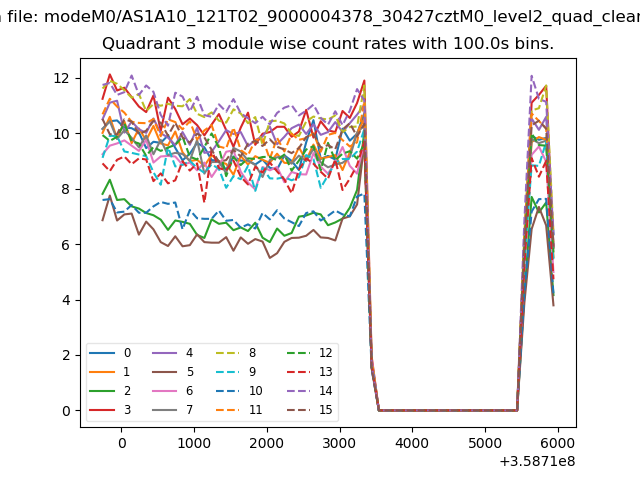 |
 |
| Parameter | Plot |
|---|---|
| CZT HV Monitor | 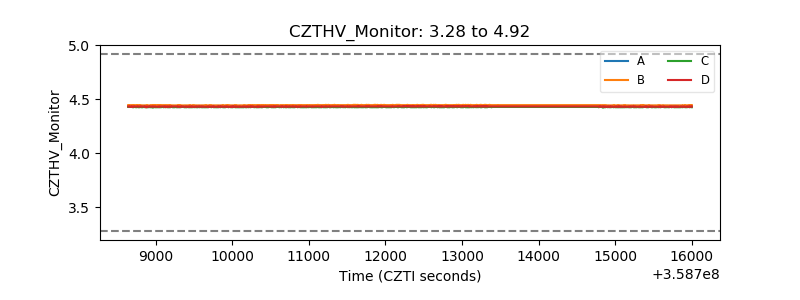 |
| D_VDD |  |
| Temperature 1 | 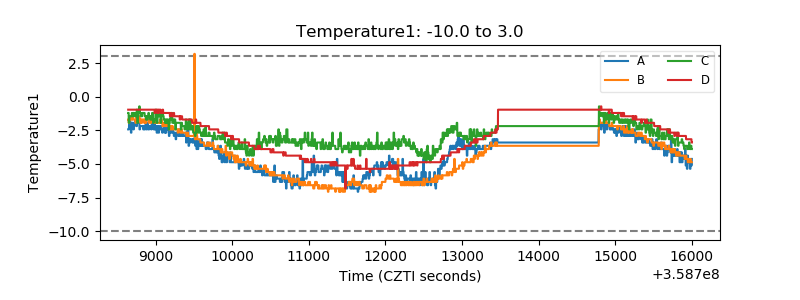 |
| Veto HV Monitor |  |
| Veto LLD | 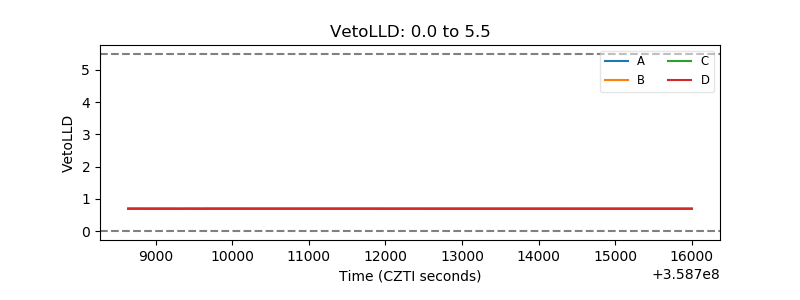 |
| Alpha Counter | 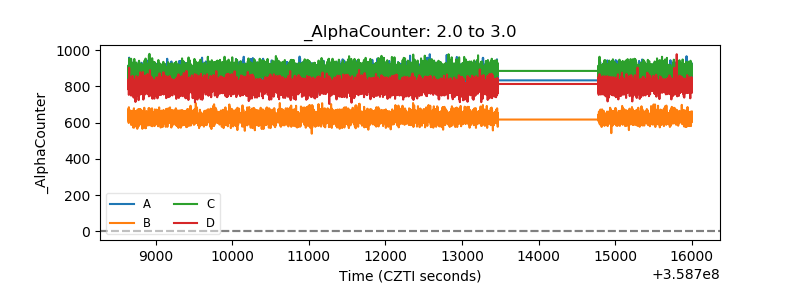 |
| _CPM_Rate | 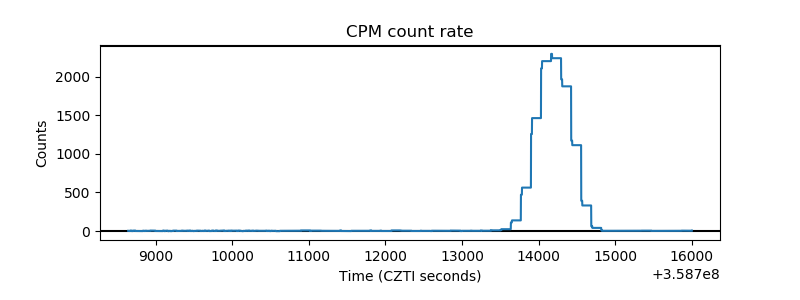 |
| CZT Counter | 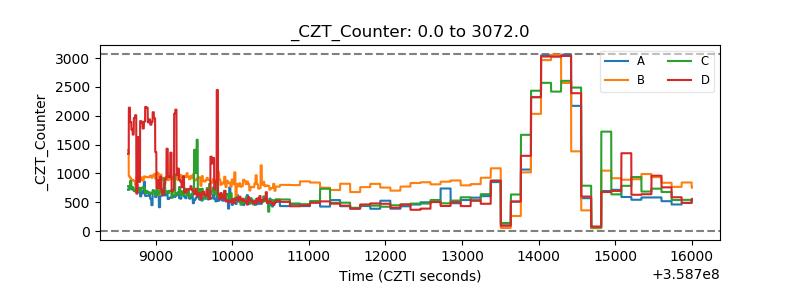 |
| +2.5 Volts monitor |  |
| +5 Volts monitor |  |
| _ROLL_ROT | 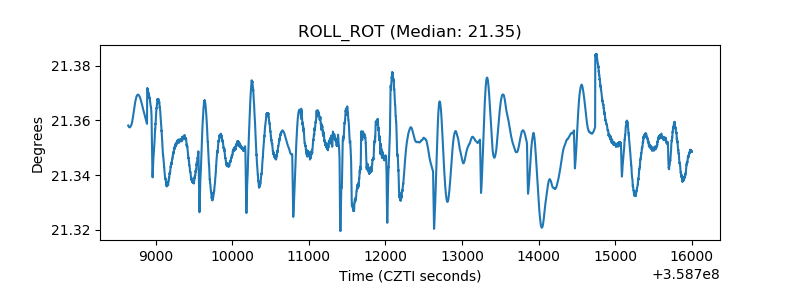 |
| _Roll_DEC | 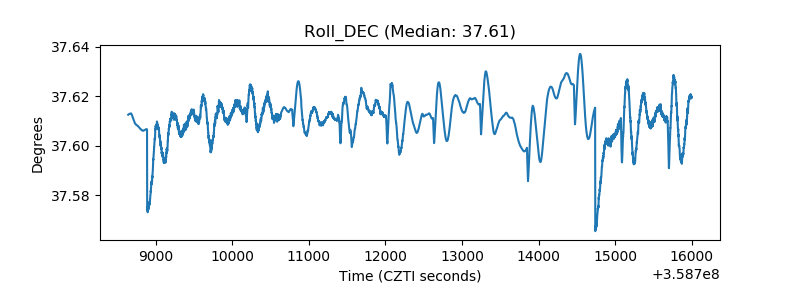 |
| _Roll_RA | 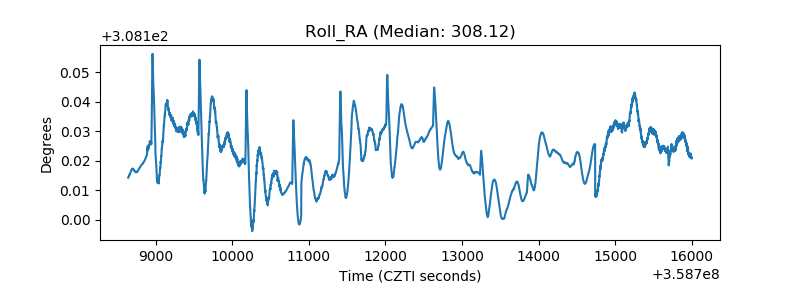 |
| Veto Counter | 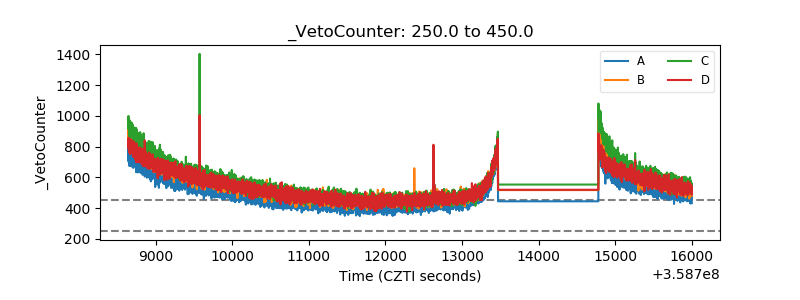 |