| Param | Original file | Final file |
|---|---|---|
| Filename | modeM0/AS1A10_121T02_9000004378_30428cztM0_level2.evt | modeM0/AS1A10_121T02_9000004378_30428cztM0_level2_quad_clean.evt |
| Size (bytes) | 536,544,000 | 101,450,880 |
| Size | 511.7 MB | 96.8 MB |
| Events in quadrant A | 3,344,763 | 663,849 |
| Events in quadrant B | 5,143,731 | 667,749 |
| Events in quadrant C | 3,548,270 | 658,337 |
| Events in quadrant D | 3,786,322 | 643,524 |
| Mode M0 | |||
|---|---|---|---|
| Quadrant | BADHDUFLAG | Total packets | Discarded packets |
| A | 0 | 13842 | 2 |
| B | 0 | 19411 | 2 |
| C | 0 | 14538 | 2 |
| D | 0 | 15486 | 2 |
| Mode SS | |||
|---|---|---|---|
| Quadrant | BADHDUFLAG | Total packets | Discarded packets |
| A | 0 | 128 | 0 |
| B | 0 | 128 | 0 |
| C | 0 | 128 | 0 |
| D | 0 | 128 | 0 |
| Mode M9 | |||
|---|---|---|---|
| Quadrant | BADHDUFLAG | Total packets | Discarded packets |
| A | 0 | 22 | 0 |
| B | 0 | 23 | 0 |
| C | 0 | 23 | 0 |
| D | 0 | 23 | 0 |
| Quadrant | Total seconds | Saturated seconds | Saturation percentage |
|---|---|---|---|
| A | 6290 | 73 | 1.160572% |
| B | 6290 | 146 | 2.321145% |
| C | 6289 | 186 | 2.957545% |
| D | 6289 | 179 | 2.846239% |
Noise dominated data is calculated using 1-second bins in cleaned event files. If a bin has >2000 counts, and if more than 50% of those come from <1% of pixels, then it is considered to be noise-dominated and hence unusable.
| Quadrant | # 1 sec bins | Bins with >0 counts | Bins with >2000 counts | High rate bins dominated by noise | Noise dominated (total time) | Noise dominated (detector-on time) | Marked lightcurve |
|---|---|---|---|---|---|---|---|
| A | 7510 | 6291 | 2 | 2 | 0.03% | 0.03% | 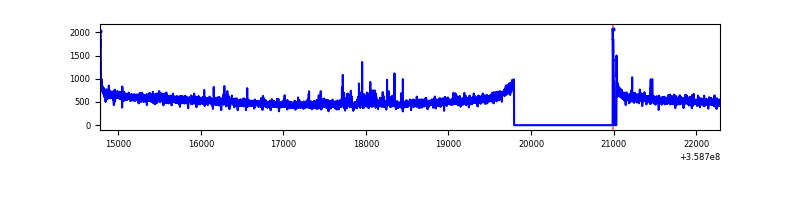 |
| B | 7510 | 6291 | 0 | 0 | 0.00% | 0.00% |  |
| C | 7509 | 6289 | 8 | 8 | 0.11% | 0.13% | 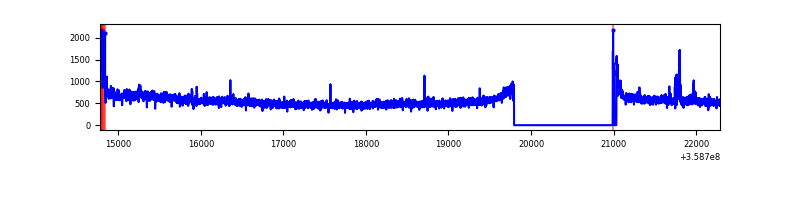 |
| D | 7509 | 6291 | 95 | 95 | 1.27% | 1.51% | 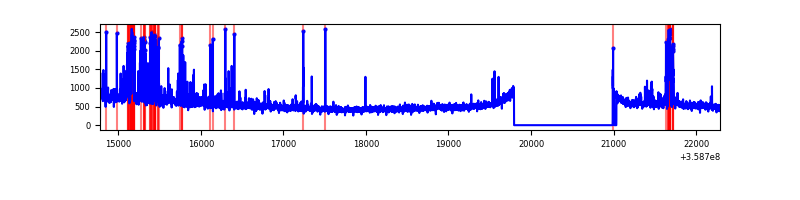 |
Top three noisy pixels from each quadrant. If the there are fewer than three noisy pixels in the level2.evt file, extra rows are filled as -1
| Pixel properties | Quadrant properties | ||||||
|---|---|---|---|---|---|---|---|
| Quadrant | DetID | PixID | Counts | Sigma | Mean | Median | Sigma |
| A | 0 | 13 | 80565 | 476.97 | 839 | 826 | 167.2 |
| A | 8 | 192 | 26875 | 155.82 | 839 | 826 | 167.2 |
| A | 13 | 254 | 12540 | 70.07 | 839 | 826 | 167.2 |
| B | 6 | 159 | 1831428 | 11639.27 | 835 | 814 | 157.3 |
| B | 12 | 111 | 18637 | 113.32 | 835 | 814 | 157.3 |
| B | 11 | 111 | 16771 | 101.46 | 835 | 814 | 157.3 |
| C | 14 | 238 | 137229 | 716.64 | 820 | 828 | 190.3 |
| C | 3 | 233 | 87113 | 453.34 | 820 | 828 | 190.3 |
| C | 0 | 10 | 78686 | 409.06 | 820 | 828 | 190.3 |
| D | 13 | 249 | 383485 | 1820.11 | 816 | 798 | 210.3 |
| D | 8 | 195 | 111152 | 524.86 | 816 | 798 | 210.3 |
| D | 2 | 250 | 81265 | 382.71 | 816 | 798 | 210.3 |
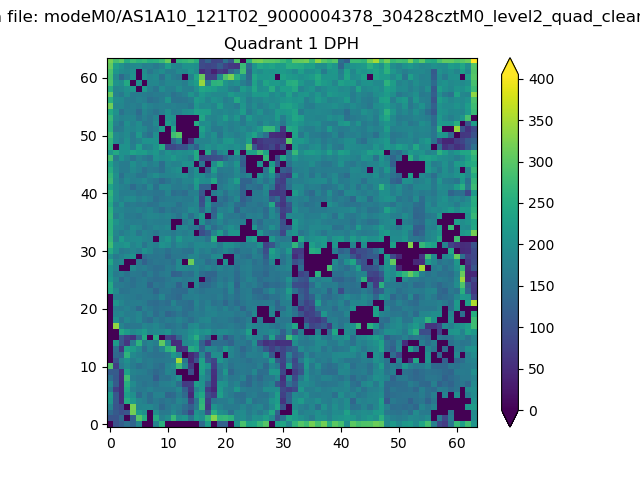
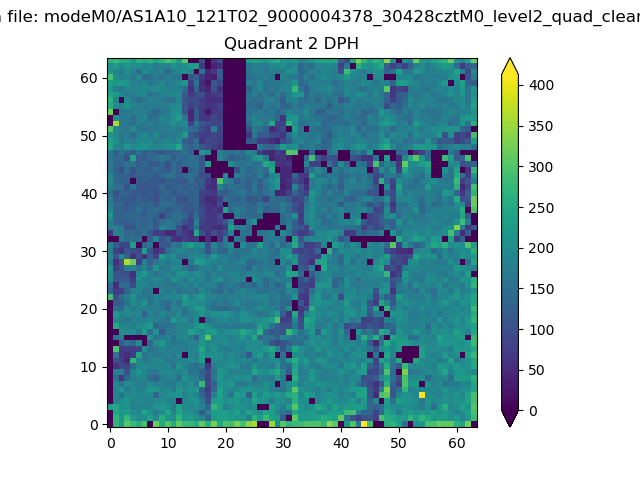
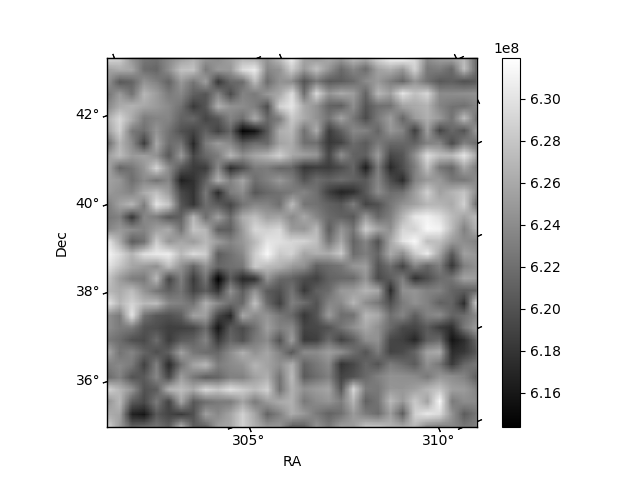
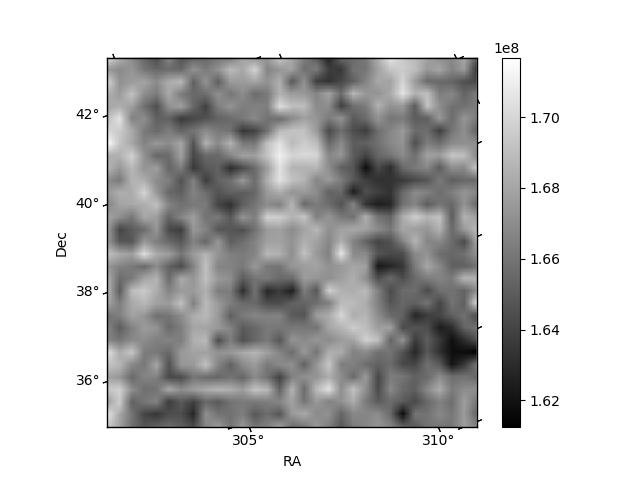
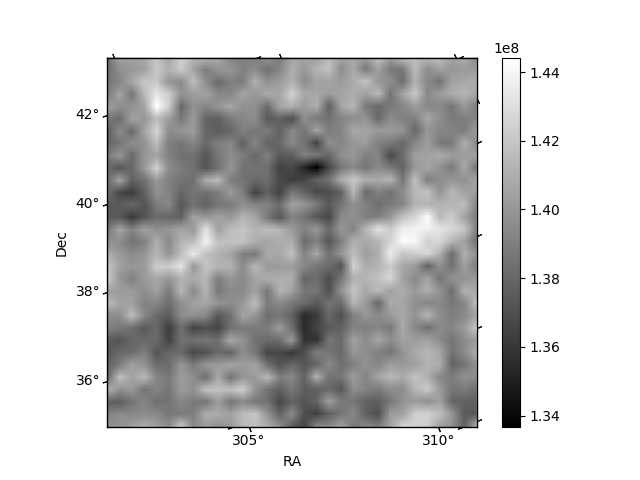
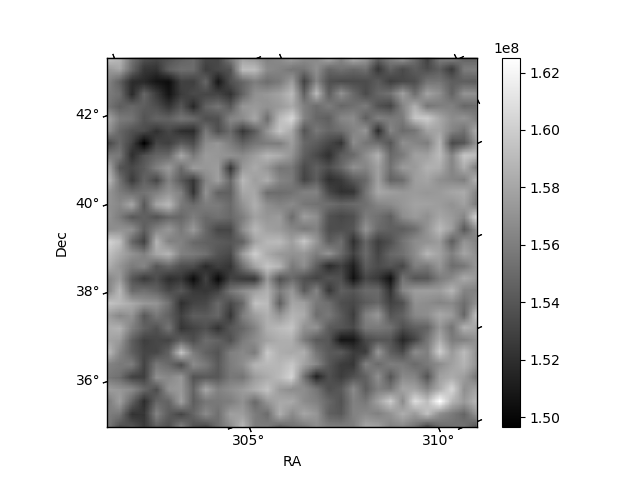
Histogram calculated using DETX and DETY for each event in the final _common_clean file
| Quadrant A | 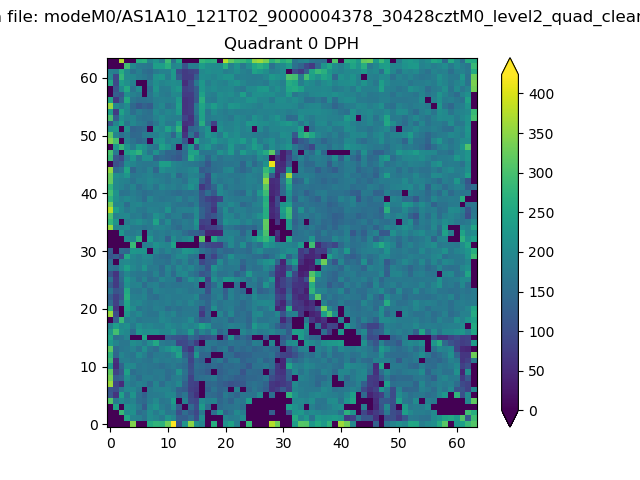 |
 |
Quadrant B |
|---|---|---|---|
| Quadrant D | 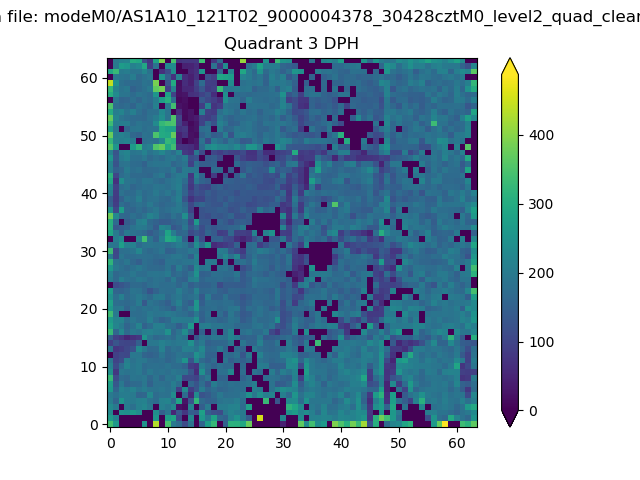 |
 |
Quadrant C |
| Plot type | Count rate plots | Images |
|---|---|---|
| Comparison with Poisson distribution Blue bars denote a histogram of data divided into 1 sec bins. Red curve is a Poisson curve with rate = median count rate of data. |
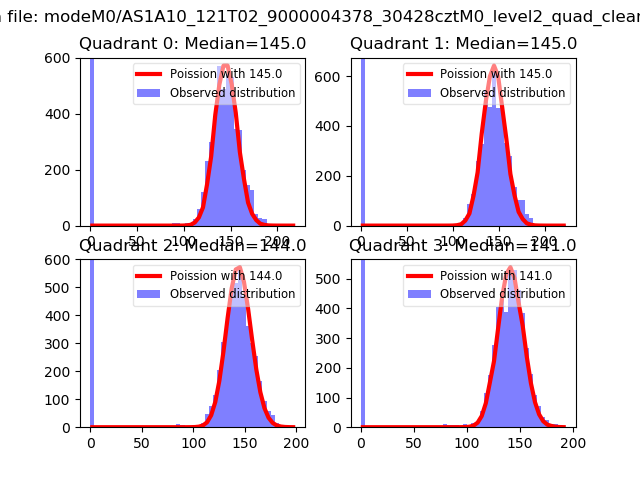 |
 |
| Quadrant-wise count rates Data is divided into 100 sec bins |
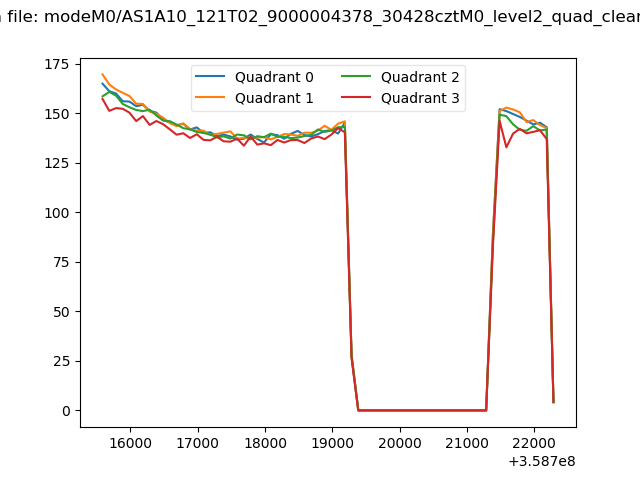 |
|
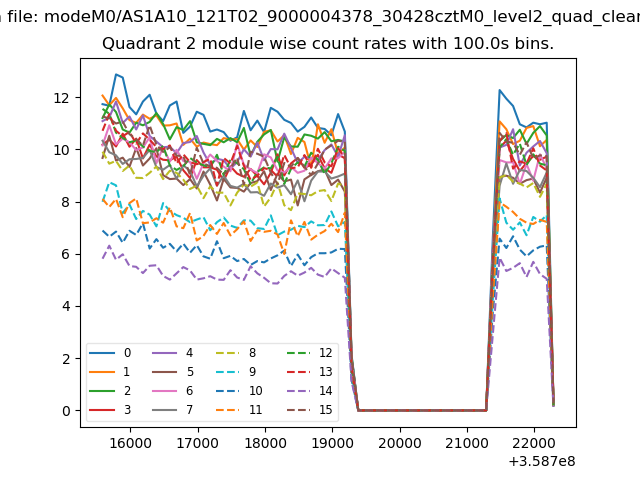
| Module-wise count rates for Quadrant A Data is divided into 100 sec bins |
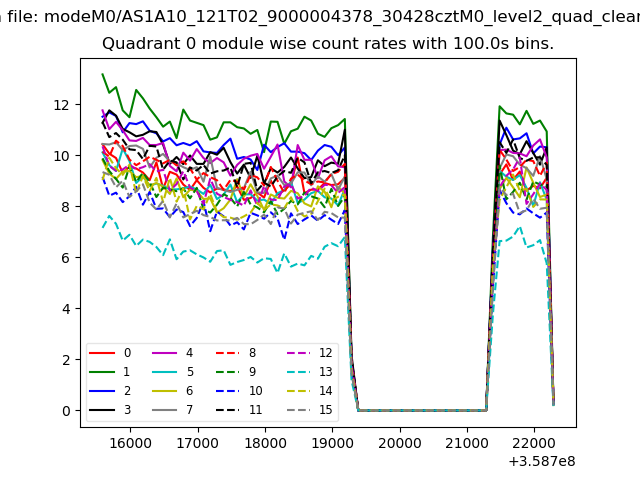 |
 |
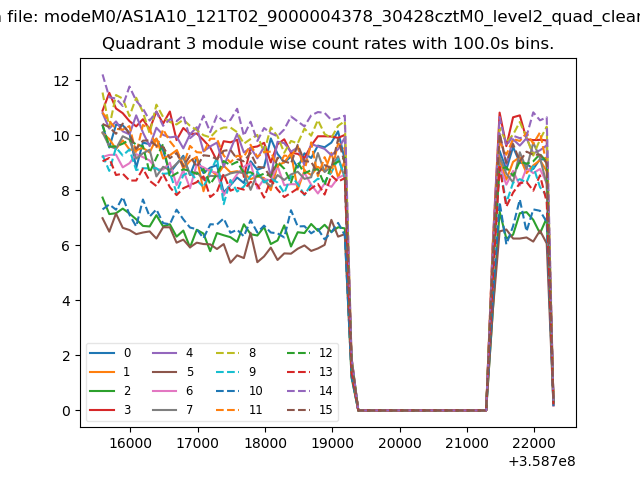
| Module-wise count rates for Quadrant B Data is divided into 100 sec bins |
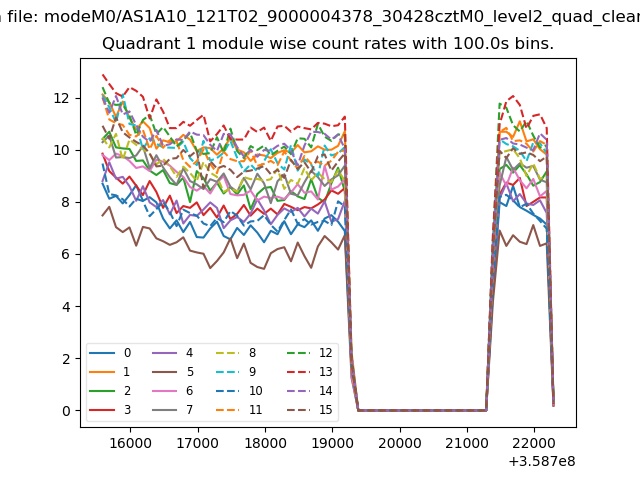 |
 |
| Module-wise count rates for Quadrant C Data is divided into 100 sec bins |
 |
 |
| Module-wise count rates for Quadrant D Data is divided into 100 sec bins |
 |
 |
| Parameter | Plot |
|---|---|
| CZT HV Monitor | 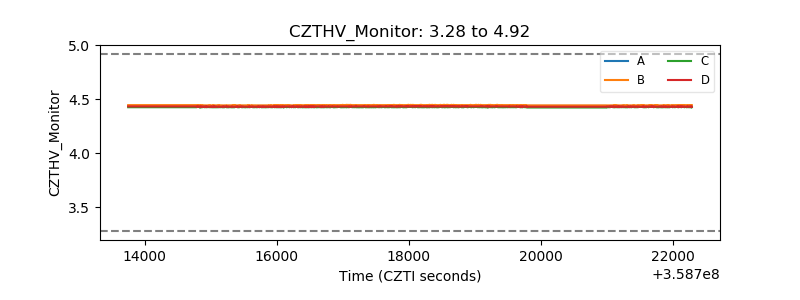 |
| D_VDD | 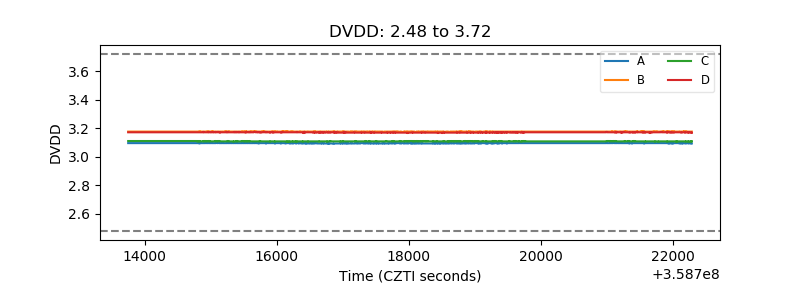 |
| Temperature 1 | 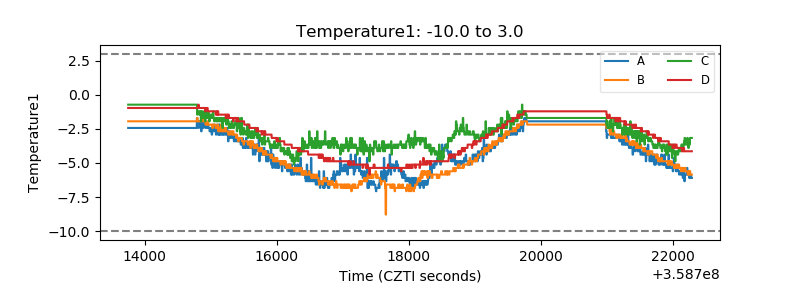 |
| Veto HV Monitor | 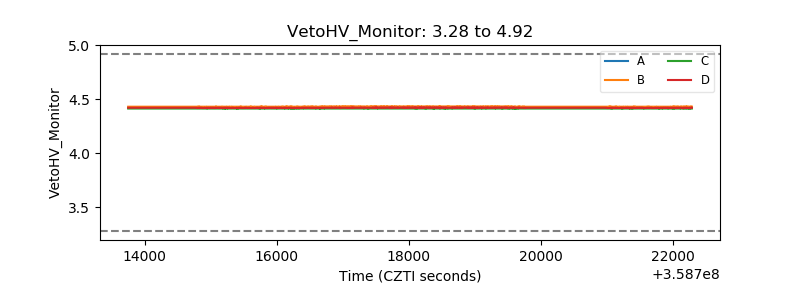 |
| Veto LLD | 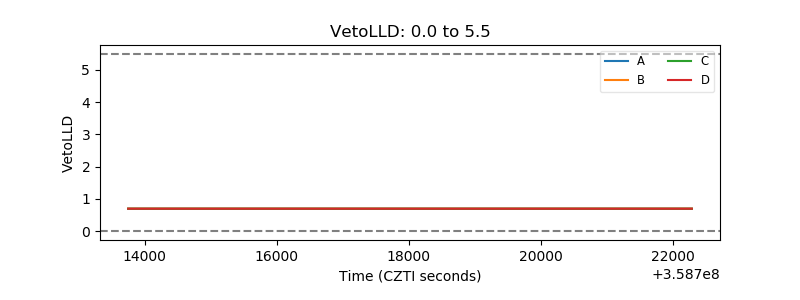 |
| Alpha Counter | 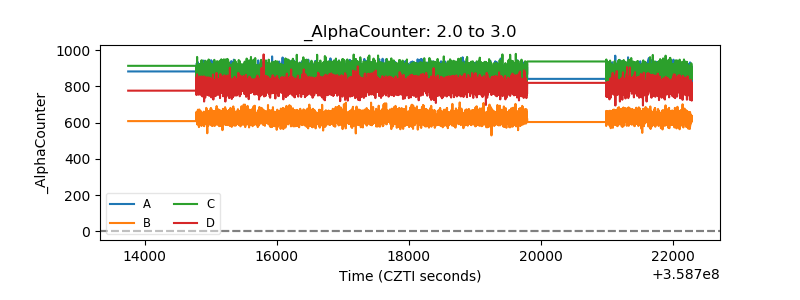 |
| _CPM_Rate | 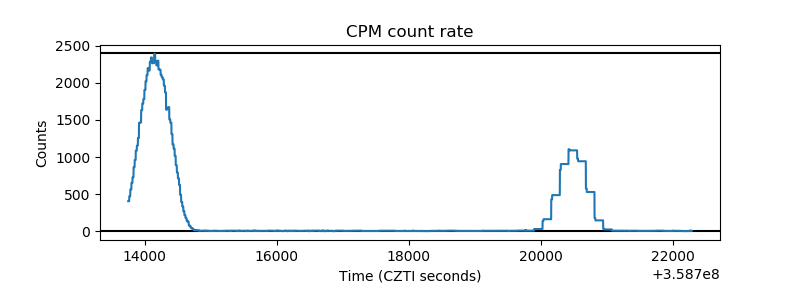 |
| CZT Counter | 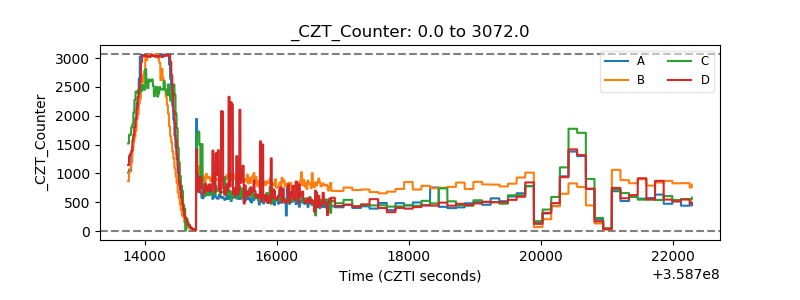 |
| +2.5 Volts monitor |  |
| +5 Volts monitor |  |
| _ROLL_ROT | 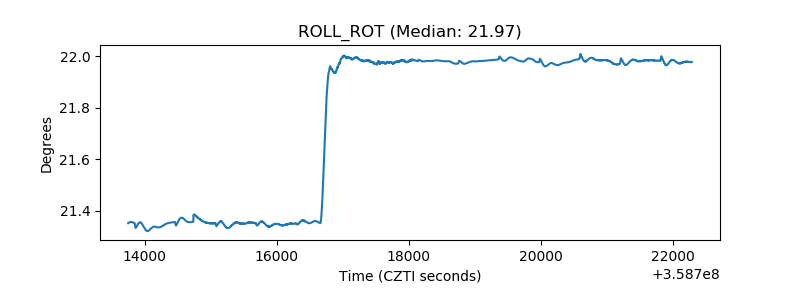 |
| _Roll_DEC | 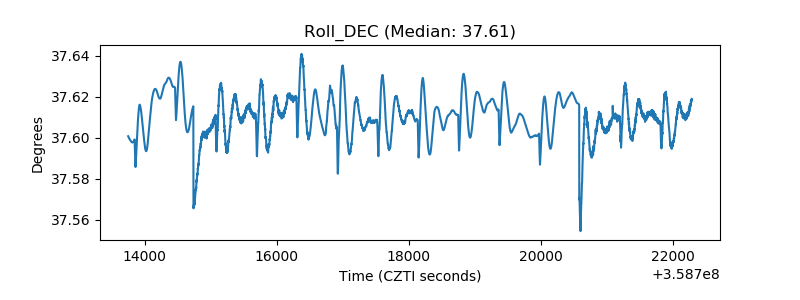 |
| _Roll_RA | 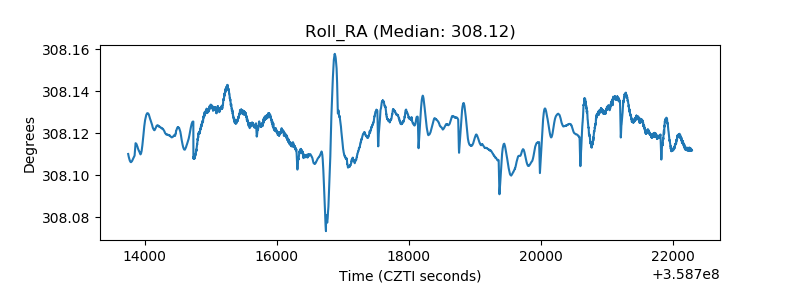 |
| Veto Counter |  |