| Param | Original file | Final file |
|---|---|---|
| Filename | modeM0/AS1A10_121T02_9000004378_30429cztM0_level2.evt | modeM0/AS1A10_121T02_9000004378_30429cztM0_level2_quad_clean.evt |
| Size (bytes) | 585,368,640 | 105,612,480 |
| Size | 558.3 MB | 100.7 MB |
| Events in quadrant A | 3,594,665 | 687,206 |
| Events in quadrant B | 5,662,664 | 687,795 |
| Events in quadrant C | 3,846,088 | 674,285 |
| Events in quadrant D | 4,143,875 | 654,906 |
| Mode M0 | |||
|---|---|---|---|
| Quadrant | BADHDUFLAG | Total packets | Discarded packets |
| A | 0 | 15191 | 2 |
| B | 0 | 21745 | 2 |
| C | 0 | 15880 | 2 |
| D | 0 | 17189 | 5 |
| Mode SS | |||
|---|---|---|---|
| Quadrant | BADHDUFLAG | Total packets | Discarded packets |
| A | 0 | 148 | 0 |
| B | 0 | 148 | 0 |
| C | 0 | 148 | 0 |
| D | 0 | 148 | 0 |
| Mode M9 | |||
|---|---|---|---|
| Quadrant | BADHDUFLAG | Total packets | Discarded packets |
| A | 0 | 21 | 0 |
| B | 0 | 21 | 0 |
| C | 0 | 21 | 0 |
| D | 0 | 21 | 0 |
| Quadrant | Total seconds | Saturated seconds | Saturation percentage |
|---|---|---|---|
| A | 7089 | 108 | 1.523487% |
| B | 7089 | 232 | 3.272676% |
| C | 7089 | 239 | 3.371421% |
| D | 7088 | 265 | 3.738713% |
Noise dominated data is calculated using 1-second bins in cleaned event files. If a bin has >2000 counts, and if more than 50% of those come from <1% of pixels, then it is considered to be noise-dominated and hence unusable.
| Quadrant | # 1 sec bins | Bins with >0 counts | Bins with >2000 counts | High rate bins dominated by noise | Noise dominated (total time) | Noise dominated (detector-on time) | Marked lightcurve |
|---|---|---|---|---|---|---|---|
| A | 9214 | 7091 | 1 | 1 | 0.01% | 0.01% | 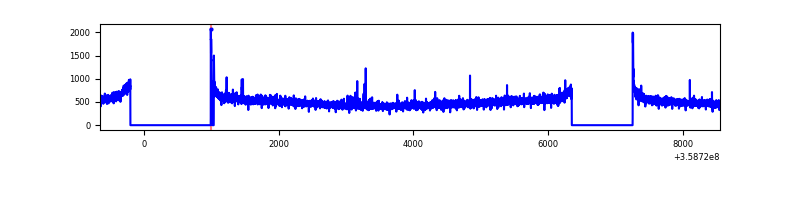 |
| B | 9214 | 7090 | 1 | 1 | 0.01% | 0.01% | 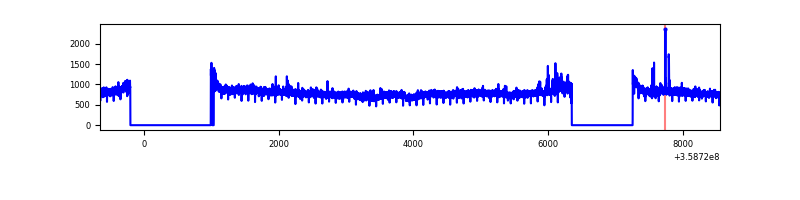 |
| C | 9214 | 7089 | 3 | 3 | 0.03% | 0.04% | 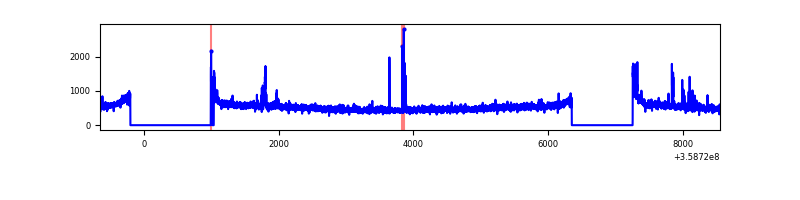 |
| D | 9213 | 7090 | 172 | 172 | 1.87% | 2.43% | 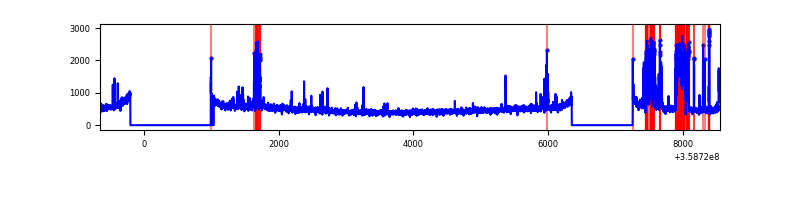 |
Top three noisy pixels from each quadrant. If the there are fewer than three noisy pixels in the level2.evt file, extra rows are filled as -1
| Pixel properties | Quadrant properties | ||||||
|---|---|---|---|---|---|---|---|
| Quadrant | DetID | PixID | Counts | Sigma | Mean | Median | Sigma |
| A | 0 | 13 | 32818 | 174.66 | 914 | 898 | 182.8 |
| A | 8 | 192 | 26417 | 139.63 | 914 | 898 | 182.8 |
| A | 13 | 254 | 13236 | 67.51 | 914 | 898 | 182.8 |
| B | 6 | 159 | 2021450 | 11636.6 | 904 | 881 | 173.6 |
| B | 0 | 229 | 46110 | 260.48 | 904 | 881 | 173.6 |
| B | 12 | 111 | 21094 | 116.41 | 904 | 881 | 173.6 |
| C | 14 | 238 | 147539 | 712.76 | 884 | 890 | 205.7 |
| C | 3 | 233 | 96725 | 465.79 | 884 | 890 | 205.7 |
| C | 15 | 208 | 58068 | 277.9 | 884 | 890 | 205.7 |
| D | 13 | 104 | 318097 | 1392.91 | 881 | 865 | 227.7 |
| D | 13 | 249 | 315763 | 1382.66 | 881 | 865 | 227.7 |
| D | 2 | 250 | 50716 | 218.89 | 881 | 865 | 227.7 |
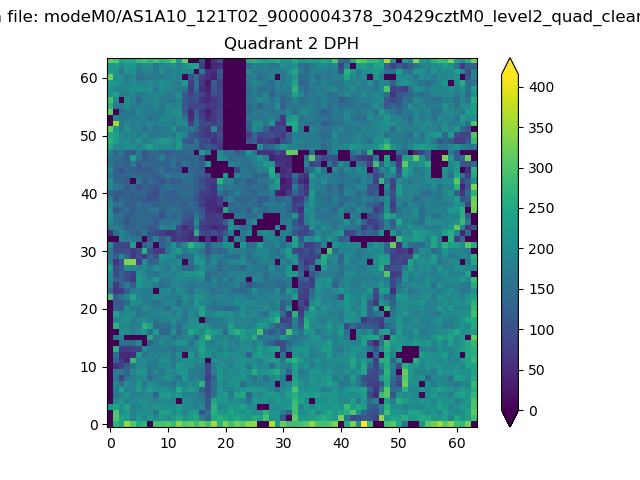
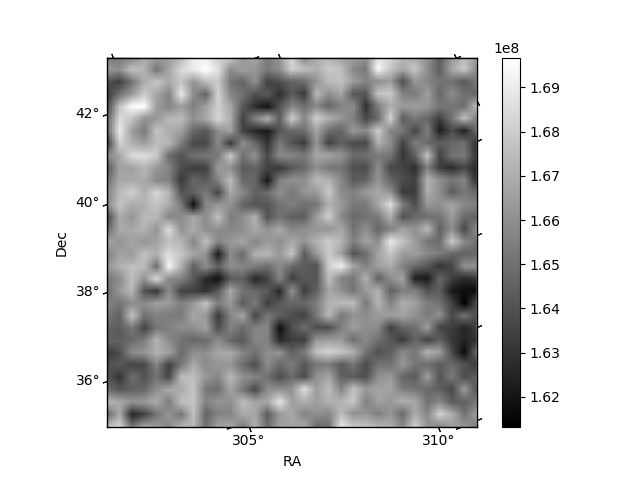
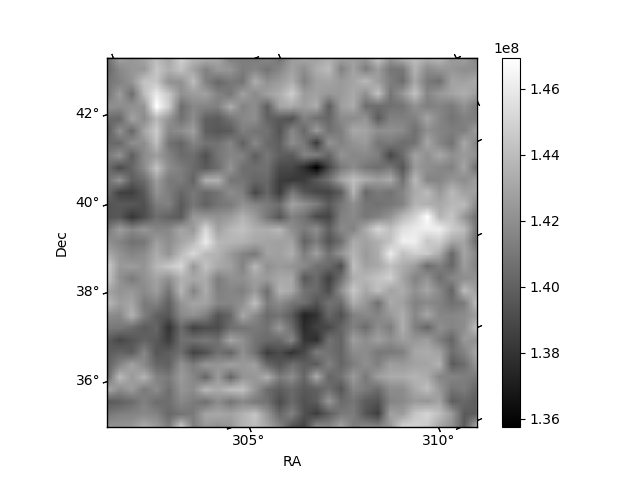
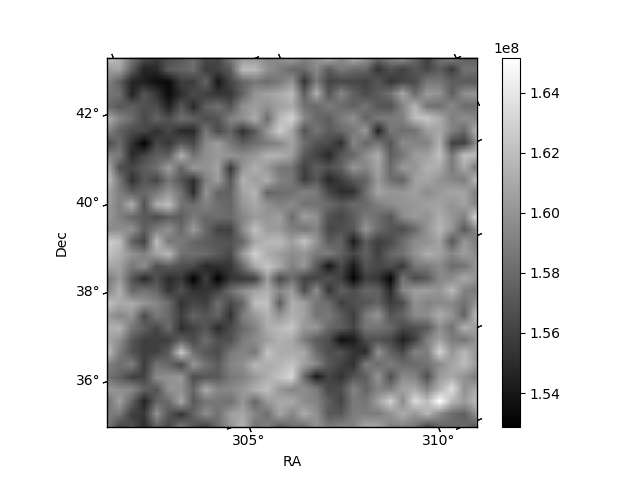
Histogram calculated using DETX and DETY for each event in the final _common_clean file
| Quadrant A | 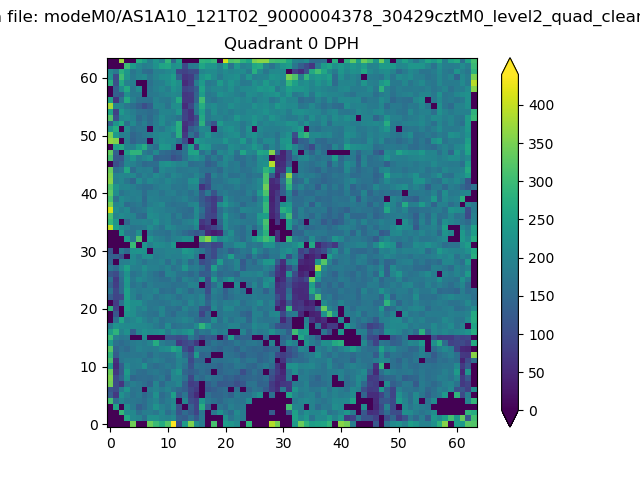 |
 |
Quadrant B |
|---|---|---|---|
| Quadrant D |  |
 |
Quadrant C |
| Plot type | Count rate plots | Images |
|---|---|---|
| Comparison with Poisson distribution Blue bars denote a histogram of data divided into 1 sec bins. Red curve is a Poisson curve with rate = median count rate of data. |
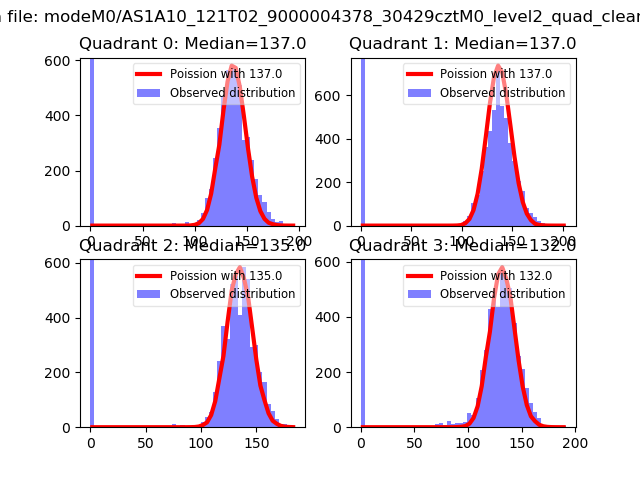 |
 |
| Quadrant-wise count rates Data is divided into 100 sec bins |
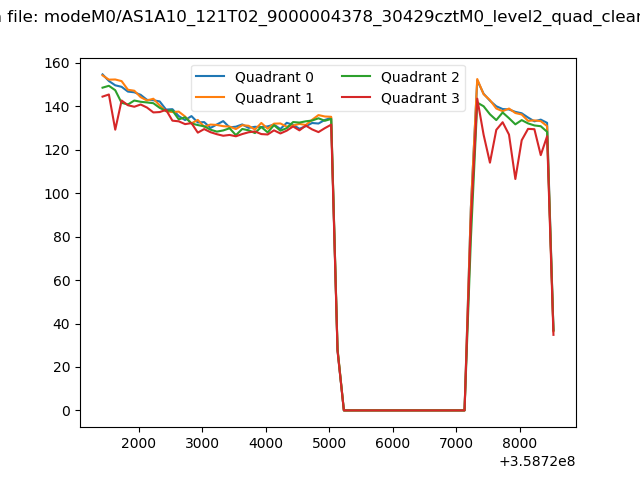 |
|
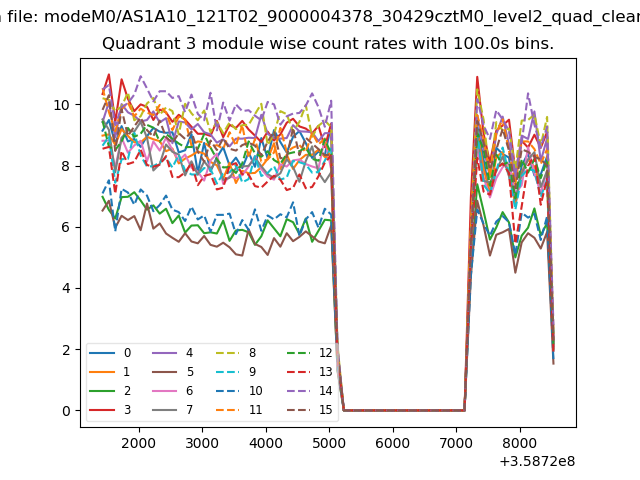
| Module-wise count rates for Quadrant A Data is divided into 100 sec bins |
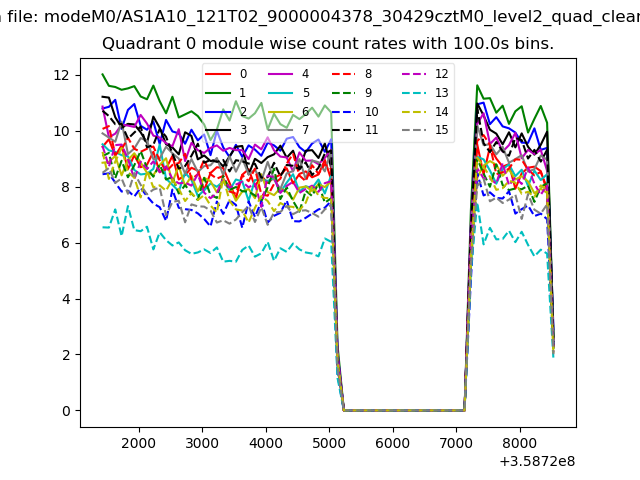 |
 |
| Module-wise count rates for Quadrant B Data is divided into 100 sec bins |
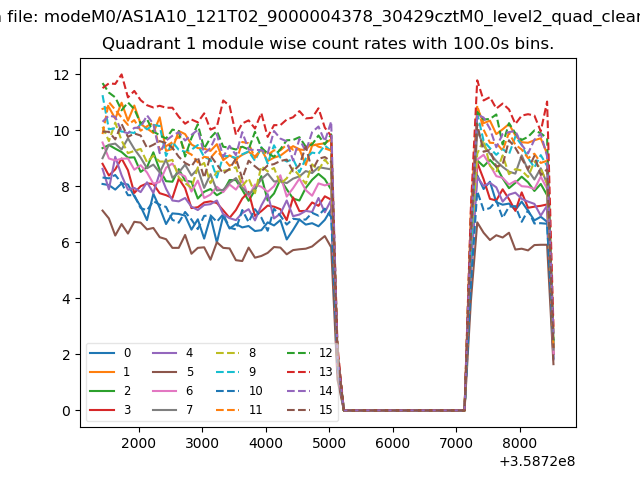 |
 |
| Module-wise count rates for Quadrant C Data is divided into 100 sec bins |
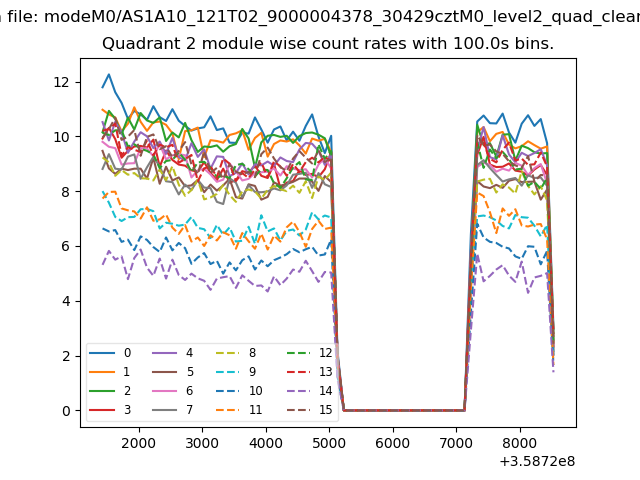 |
 |
| Module-wise count rates for Quadrant D Data is divided into 100 sec bins |
 |
 |
| Parameter | Plot |
|---|---|
| CZT HV Monitor | 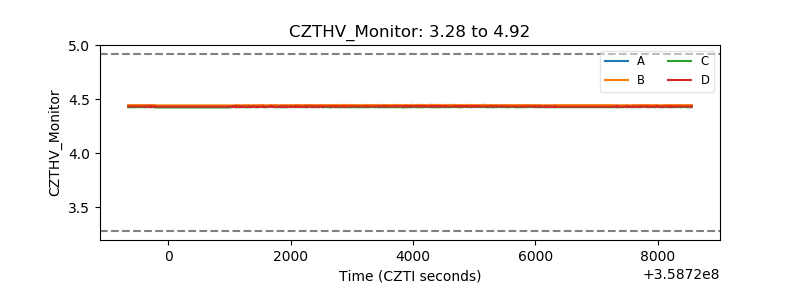 |
| D_VDD | 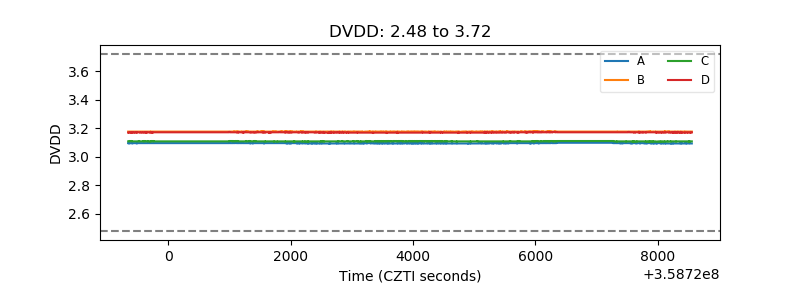 |
| Temperature 1 | 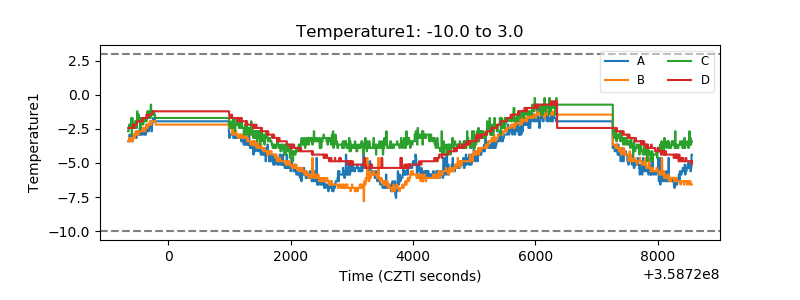 |
| Veto HV Monitor |  |
| Veto LLD | 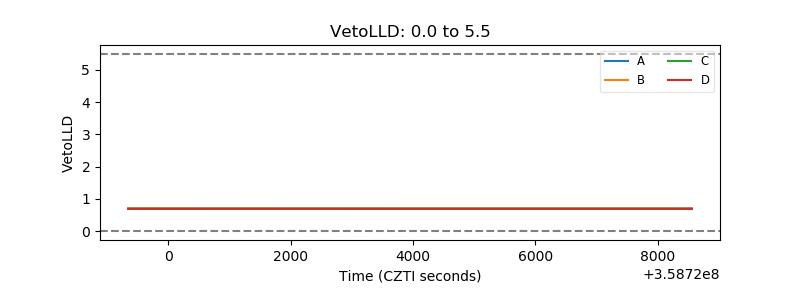 |
| Alpha Counter | 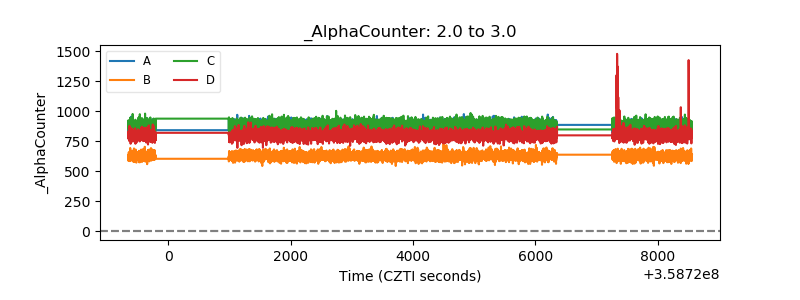 |
| _CPM_Rate | 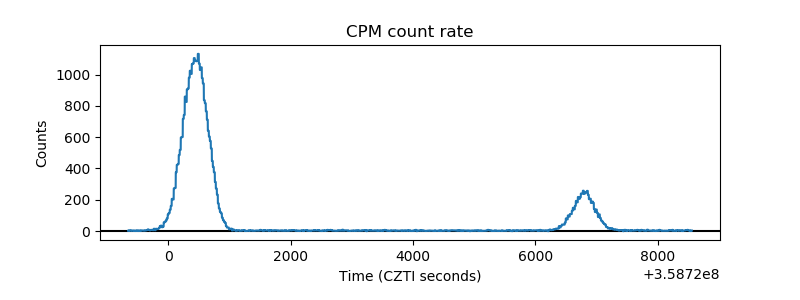 |
| CZT Counter |  |
| +2.5 Volts monitor |  |
| +5 Volts monitor |  |
| _ROLL_ROT | 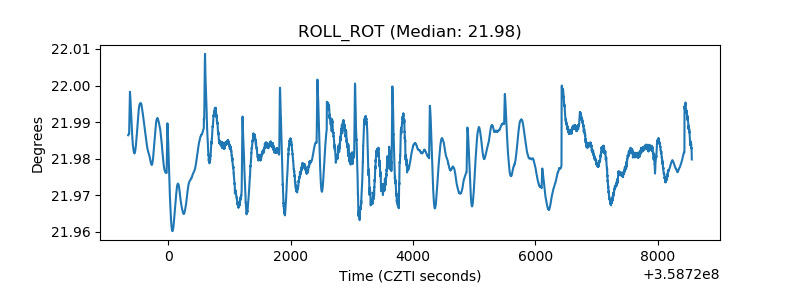 |
| _Roll_DEC | 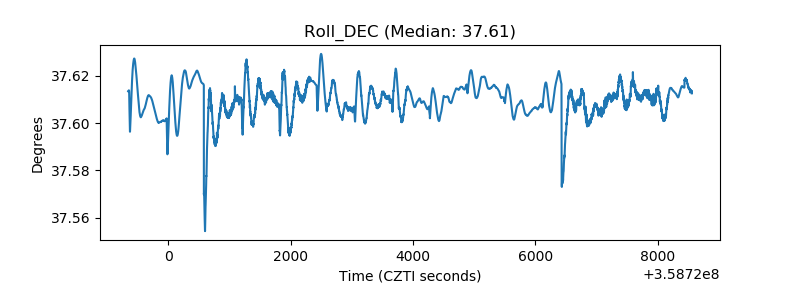 |
| _Roll_RA |  |
| Veto Counter | 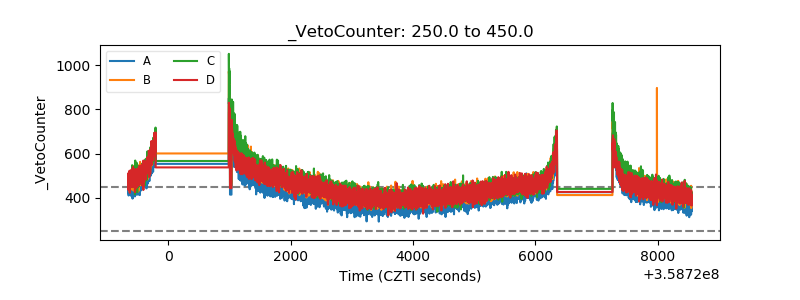 |