| Param | Original file | Final file |
|---|---|---|
| Filename | modeM0/AS1A10_121T02_9000004378_30430cztM0_level2.evt | modeM0/AS1A10_121T02_9000004378_30430cztM0_level2_quad_clean.evt |
| Size (bytes) | 661,832,640 | 102,435,840 |
| Size | 631.2 MB | 97.7 MB |
| Events in quadrant A | 3,712,485 | 677,273 |
| Events in quadrant B | 5,582,280 | 676,185 |
| Events in quadrant C | 3,698,338 | 660,906 |
| Events in quadrant D | 6,570,284 | 593,220 |
| Mode M0 | |||
|---|---|---|---|
| Quadrant | BADHDUFLAG | Total packets | Discarded packets |
| A | 0 | 15714 | 2 |
| B | 0 | 21728 | 2 |
| C | 0 | 15458 | 2 |
| D | 0 | 24627 | 3 |
| Mode SS | |||
|---|---|---|---|
| Quadrant | BADHDUFLAG | Total packets | Discarded packets |
| A | 0 | 142 | 0 |
| B | 0 | 142 | 0 |
| C | 0 | 142 | 0 |
| D | 0 | 142 | 0 |
| Mode M9 | |||
|---|---|---|---|
| Quadrant | BADHDUFLAG | Total packets | Discarded packets |
| A | 0 | 9 | 0 |
| B | 0 | 10 | 0 |
| C | 0 | 10 | 0 |
| D | 0 | 10 | 0 |
| Quadrant | Total seconds | Saturated seconds | Saturation percentage |
|---|---|---|---|
| A | 7106 | 84 | 1.182100% |
| B | 7106 | 150 | 2.110892% |
| C | 7106 | 179 | 2.518998% |
| D | 7105 | 1246 | 17.536946% |
Noise dominated data is calculated using 1-second bins in cleaned event files. If a bin has >2000 counts, and if more than 50% of those come from <1% of pixels, then it is considered to be noise-dominated and hence unusable.
| Quadrant | # 1 sec bins | Bins with >0 counts | Bins with >2000 counts | High rate bins dominated by noise | Noise dominated (total time) | Noise dominated (detector-on time) | Marked lightcurve |
|---|---|---|---|---|---|---|---|
| A | 7626 | 7107 | 24 | 24 | 0.31% | 0.34% | 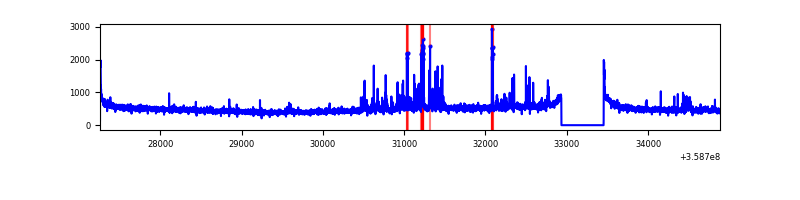 |
| B | 7626 | 7107 | 2 | 2 | 0.03% | 0.03% | 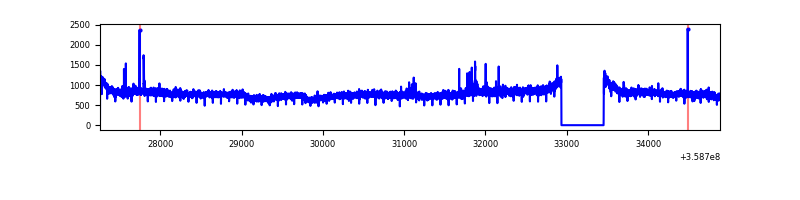 |
| C | 7626 | 7107 | 0 | 0 | 0.00% | 0.00% | 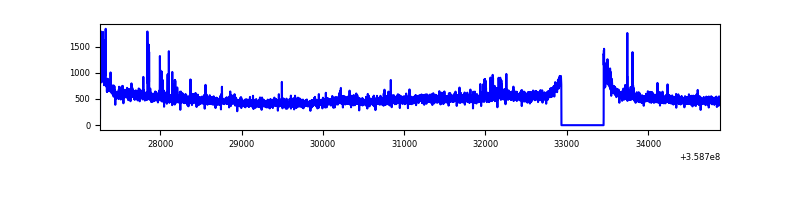 |
| D | 7625 | 7106 | 1180 | 1180 | 15.48% | 16.61% | 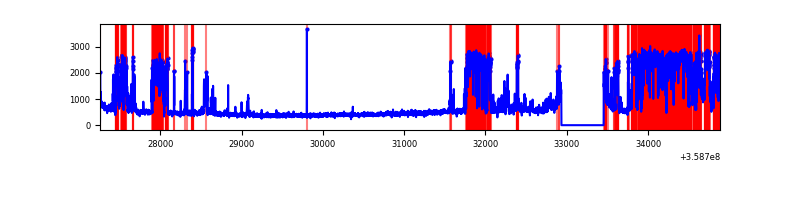 |
Top three noisy pixels from each quadrant. If the there are fewer than three noisy pixels in the level2.evt file, extra rows are filled as -1
| Pixel properties | Quadrant properties | ||||||
|---|---|---|---|---|---|---|---|
| Quadrant | DetID | PixID | Counts | Sigma | Mean | Median | Sigma |
| A | 4 | 2 | 268573 | 1514.01 | 876 | 857 | 176.8 |
| A | 14 | 239 | 30255 | 166.25 | 876 | 857 | 176.8 |
| A | 8 | 192 | 25359 | 138.57 | 876 | 857 | 176.8 |
| B | 6 | 159 | 2067110 | 12183.26 | 873 | 850 | 169.6 |
| B | 0 | 229 | 43567 | 251.87 | 873 | 850 | 169.6 |
| B | 12 | 111 | 20863 | 118.0 | 873 | 850 | 169.6 |
| C | 14 | 238 | 151137 | 752.89 | 848 | 852 | 199.6 |
| C | 3 | 233 | 134285 | 668.47 | 848 | 852 | 199.6 |
| C | 0 | 10 | 32520 | 158.65 | 848 | 852 | 199.6 |
| D | 13 | 104 | 3090012 | 15223.59 | 782 | 766 | 202.9 |
| D | 13 | 249 | 287115 | 1411.11 | 782 | 766 | 202.9 |
| D | 8 | 195 | 84716 | 413.7 | 782 | 766 | 202.9 |
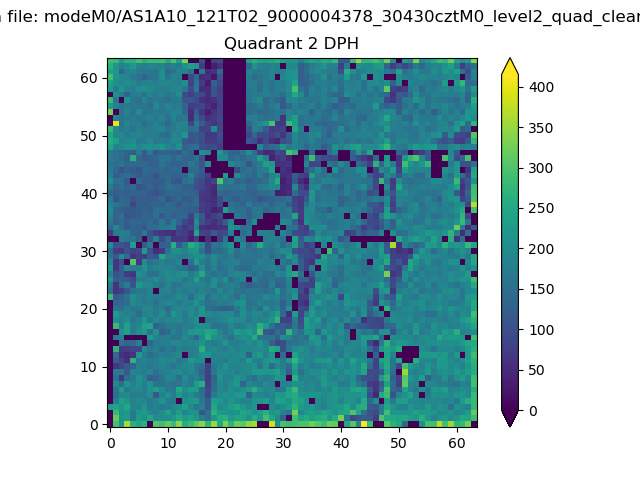
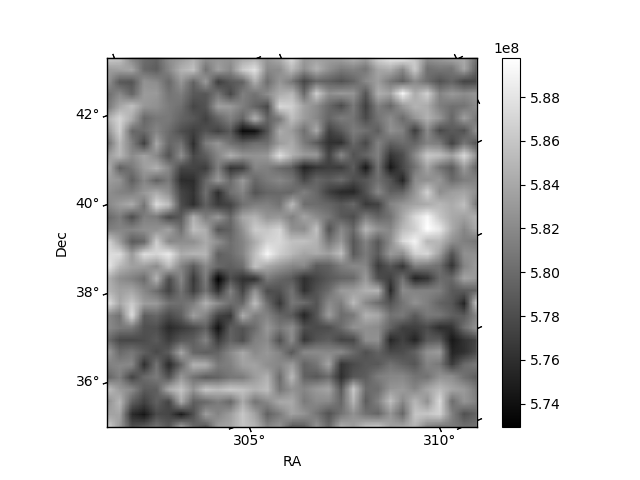
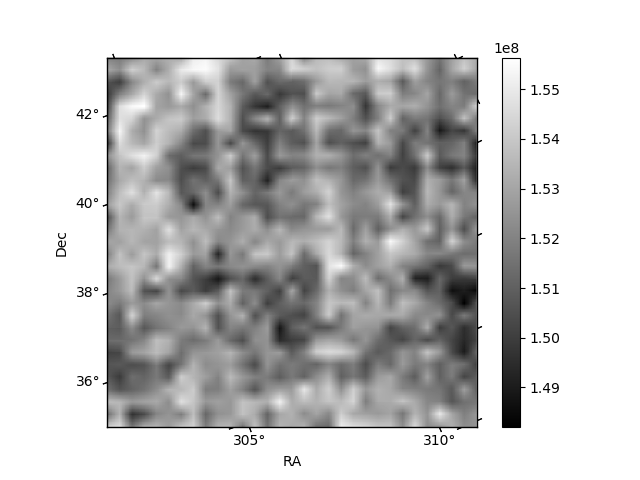
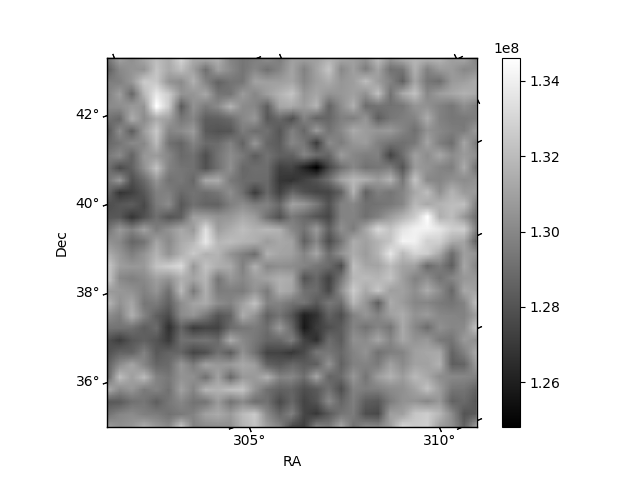
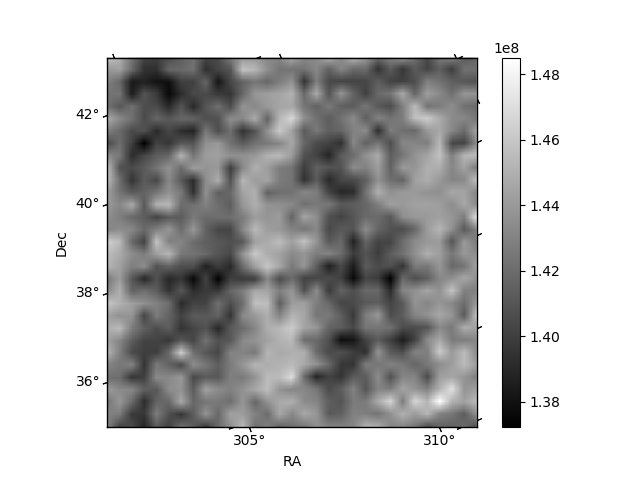
Histogram calculated using DETX and DETY for each event in the final _common_clean file
| Quadrant A | 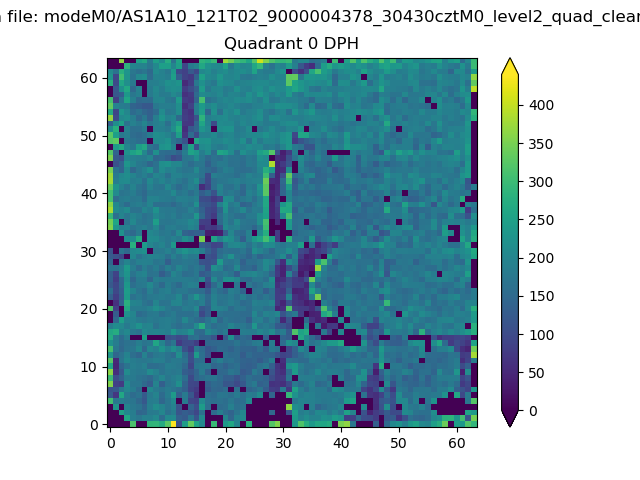 |
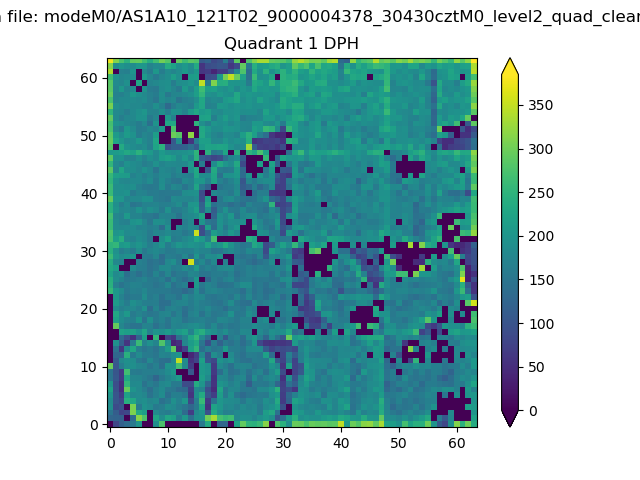 |
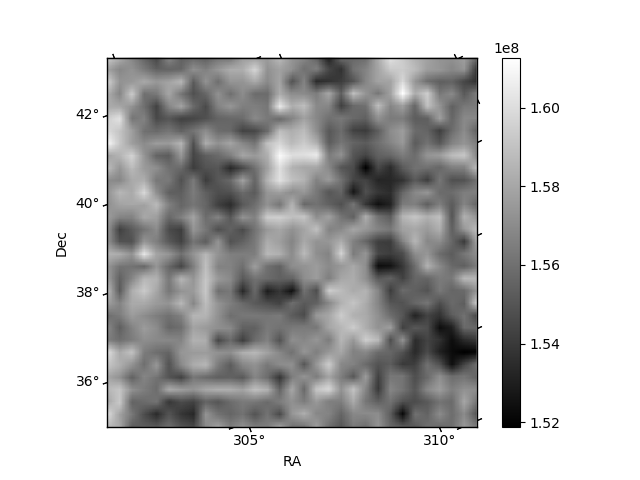
Quadrant B |
|---|---|---|---|
| Quadrant D | 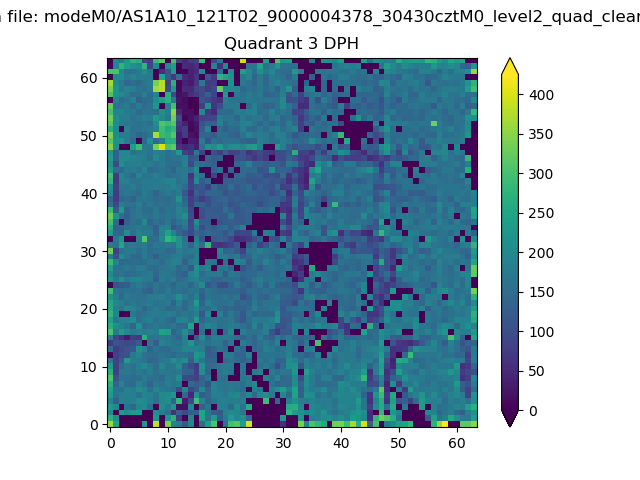 |
 |
Quadrant C |
| Plot type | Count rate plots | Images |
|---|---|---|
| Comparison with Poisson distribution Blue bars denote a histogram of data divided into 1 sec bins. Red curve is a Poisson curve with rate = median count rate of data. |
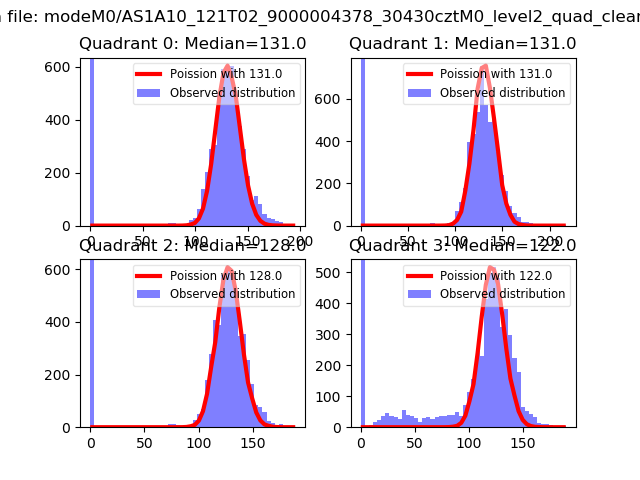 |
 |
| Quadrant-wise count rates Data is divided into 100 sec bins |
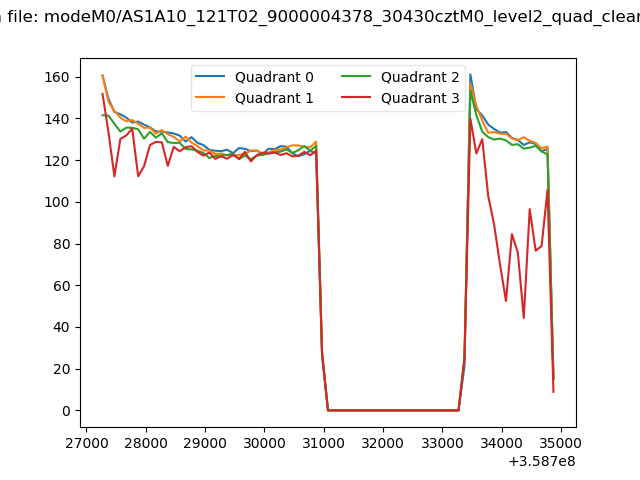 |
|
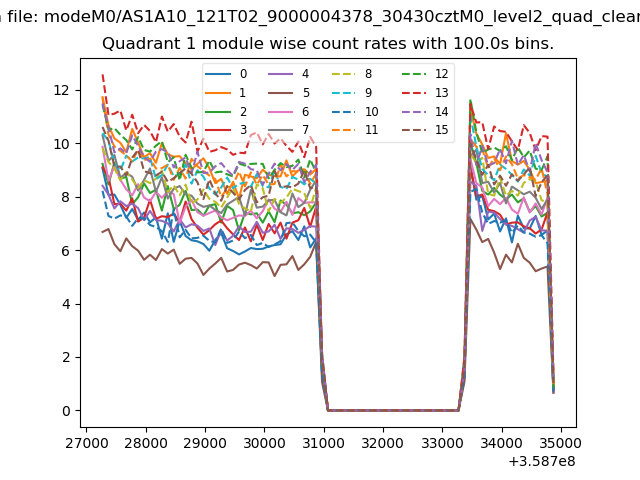
| Module-wise count rates for Quadrant A Data is divided into 100 sec bins |
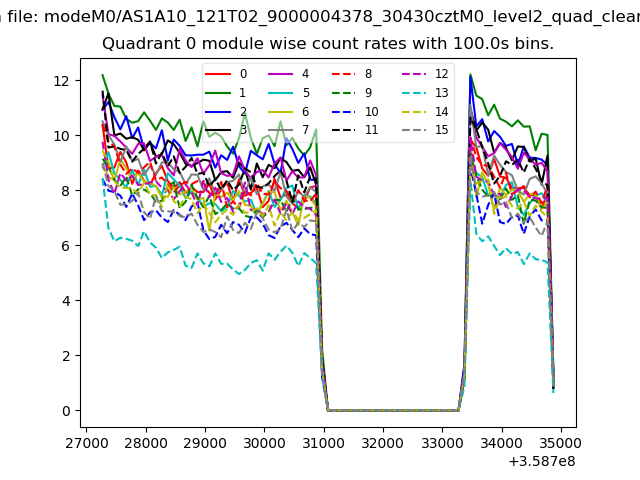 |
 |
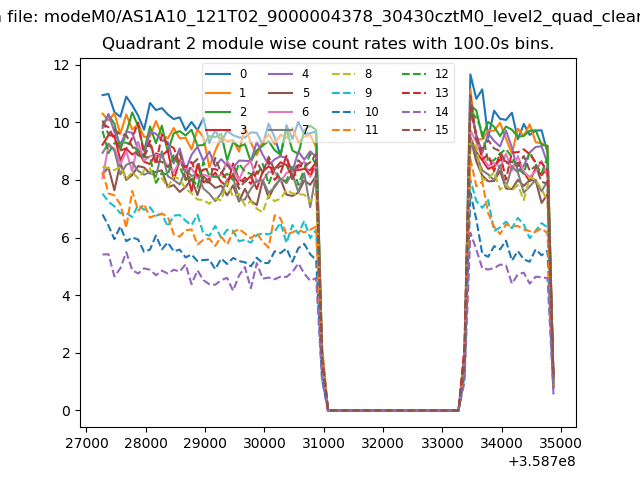
| Module-wise count rates for Quadrant B Data is divided into 100 sec bins |
 |
 |
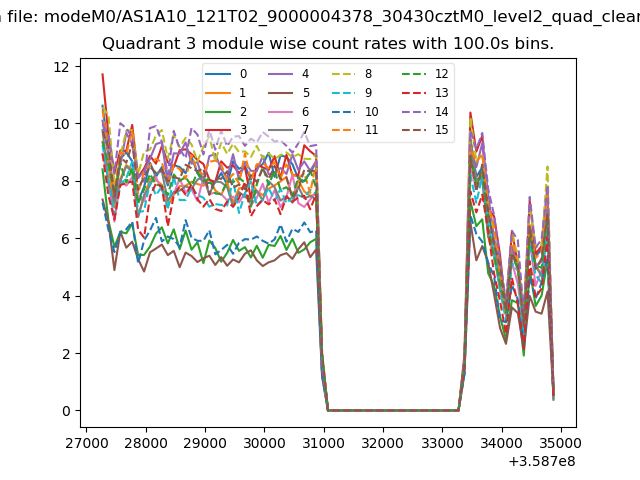
| Module-wise count rates for Quadrant C Data is divided into 100 sec bins |
 |
 |
| Module-wise count rates for Quadrant D Data is divided into 100 sec bins |
 |
 |
| Parameter | Plot |
|---|---|
| CZT HV Monitor | 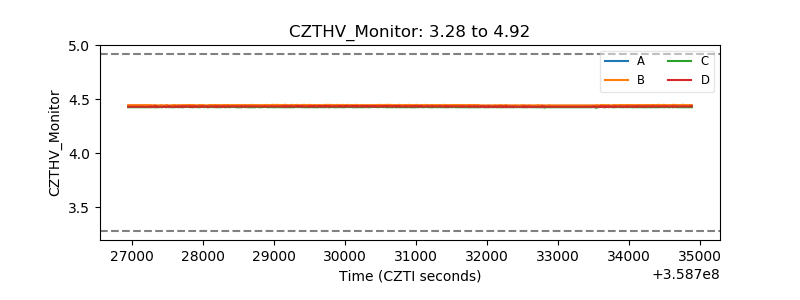 |
| D_VDD | 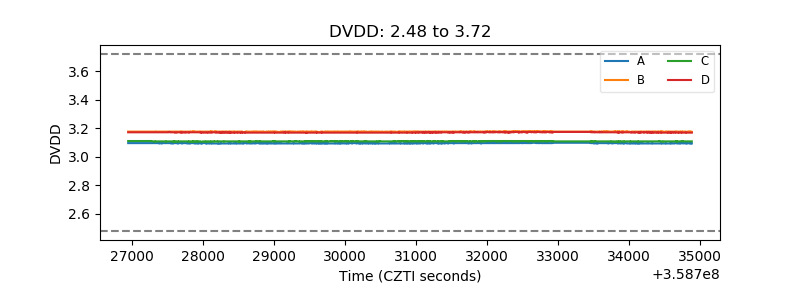 |
| Temperature 1 | 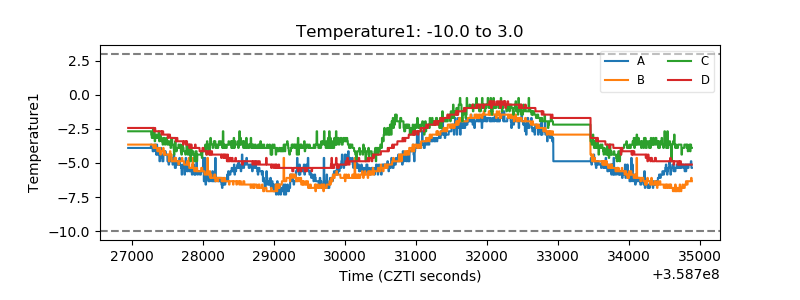 |
| Veto HV Monitor | 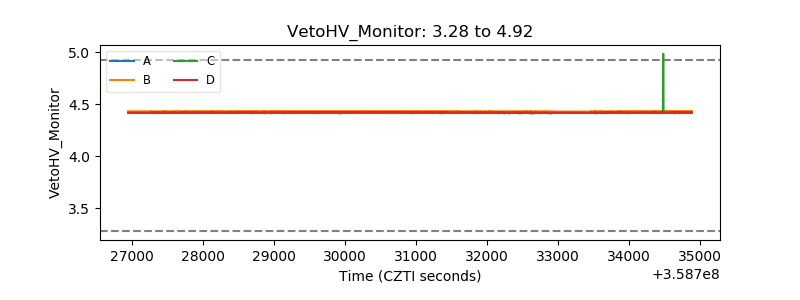 |
| Veto LLD | 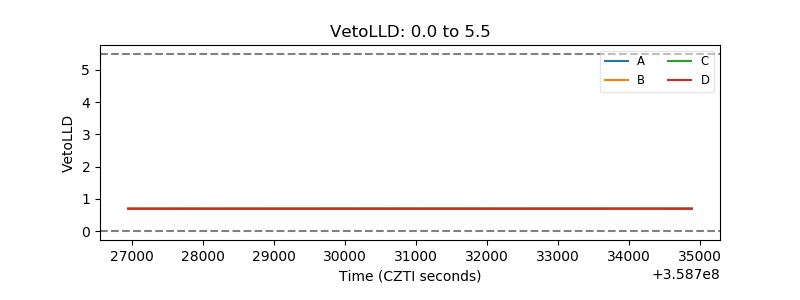 |
| Alpha Counter | 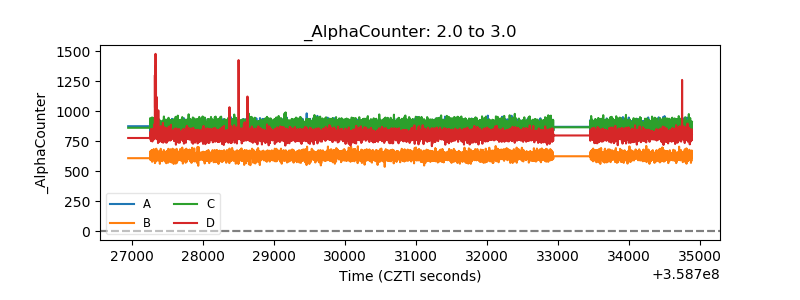 |
| _CPM_Rate | 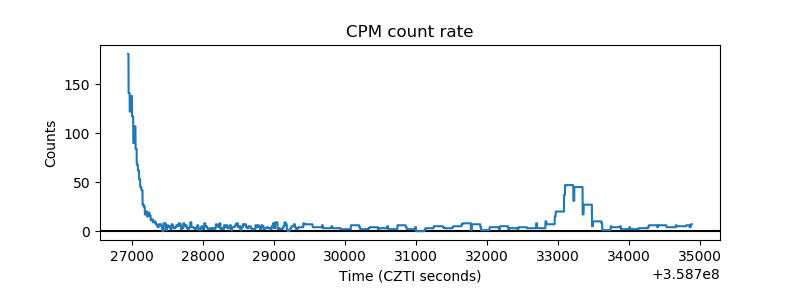 |
| CZT Counter | 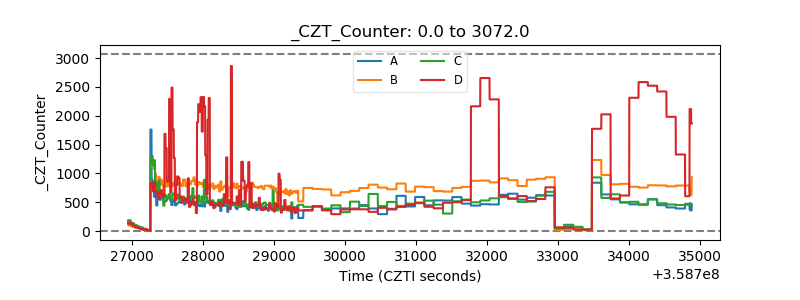 |
| +2.5 Volts monitor |  |
| +5 Volts monitor |  |
| _ROLL_ROT | 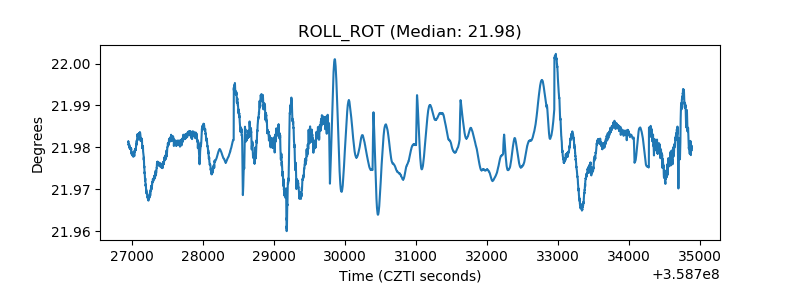 |
| _Roll_DEC | 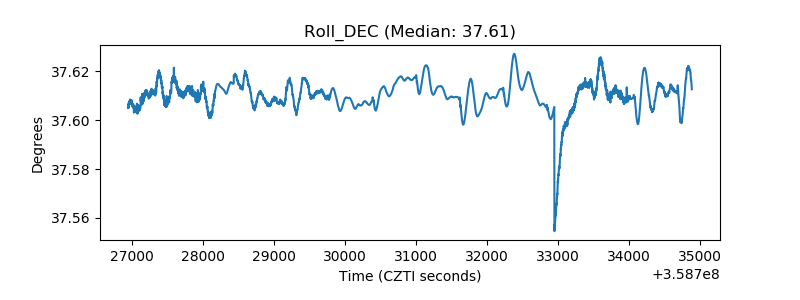 |
| _Roll_RA | 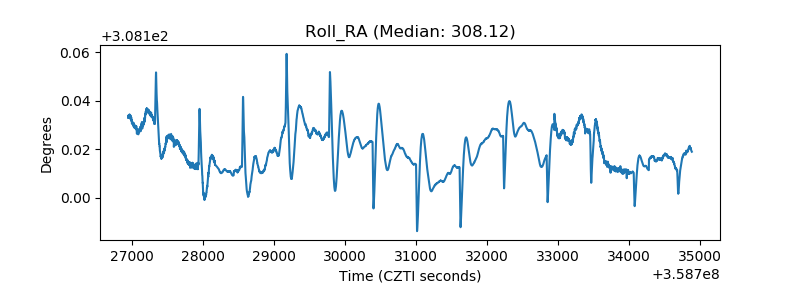 |
| Veto Counter | 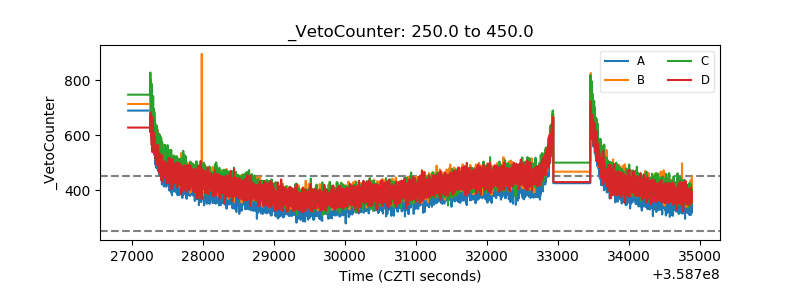 |