| Param | Original file | Final file |
|---|---|---|
| Filename | modeM0/AS1A10_121T02_9000004378_30431cztM0_level2.evt | modeM0/AS1A10_121T02_9000004378_30431cztM0_level2_quad_clean.evt |
| Size (bytes) | 779,448,960 | 109,607,040 |
| Size | 743.3 MB | 104.5 MB |
| Events in quadrant A | 4,128,567 | 714,025 |
| Events in quadrant B | 6,440,420 | 712,596 |
| Events in quadrant C | 4,203,001 | 698,383 |
| Events in quadrant D | 8,283,098 | 627,748 |
| Mode M0 | |||
|---|---|---|---|
| Quadrant | BADHDUFLAG | Total packets | Discarded packets |
| A | 0 | 17662 | 2 |
| B | 0 | 25102 | 2 |
| C | 0 | 17630 | 2 |
| D | 0 | 30636 | 2 |
| Mode SS | |||
|---|---|---|---|
| Quadrant | BADHDUFLAG | Total packets | Discarded packets |
| A | 0 | 166 | 0 |
| B | 0 | 166 | 0 |
| C | 0 | 166 | 0 |
| D | 0 | 166 | 0 |
| Mode M9 | |||
|---|---|---|---|
| Quadrant | BADHDUFLAG | Total packets | Discarded packets |
| A | 0 | 8 | 0 |
| B | 0 | 8 | 0 |
| C | 0 | 8 | 0 |
| D | 0 | 8 | 0 |
| Quadrant | Total seconds | Saturated seconds | Saturation percentage |
|---|---|---|---|
| A | 8149 | 106 | 1.300773% |
| B | 8150 | 297 | 3.644172% |
| C | 8150 | 244 | 2.993865% |
| D | 8150 | 1550 | 19.018405% |
Noise dominated data is calculated using 1-second bins in cleaned event files. If a bin has >2000 counts, and if more than 50% of those come from <1% of pixels, then it is considered to be noise-dominated and hence unusable.
| Quadrant | # 1 sec bins | Bins with >0 counts | Bins with >2000 counts | High rate bins dominated by noise | Noise dominated (total time) | Noise dominated (detector-on time) | Marked lightcurve |
|---|---|---|---|---|---|---|---|
| A | 8879 | 8150 | 1 | 1 | 0.01% | 0.01% | 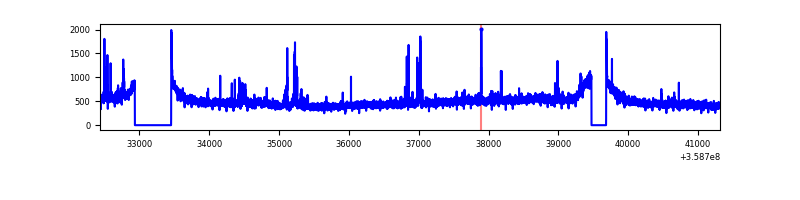 |
| B | 8880 | 8151 | 1 | 1 | 0.01% | 0.01% | 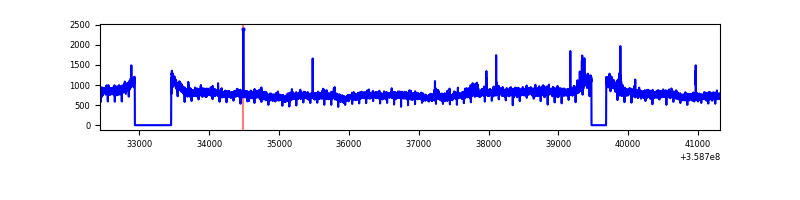 |
| C | 8880 | 8151 | 0 | 0 | 0.00% | 0.00% | 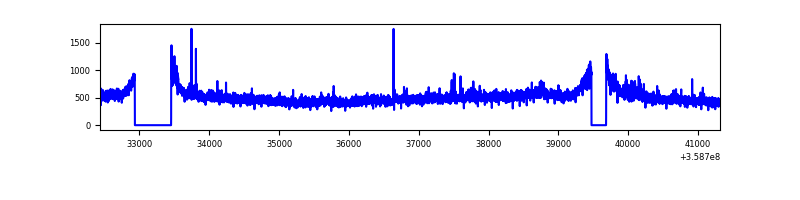 |
| D | 8880 | 8151 | 1407 | 1407 | 15.84% | 17.26% | 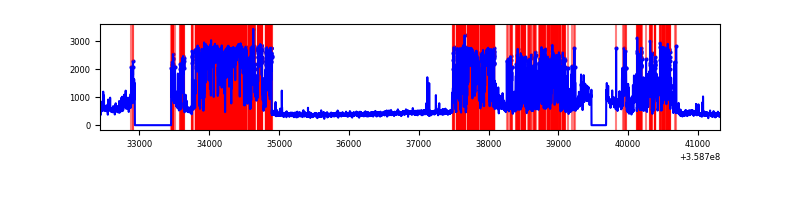 |
Top three noisy pixels from each quadrant. If the there are fewer than three noisy pixels in the level2.evt file, extra rows are filled as -1
| Pixel properties | Quadrant properties | ||||||
|---|---|---|---|---|---|---|---|
| Quadrant | DetID | PixID | Counts | Sigma | Mean | Median | Sigma |
| A | 14 | 239 | 86876 | 414.29 | 1022 | 999 | 207.3 |
| A | 0 | 13 | 31910 | 149.12 | 1022 | 999 | 207.3 |
| A | 8 | 192 | 26714 | 124.05 | 1022 | 999 | 207.3 |
| B | 6 | 159 | 2355386 | 12026.52 | 1012 | 984 | 195.8 |
| B | 0 | 229 | 59854 | 300.71 | 1012 | 984 | 195.8 |
| B | 0 | 230 | 25445 | 124.95 | 1012 | 984 | 195.8 |
| C | 14 | 238 | 173393 | 731.87 | 988 | 997 | 235.6 |
| C | 3 | 233 | 117750 | 495.65 | 988 | 997 | 235.6 |
| C | 14 | 254 | 25098 | 102.31 | 988 | 997 | 235.6 |
| D | 13 | 104 | 4411940 | 18184.47 | 909 | 895 | 242.6 |
| D | 8 | 195 | 141777 | 580.78 | 909 | 895 | 242.6 |
| D | 13 | 249 | 102027 | 416.92 | 909 | 895 | 242.6 |
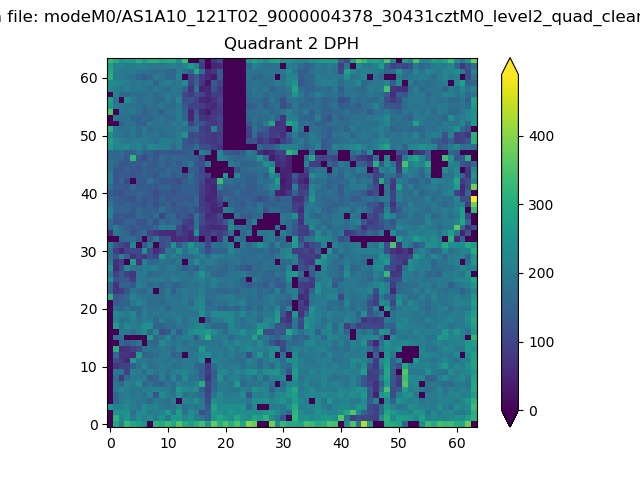
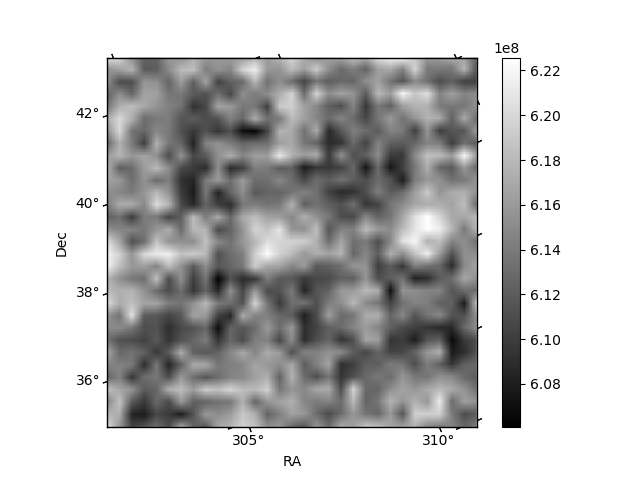
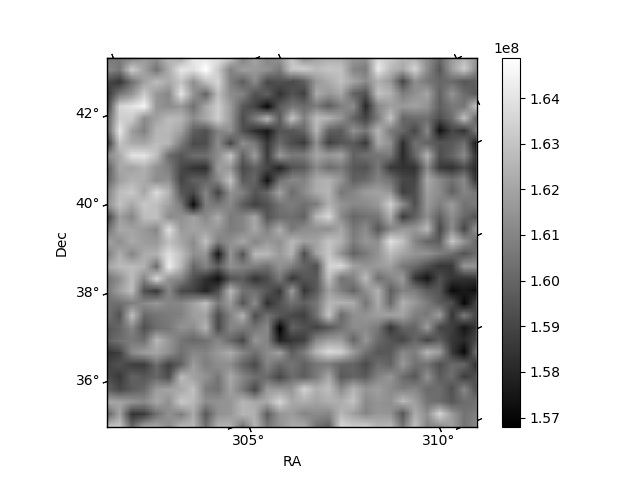
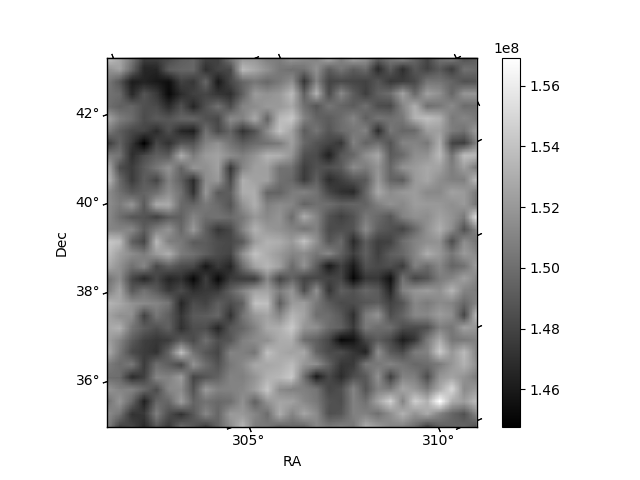
Histogram calculated using DETX and DETY for each event in the final _common_clean file
| Quadrant A | 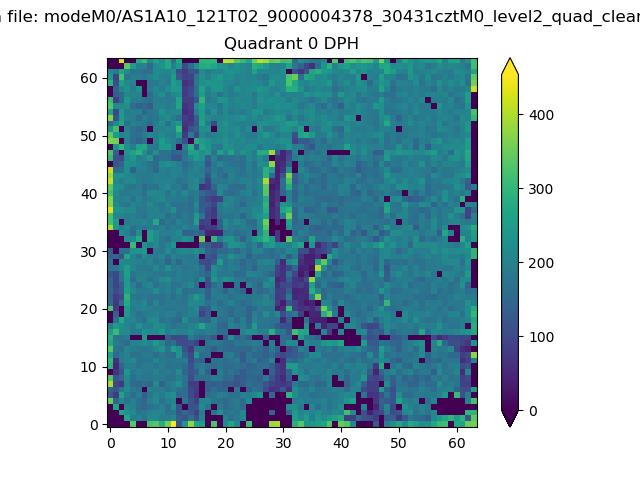 |
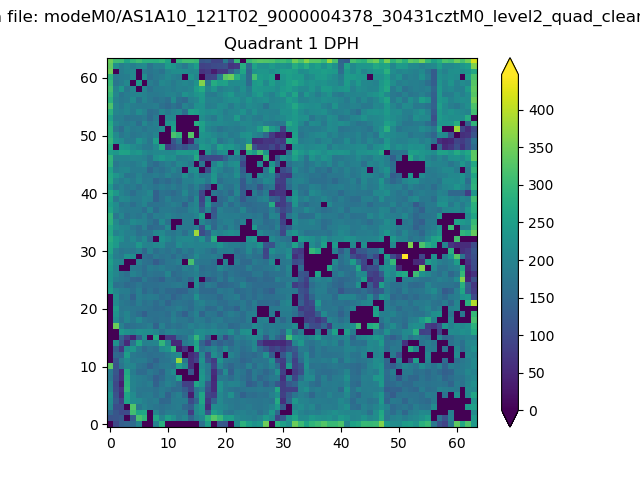 |
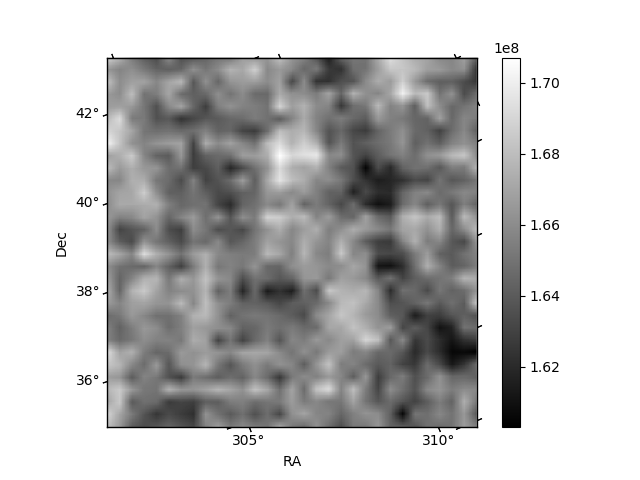
Quadrant B |
|---|---|---|---|
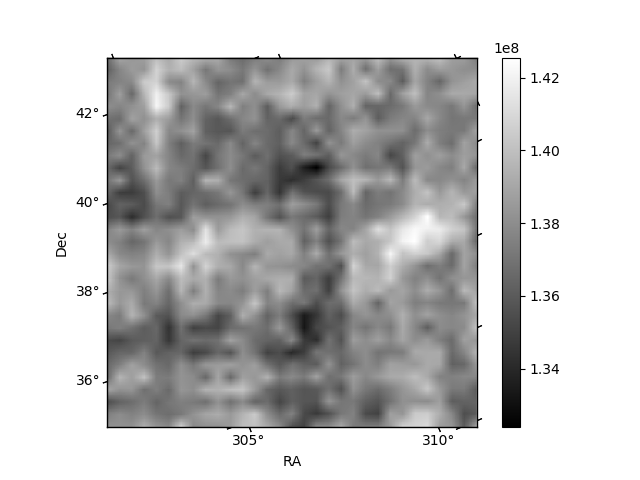
| Quadrant D | 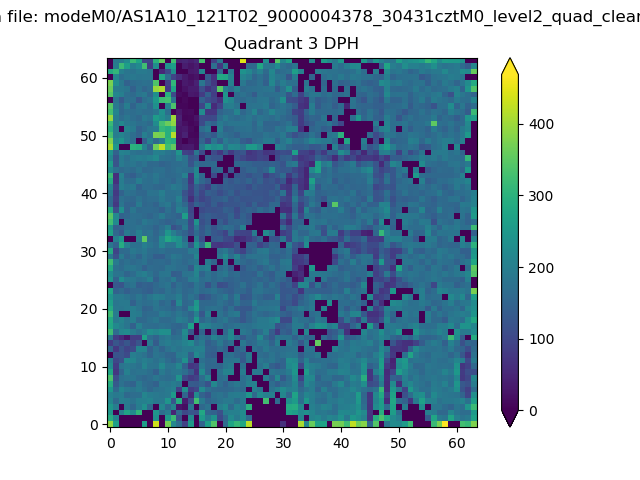 |
 |
Quadrant C |
| Plot type | Count rate plots | Images |
|---|---|---|
| Comparison with Poisson distribution Blue bars denote a histogram of data divided into 1 sec bins. Red curve is a Poisson curve with rate = median count rate of data. |
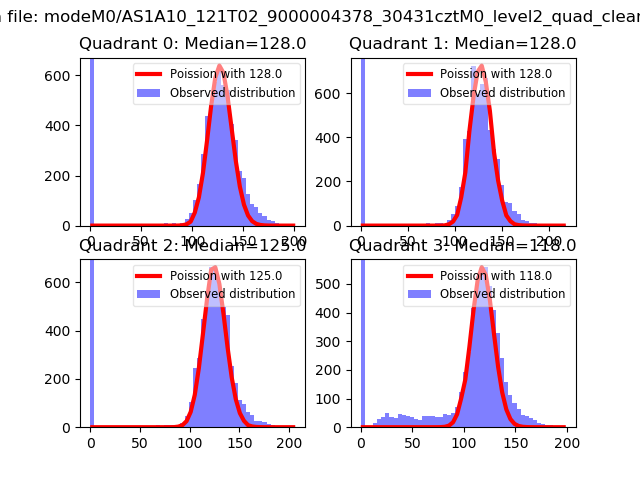 |
 |
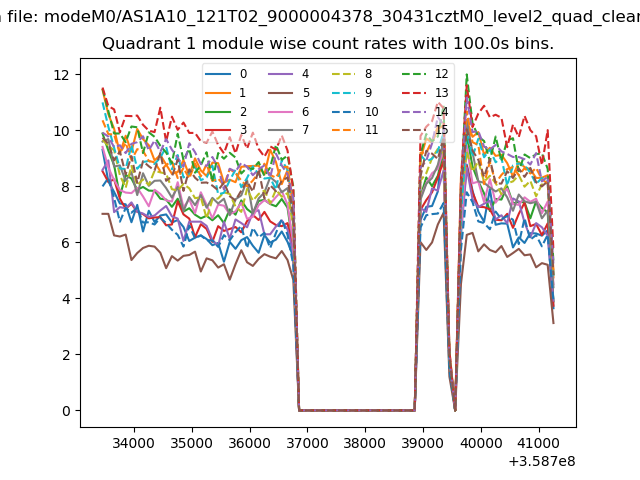
| Quadrant-wise count rates Data is divided into 100 sec bins |
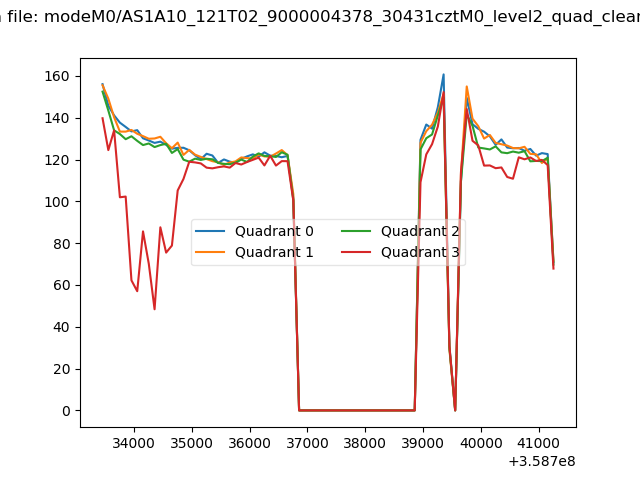 |
|
| Module-wise count rates for Quadrant A Data is divided into 100 sec bins |
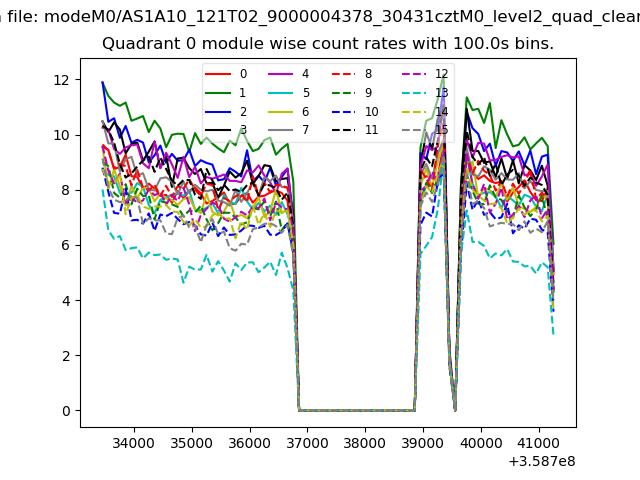 |
 |
| Module-wise count rates for Quadrant B Data is divided into 100 sec bins |
 |
 |
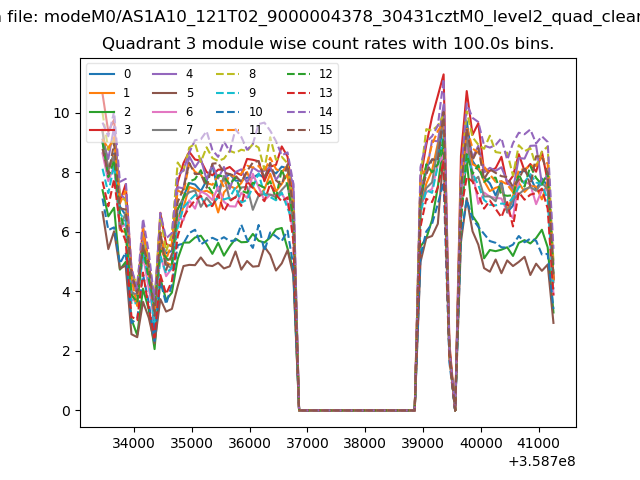
| Module-wise count rates for Quadrant C Data is divided into 100 sec bins |
 |
 |
| Module-wise count rates for Quadrant D Data is divided into 100 sec bins |
 |
 |
| Parameter | Plot |
|---|---|
| CZT HV Monitor | 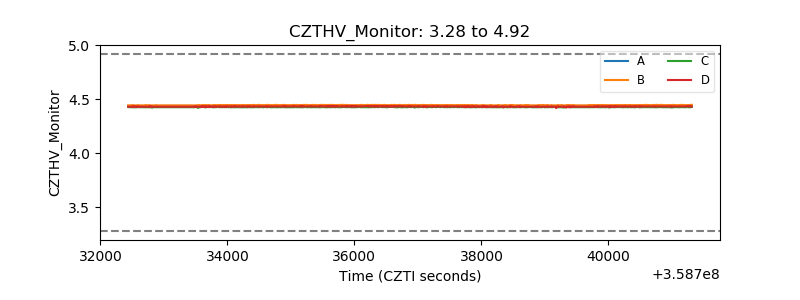 |
| D_VDD | 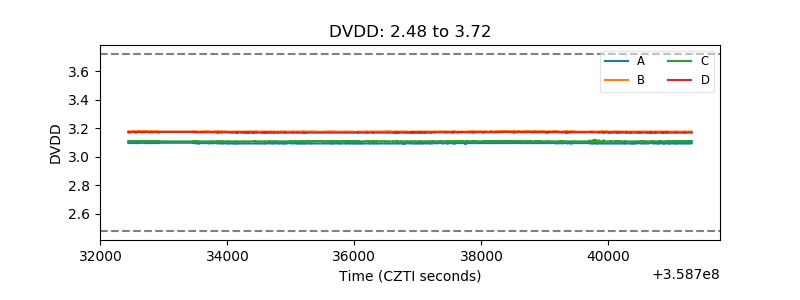 |
| Temperature 1 | 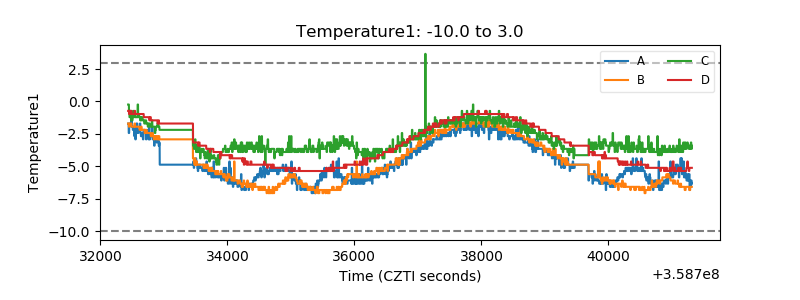 |
| Veto HV Monitor | 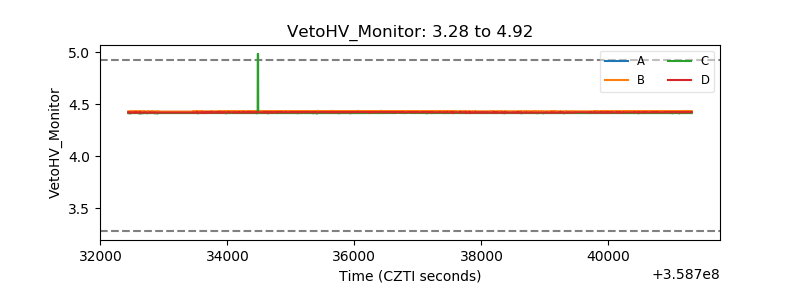 |
| Veto LLD | 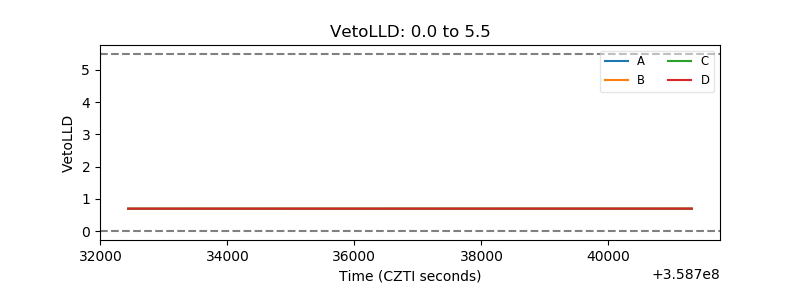 |
| Alpha Counter | 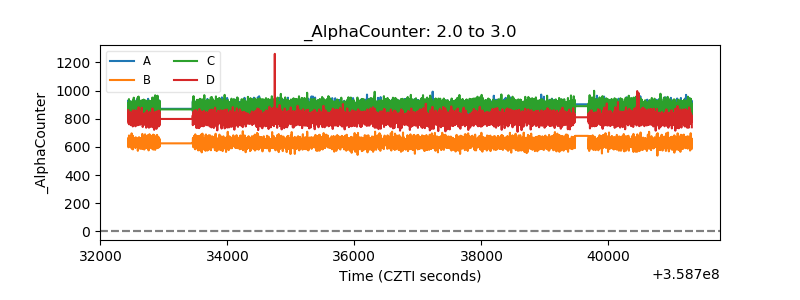 |
| _CPM_Rate | 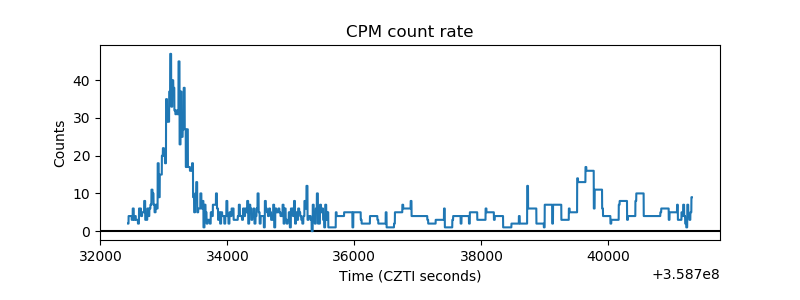 |
| CZT Counter | 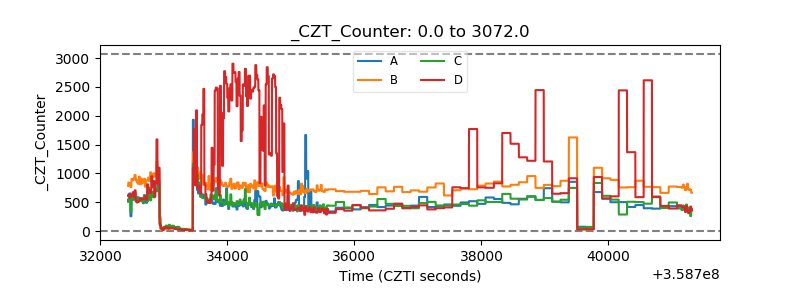 |
| +2.5 Volts monitor |  |
| +5 Volts monitor |  |
| _ROLL_ROT | 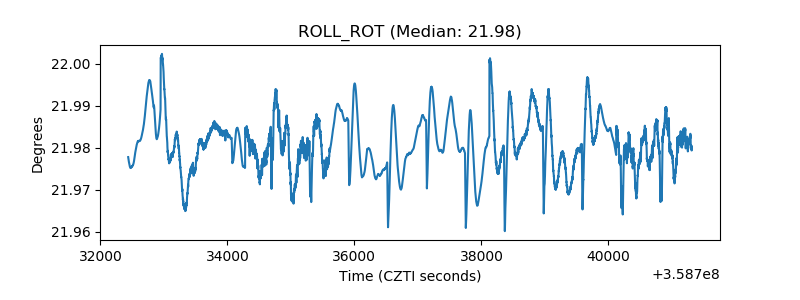 |
| _Roll_DEC | 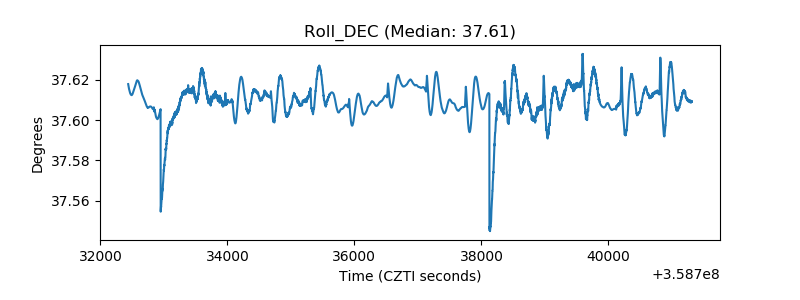 |
| _Roll_RA | 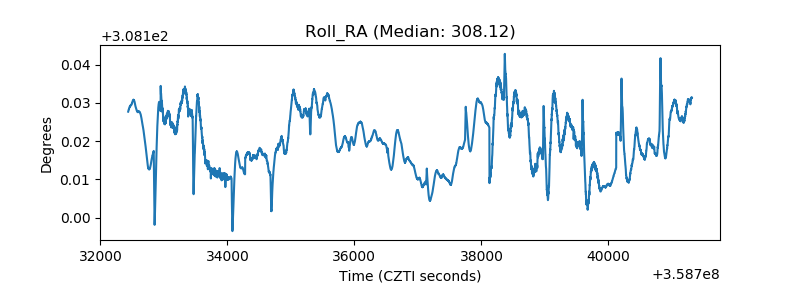 |
| Veto Counter | 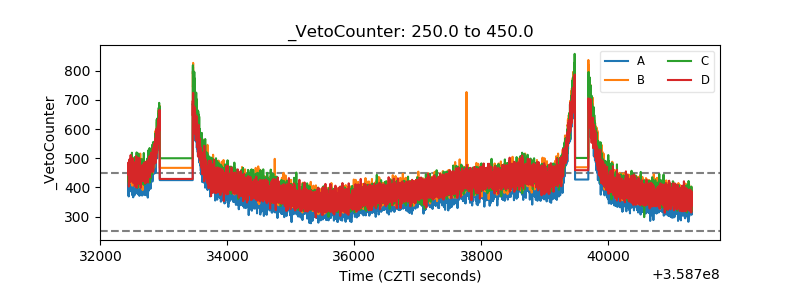 |