| Param | Original file | Final file |
|---|---|---|
| Filename | modeM0/AS1A10_121T02_9000004378_30432cztM0_level2.evt | modeM0/AS1A10_121T02_9000004378_30432cztM0_level2_quad_clean.evt |
| Size (bytes) | 570,896,640 | 94,924,800 |
| Size | 544.4 MB | 90.5 MB |
| Events in quadrant A | 3,229,098 | 610,847 |
| Events in quadrant B | 5,337,042 | 611,382 |
| Events in quadrant C | 3,361,841 | 600,646 |
| Events in quadrant D | 4,888,985 | 565,711 |
| Mode M0 | |||
|---|---|---|---|
| Quadrant | BADHDUFLAG | Total packets | Discarded packets |
| A | 0 | 14352 | 1 |
| B | 0 | 21128 | 1 |
| C | 0 | 14490 | 2 |
| D | 0 | 19607 | 1 |
| Mode SS | |||
|---|---|---|---|
| Quadrant | BADHDUFLAG | Total packets | Discarded packets |
| A | 0 | 140 | 0 |
| B | 0 | 140 | 0 |
| C | 0 | 140 | 0 |
| D | 0 | 140 | 0 |
| Mode M9 | |||
|---|---|---|---|
| Quadrant | BADHDUFLAG | Total packets | Discarded packets |
| A | 0 | 4 | 0 |
| B | 0 | 4 | 0 |
| C | 0 | 4 | 0 |
| D | 0 | 4 | 0 |
| Quadrant | Total seconds | Saturated seconds | Saturation percentage |
|---|---|---|---|
| A | 6980 | 56 | 0.802292% |
| B | 6981 | 125 | 1.790574% |
| C | 6980 | 107 | 1.532951% |
| D | 6980 | 486 | 6.962751% |
Noise dominated data is calculated using 1-second bins in cleaned event files. If a bin has >2000 counts, and if more than 50% of those come from <1% of pixels, then it is considered to be noise-dominated and hence unusable.
| Quadrant | # 1 sec bins | Bins with >0 counts | Bins with >2000 counts | High rate bins dominated by noise | Noise dominated (total time) | Noise dominated (detector-on time) | Marked lightcurve |
|---|---|---|---|---|---|---|---|
| A | 7310 | 6980 | 0 | 0 | 0.00% | 0.00% | 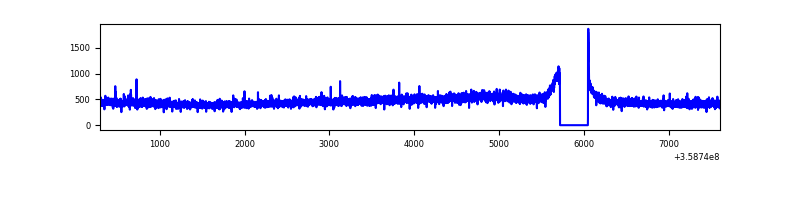 |
| B | 7311 | 6981 | 1 | 1 | 0.01% | 0.01% | 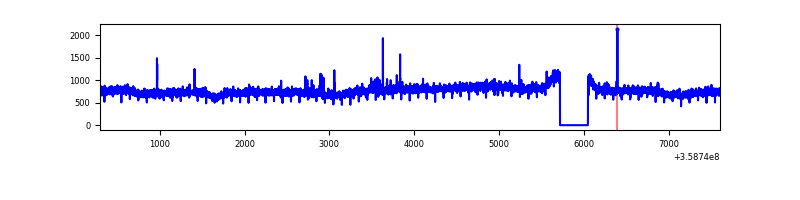 |
| C | 7310 | 6980 | 0 | 0 | 0.00% | 0.00% | 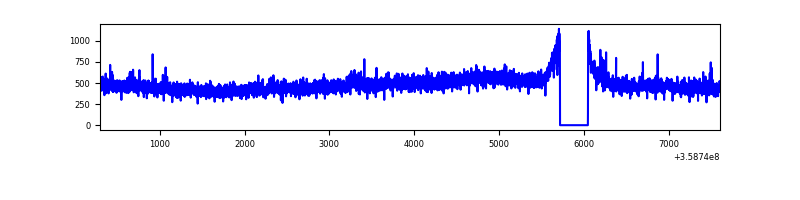 |
| D | 7310 | 6980 | 361 | 361 | 4.94% | 5.17% | 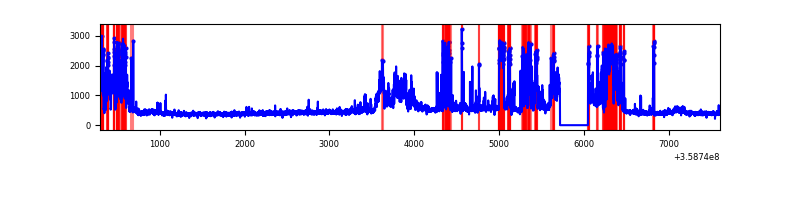 |
Top three noisy pixels from each quadrant. If the there are fewer than three noisy pixels in the level2.evt file, extra rows are filled as -1
| Pixel properties | Quadrant properties | ||||||
|---|---|---|---|---|---|---|---|
| Quadrant | DetID | PixID | Counts | Sigma | Mean | Median | Sigma |
| A | 13 | 254 | 12710 | 71.04 | 830 | 813 | 167.5 |
| A | 8 | 192 | 11269 | 62.44 | 830 | 813 | 167.5 |
| A | 14 | 239 | 9973 | 54.7 | 830 | 813 | 167.5 |
| B | 6 | 159 | 2021232 | 12665.39 | 824 | 802 | 159.5 |
| B | 0 | 229 | 49582 | 305.79 | 824 | 802 | 159.5 |
| B | 12 | 111 | 19866 | 119.51 | 824 | 802 | 159.5 |
| C | 14 | 238 | 134453 | 708.36 | 799 | 805 | 188.7 |
| C | 3 | 233 | 83885 | 440.34 | 799 | 805 | 188.7 |
| C | 2 | 114 | 16509 | 83.23 | 799 | 805 | 188.7 |
| D | 13 | 104 | 1530447 | 7496.73 | 773 | 758 | 204.0 |
| D | 13 | 249 | 199801 | 975.47 | 773 | 758 | 204.0 |
| D | 8 | 195 | 120690 | 587.77 | 773 | 758 | 204.0 |
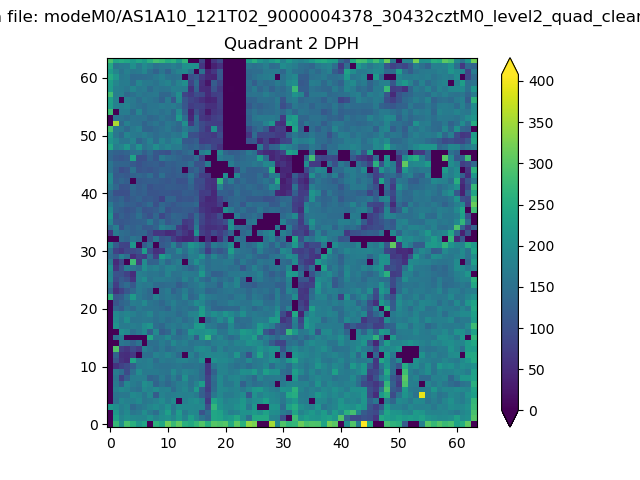
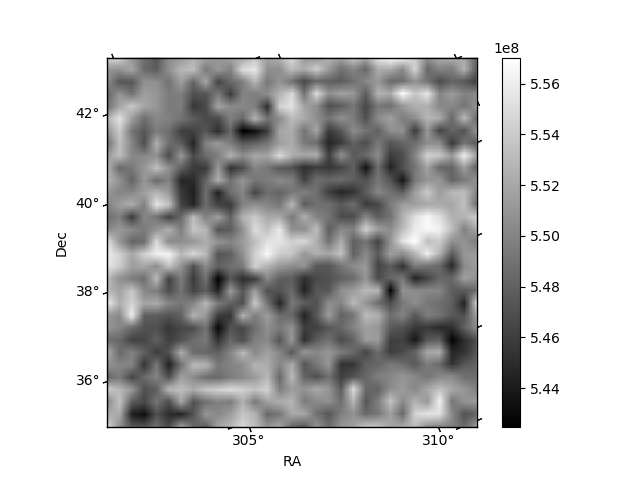
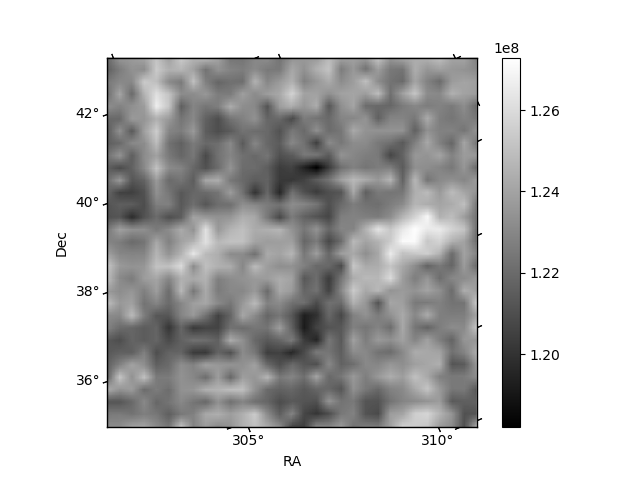
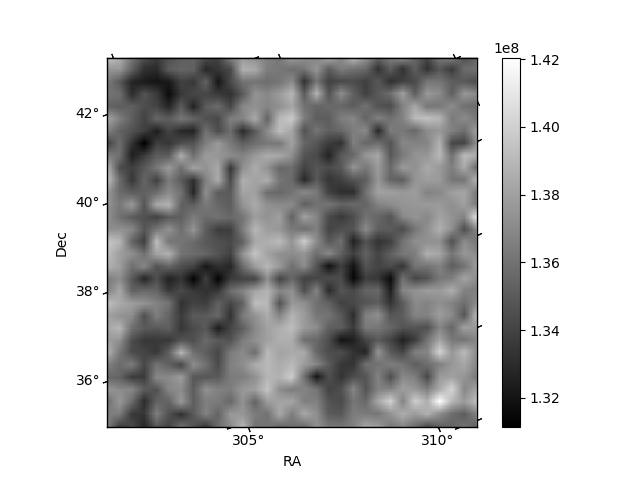
Histogram calculated using DETX and DETY for each event in the final _common_clean file
| Quadrant A | 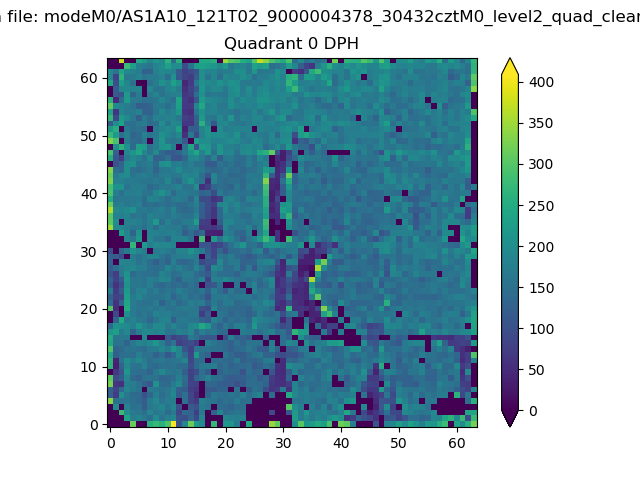 |
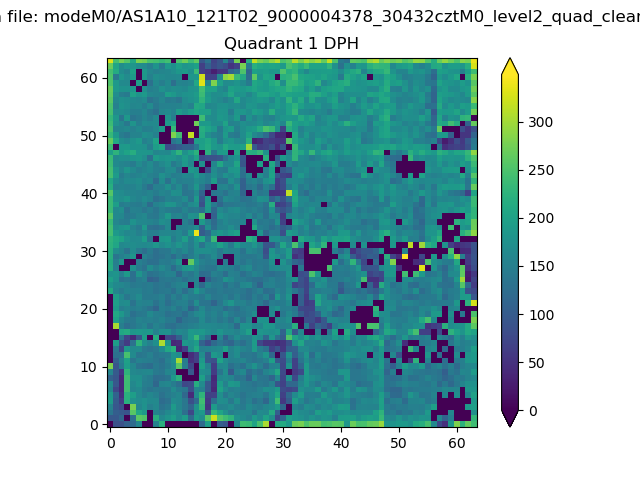 |
Quadrant B |
|---|---|---|---|
| Quadrant D | 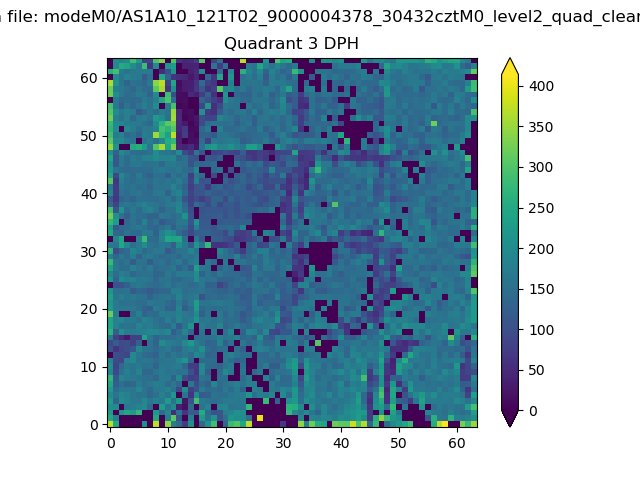 |
 |
Quadrant C |
| Plot type | Count rate plots | Images |
|---|---|---|
| Comparison with Poisson distribution Blue bars denote a histogram of data divided into 1 sec bins. Red curve is a Poisson curve with rate = median count rate of data. |
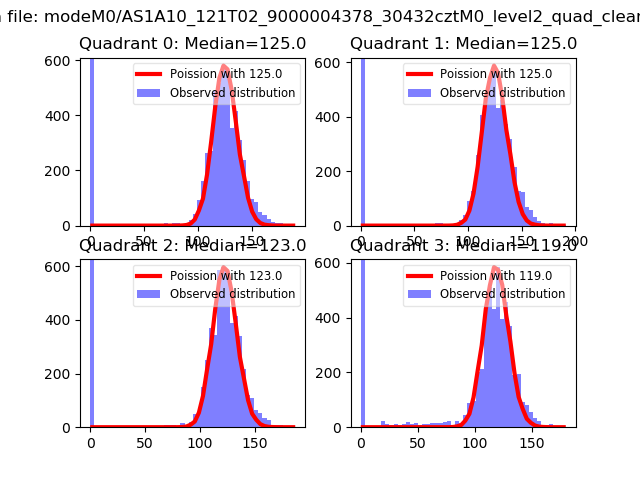 |
 |
| Quadrant-wise count rates Data is divided into 100 sec bins |
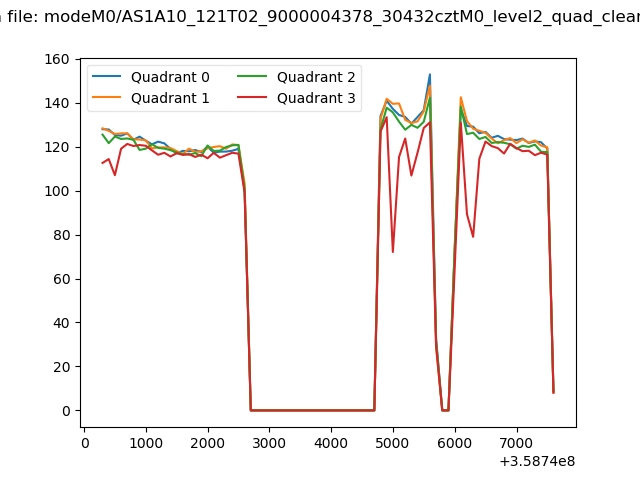 |
|
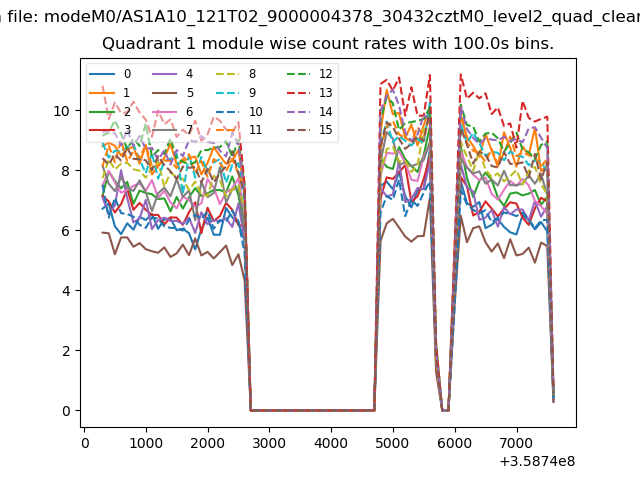
| Module-wise count rates for Quadrant A Data is divided into 100 sec bins |
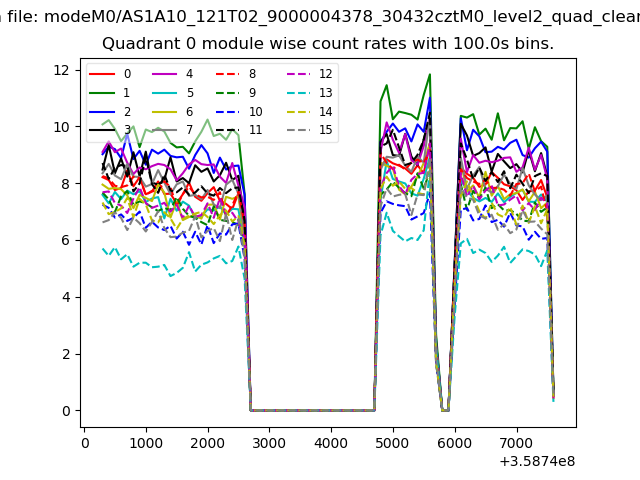 |
 |
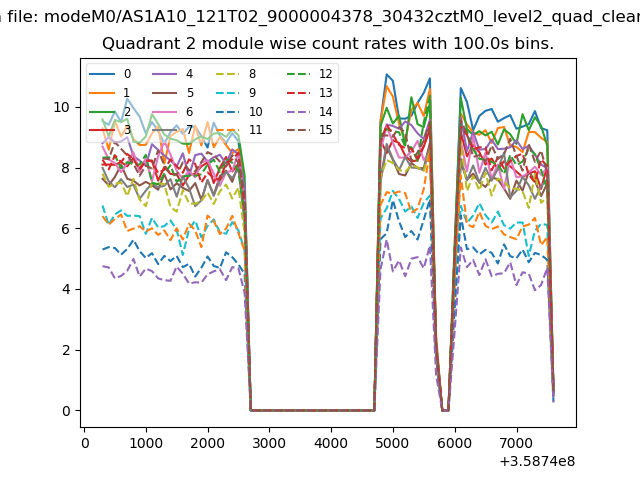
| Module-wise count rates for Quadrant B Data is divided into 100 sec bins |
 |
 |
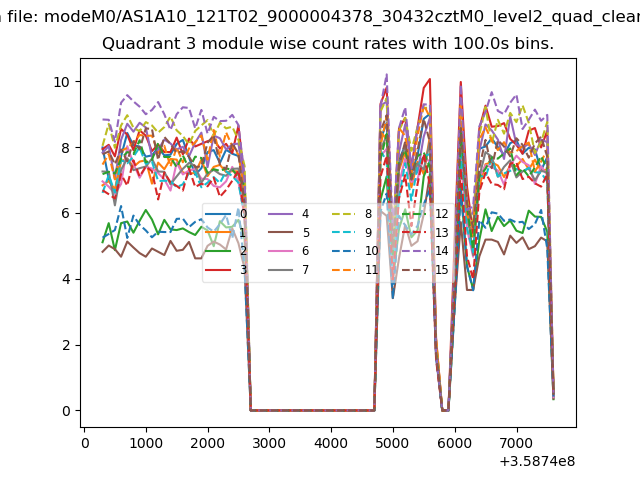
| Module-wise count rates for Quadrant C Data is divided into 100 sec bins |
 |
 |
| Module-wise count rates for Quadrant D Data is divided into 100 sec bins |
 |
 |
| Parameter | Plot |
|---|---|
| CZT HV Monitor | 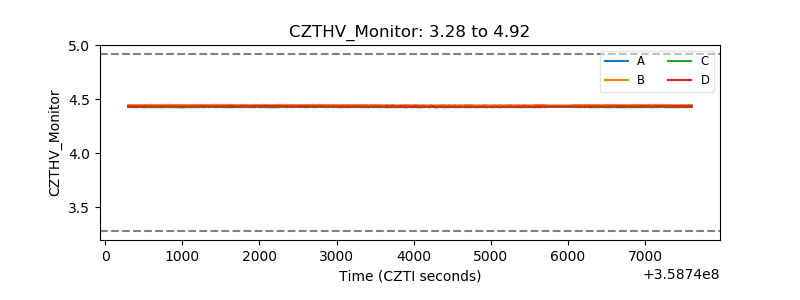 |
| D_VDD |  |
| Temperature 1 | 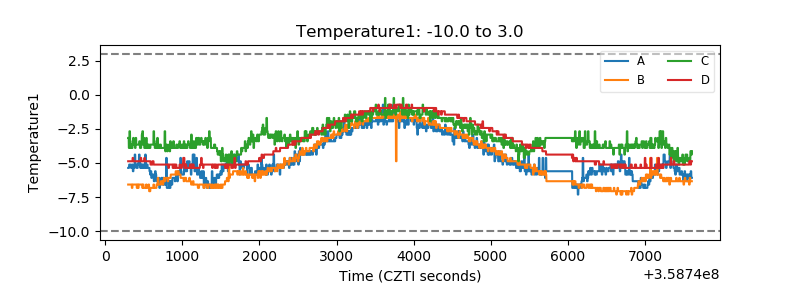 |
| Veto HV Monitor | 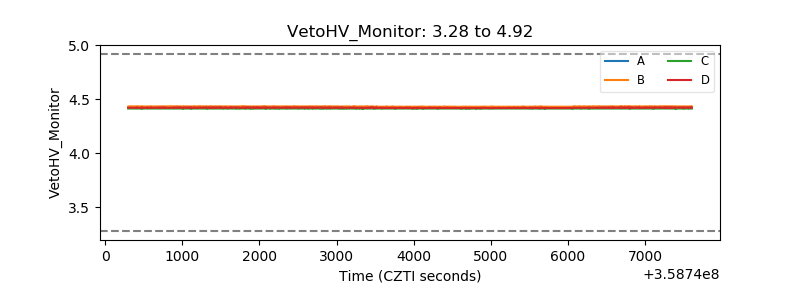 |
| Veto LLD | 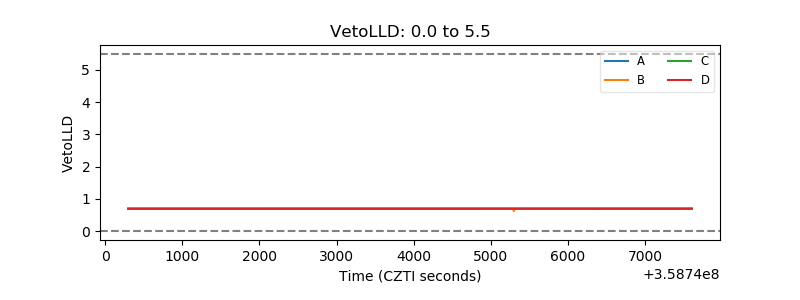 |
| Alpha Counter | 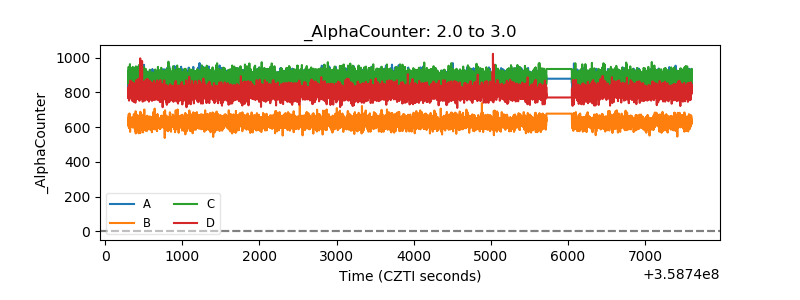 |
| _CPM_Rate | 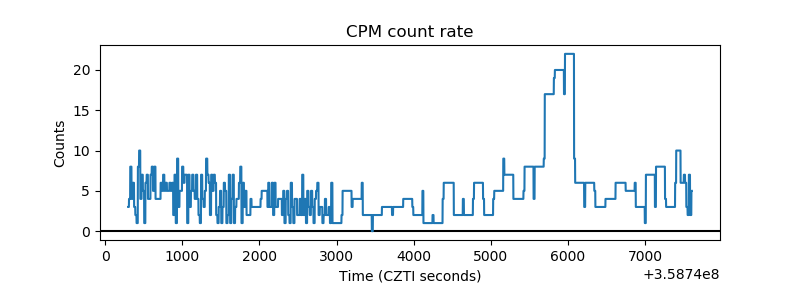 |
| CZT Counter | 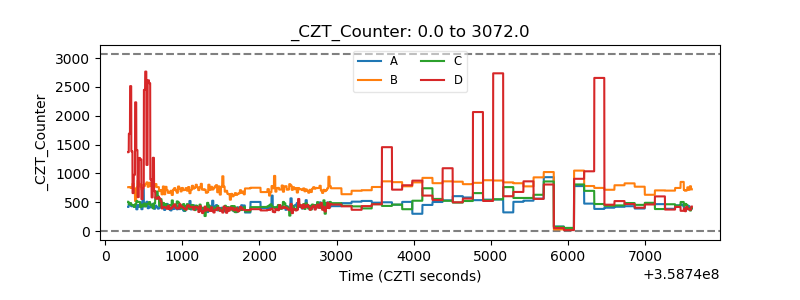 |
| +2.5 Volts monitor | 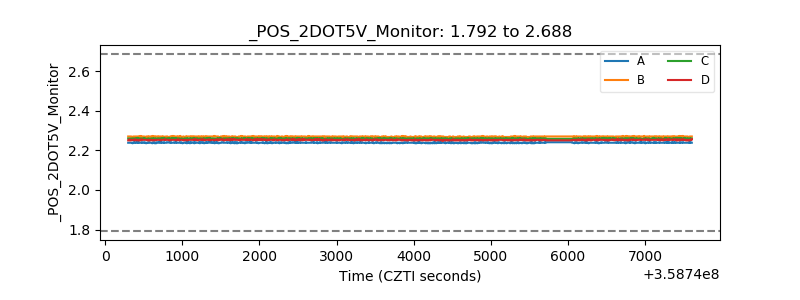 |
| +5 Volts monitor |  |
| _ROLL_ROT | 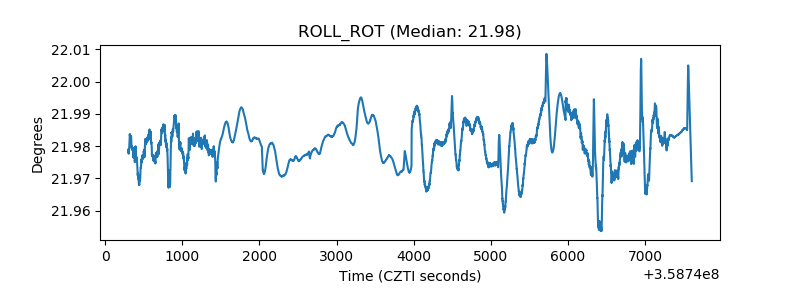 |
| _Roll_DEC | 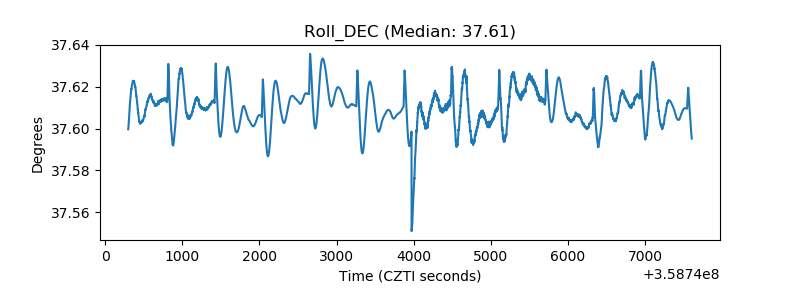 |
| _Roll_RA | 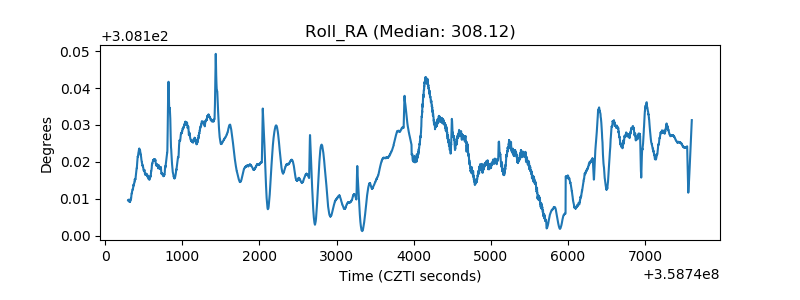 |
| Veto Counter | 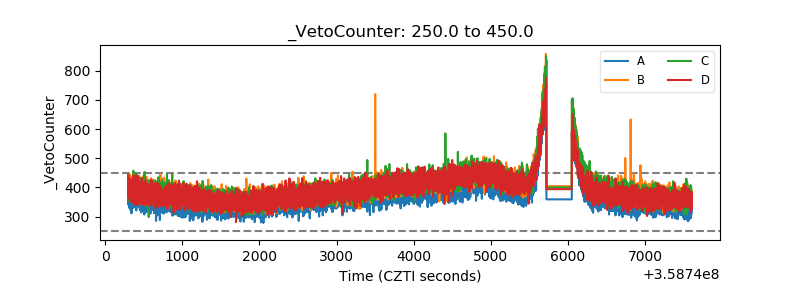 |