| Param | Original file | Final file |
|---|---|---|
| Filename | modeM0/AS1A10_121T02_9000004378_30435cztM0_level2.evt | modeM0/AS1A10_121T02_9000004378_30435cztM0_level2_quad_clean.evt |
| Size (bytes) | 1,618,404,480 | 239,388,480 |
| Size | 1.5 GB | 228.3 MB |
| Events in quadrant A | 8,853,706 | 1,531,815 |
| Events in quadrant B | 14,359,521 | 1,532,677 |
| Events in quadrant C | 9,445,113 | 1,498,237 |
| Events in quadrant D | 15,092,743 | 1,396,657 |
| Mode M0 | |||
|---|---|---|---|
| Quadrant | BADHDUFLAG | Total packets | Discarded packets |
| A | 0 | 38512 | 4 |
| B | 0 | 56767 | 4 |
| C | 0 | 39619 | 4 |
| D | 0 | 57868 | 4 |
| Mode SS | |||
|---|---|---|---|
| Quadrant | BADHDUFLAG | Total packets | Discarded packets |
| A | 0 | 380 | 0 |
| B | 0 | 380 | 0 |
| C | 0 | 380 | 0 |
| D | 0 | 380 | 0 |
| Mode M9 | |||
|---|---|---|---|
| Quadrant | BADHDUFLAG | Total packets | Discarded packets |
| A | 0 | 24 | 0 |
| B | 0 | 24 | 0 |
| C | 0 | 24 | 0 |
| D | 0 | 24 | 0 |
| Quadrant | Total seconds | Saturated seconds | Saturation percentage |
|---|---|---|---|
| A | 18733 | 193 | 1.030267% |
| B | 18734 | 378 | 2.017722% |
| C | 18734 | 374 | 1.996370% |
| D | 18734 | 2441 | 13.029785% |
Noise dominated data is calculated using 1-second bins in cleaned event files. If a bin has >2000 counts, and if more than 50% of those come from <1% of pixels, then it is considered to be noise-dominated and hence unusable.
| Quadrant | # 1 sec bins | Bins with >0 counts | Bins with >2000 counts | High rate bins dominated by noise | Noise dominated (total time) | Noise dominated (detector-on time) | Marked lightcurve |
|---|---|---|---|---|---|---|---|
| A | 20993 | 18733 | 0 | 0 | 0.00% | 0.00% | 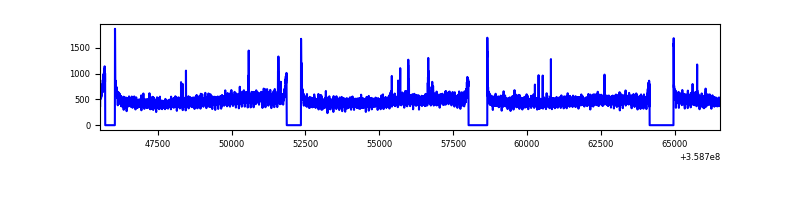 |
| B | 20994 | 18734 | 12 | 12 | 0.06% | 0.06% | 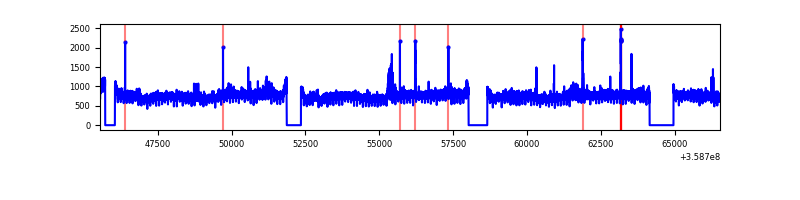 |
| C | 20994 | 18734 | 7 | 7 | 0.03% | 0.04% | 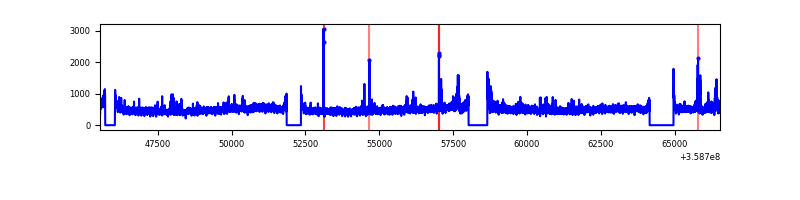 |
| D | 20994 | 18734 | 1695 | 1695 | 8.07% | 9.05% |  |
Top three noisy pixels from each quadrant. If the there are fewer than three noisy pixels in the level2.evt file, extra rows are filled as -1
| Pixel properties | Quadrant properties | ||||||
|---|---|---|---|---|---|---|---|
| Quadrant | DetID | PixID | Counts | Sigma | Mean | Median | Sigma |
| A | 4 | 2 | 39946 | 83.0 | 2263 | 2210 | 454.6 |
| A | 8 | 192 | 39161 | 81.28 | 2263 | 2210 | 454.6 |
| A | 13 | 254 | 33003 | 67.73 | 2263 | 2210 | 454.6 |
| B | 6 | 159 | 5261293 | 12209.63 | 2239 | 2183 | 430.7 |
| B | 0 | 229 | 130617 | 298.17 | 2239 | 2183 | 430.7 |
| B | 0 | 230 | 66017 | 148.2 | 2239 | 2183 | 430.7 |
| C | 3 | 233 | 408949 | 797.77 | 2168 | 2180 | 509.9 |
| C | 14 | 238 | 390609 | 761.8 | 2168 | 2180 | 509.9 |
| C | 10 | 22 | 65819 | 124.81 | 2168 | 2180 | 509.9 |
| D | 13 | 104 | 6354645 | 11892.89 | 2069 | 2026 | 534.2 |
| D | 8 | 195 | 450493 | 839.58 | 2069 | 2026 | 534.2 |
| D | 12 | 227 | 175156 | 324.12 | 2069 | 2026 | 534.2 |
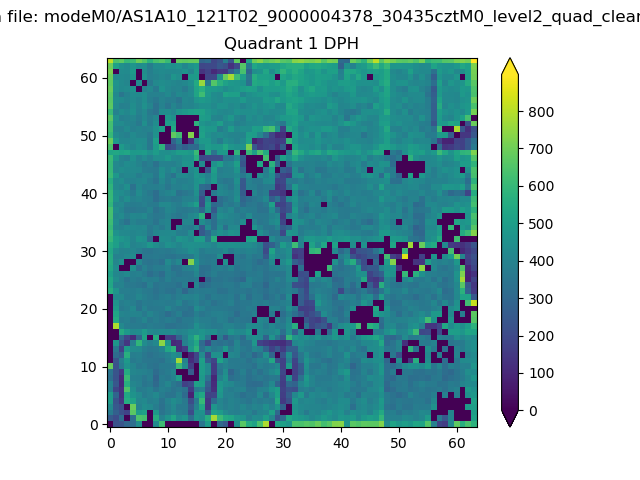
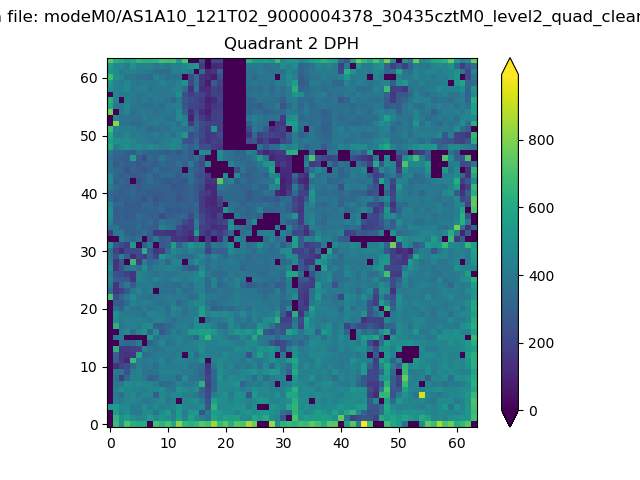
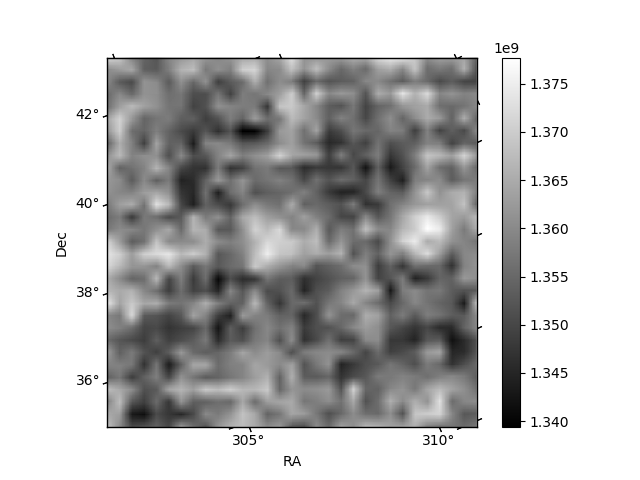
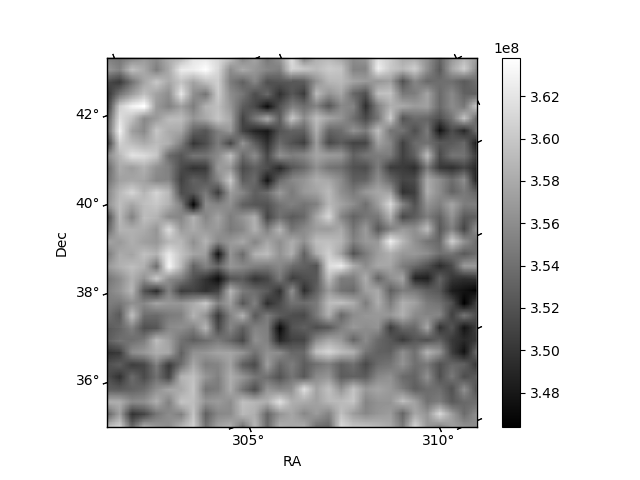
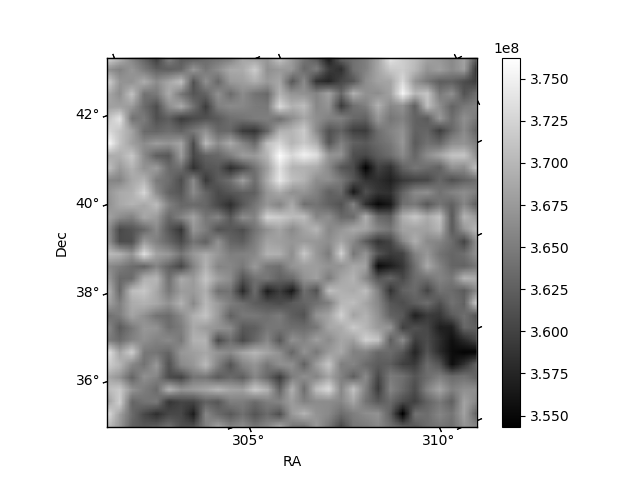
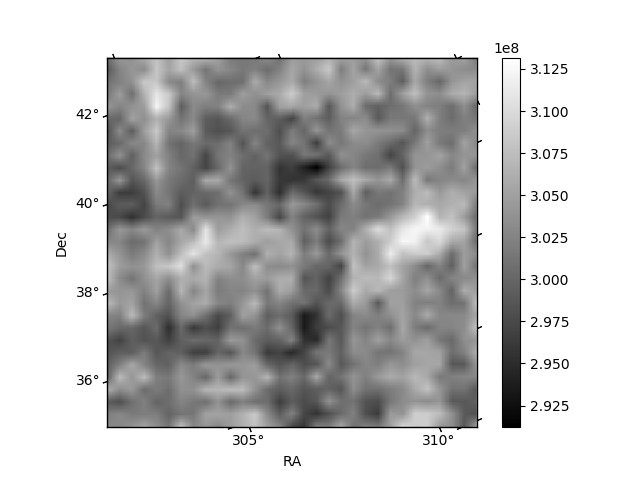
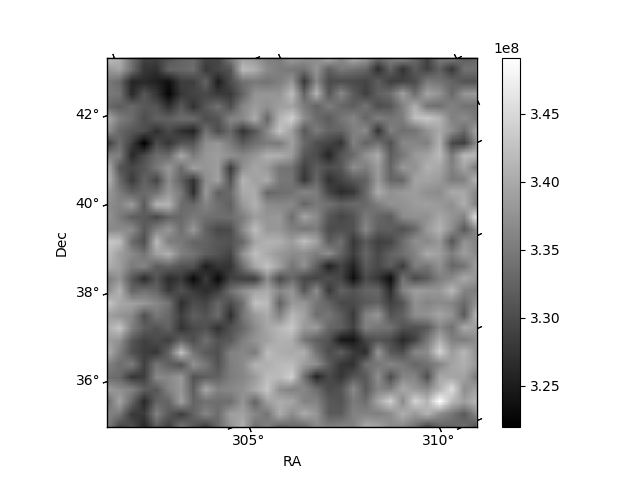
Histogram calculated using DETX and DETY for each event in the final _common_clean file
| Quadrant A | 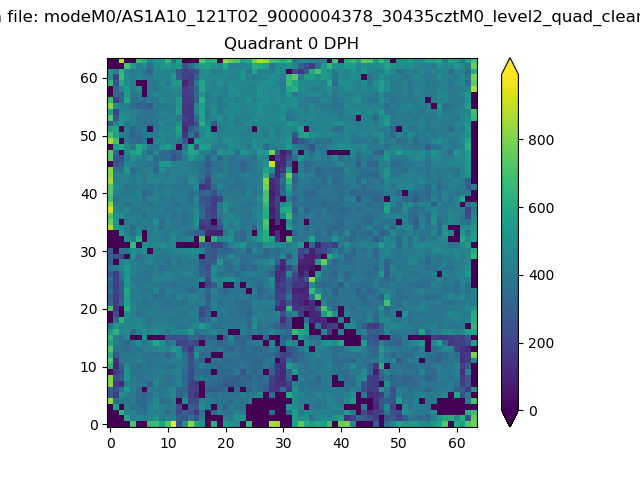 |
 |
Quadrant B |
|---|---|---|---|
| Quadrant D | 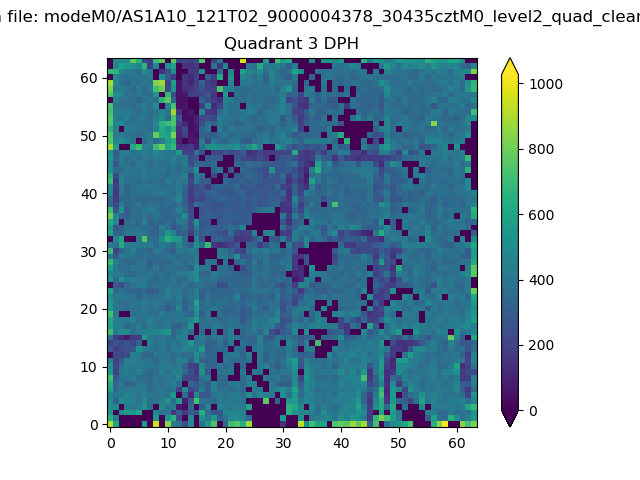 |
 |
Quadrant C |
| Plot type | Count rate plots | Images |
|---|---|---|
| Comparison with Poisson distribution Blue bars denote a histogram of data divided into 1 sec bins. Red curve is a Poisson curve with rate = median count rate of data. |
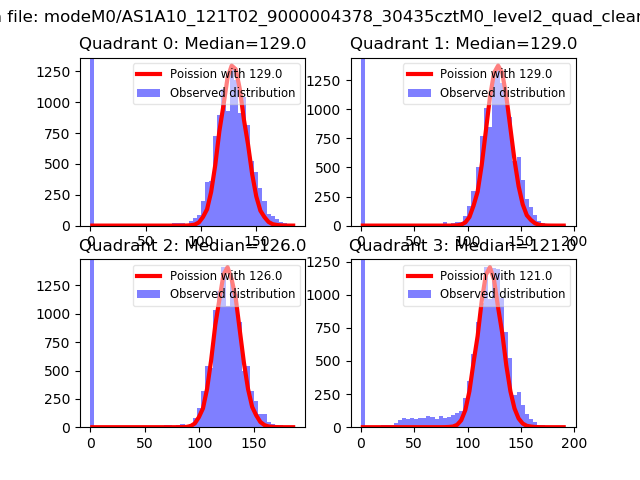 |
 |
| Quadrant-wise count rates Data is divided into 100 sec bins |
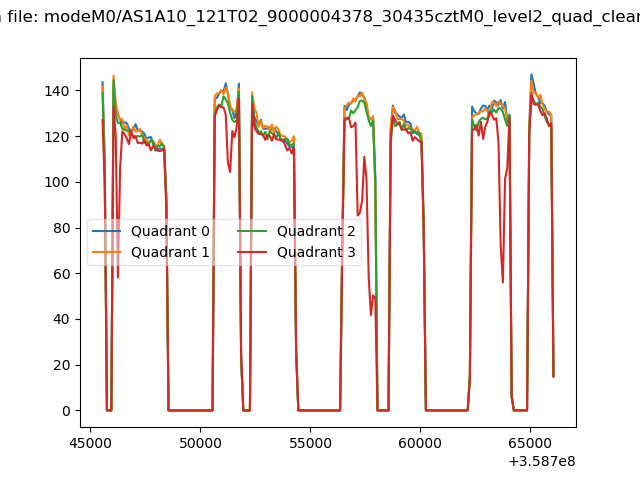 |
|
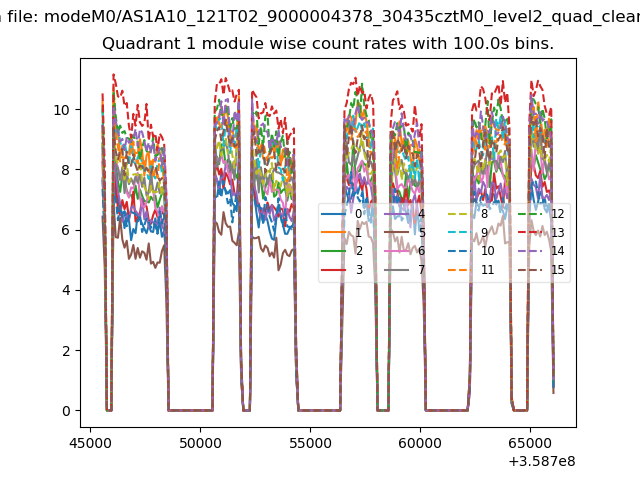
| Module-wise count rates for Quadrant A Data is divided into 100 sec bins |
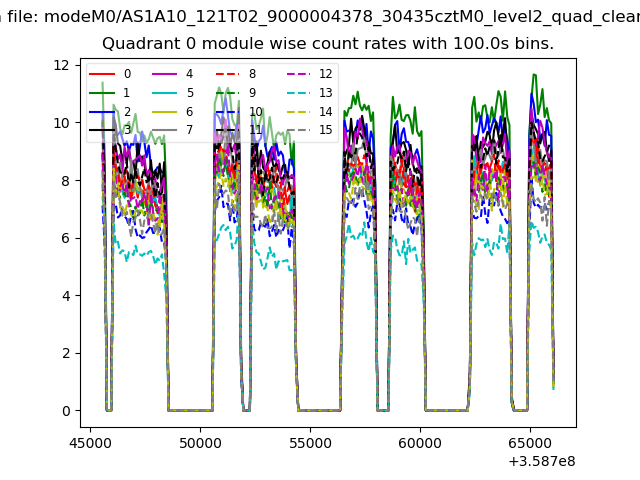 |
 |
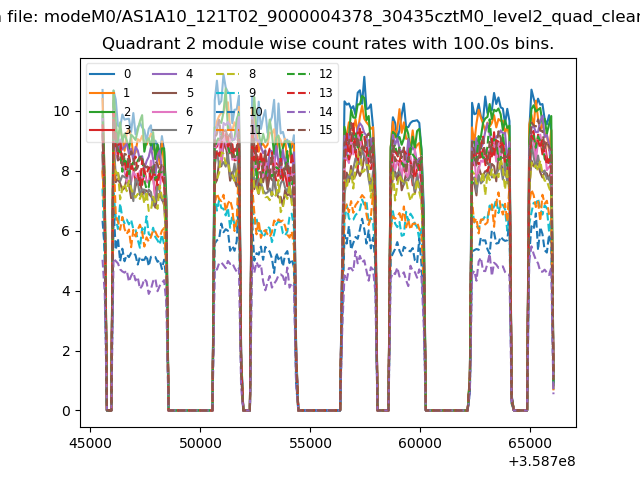
| Module-wise count rates for Quadrant B Data is divided into 100 sec bins |
 |
 |
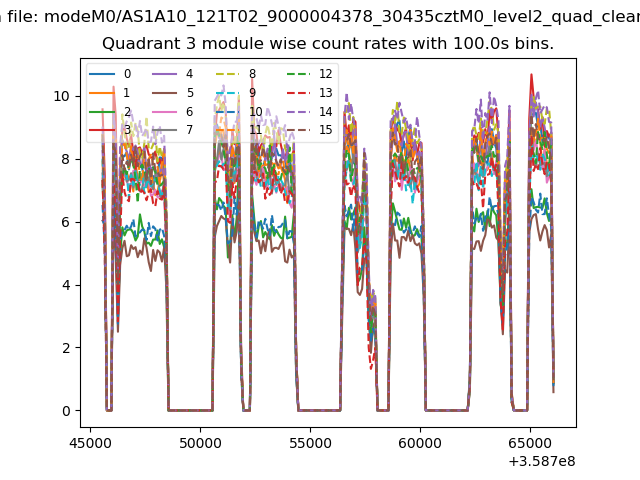
| Module-wise count rates for Quadrant C Data is divided into 100 sec bins |
 |
 |
| Module-wise count rates for Quadrant D Data is divided into 100 sec bins |
 |
 |
| Parameter | Plot |
|---|---|
| CZT HV Monitor |  |
| D_VDD | 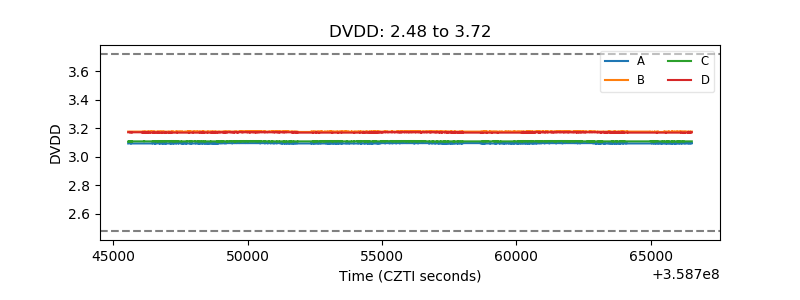 |
| Temperature 1 | 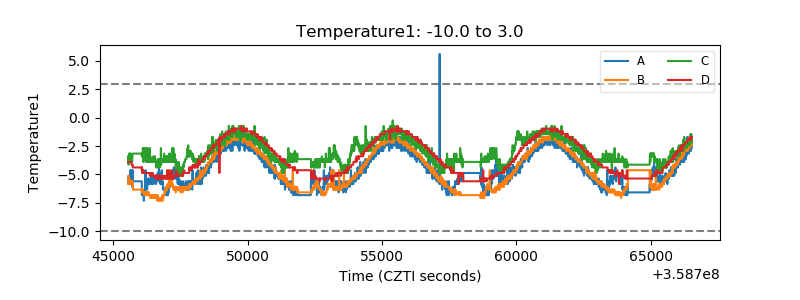 |
| Veto HV Monitor | 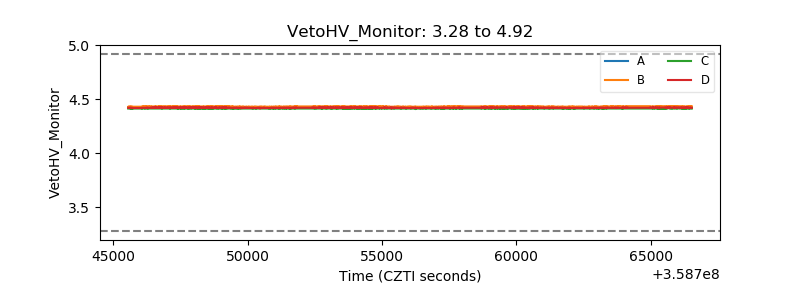 |
| Veto LLD | 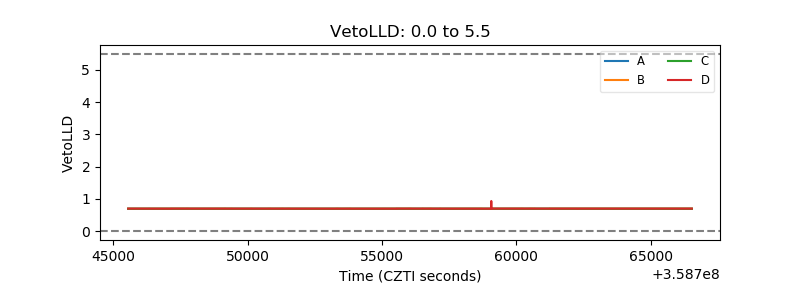 |
| Alpha Counter | 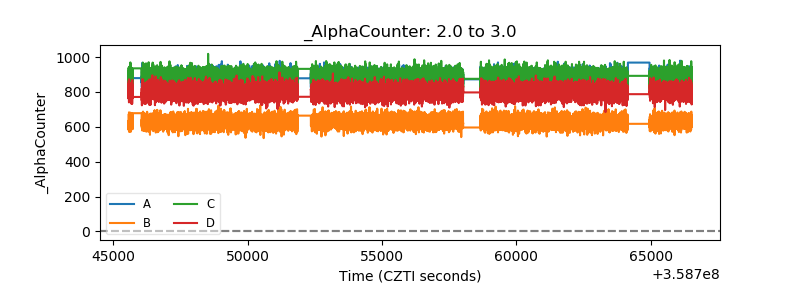 |
| _CPM_Rate | 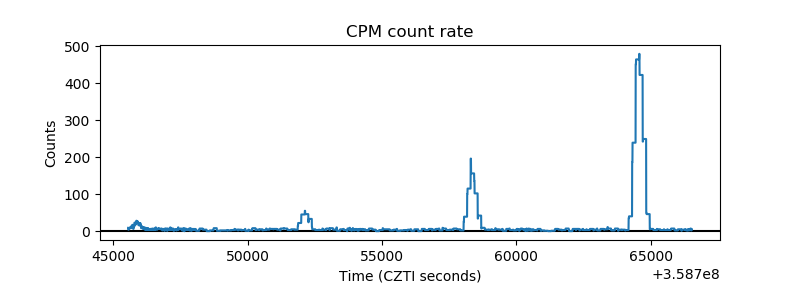 |
| CZT Counter | 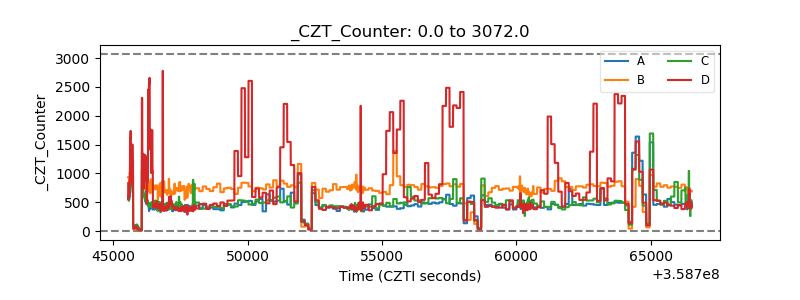 |
| +2.5 Volts monitor |  |
| +5 Volts monitor |  |
| _ROLL_ROT | 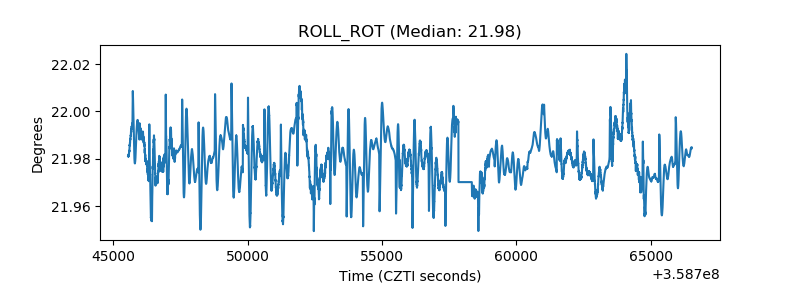 |
| _Roll_DEC | 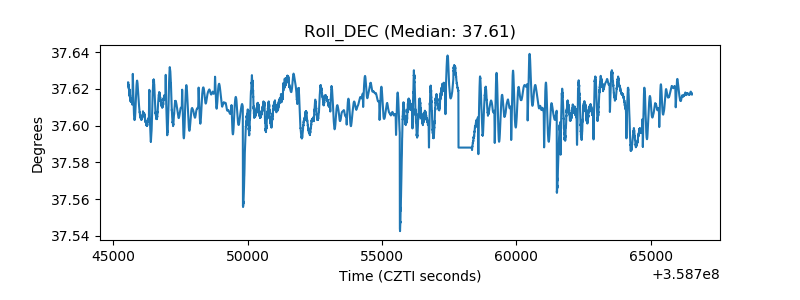 |
| _Roll_RA | 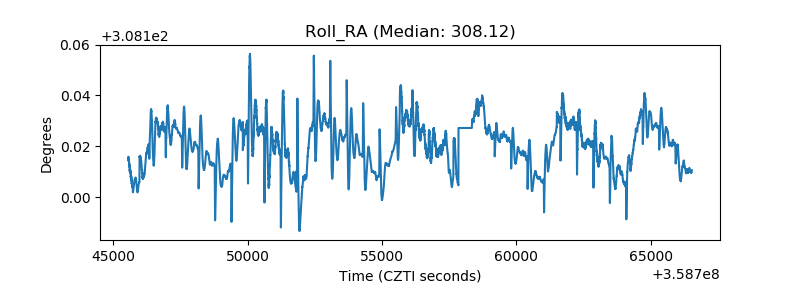 |
| Veto Counter | 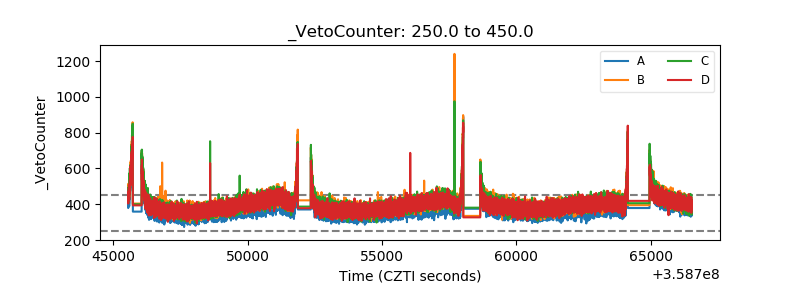 |