| Param | Original file | Final file |
|---|---|---|
| Filename | modeM0/AS1A10_121T02_9000004378_30436cztM0_level2.evt | modeM0/AS1A10_121T02_9000004378_30436cztM0_level2_quad_clean.evt |
| Size (bytes) | 595,791,360 | 75,686,400 |
| Size | 568.2 MB | 72.2 MB |
| Events in quadrant A | 3,113,767 | 475,767 |
| Events in quadrant B | 4,908,887 | 474,812 |
| Events in quadrant C | 3,554,359 | 459,848 |
| Events in quadrant D | 6,033,918 | 435,121 |
| Mode M0 | |||
|---|---|---|---|
| Quadrant | BADHDUFLAG | Total packets | Discarded packets |
| A | 0 | 13170 | 1 |
| B | 0 | 19267 | 1 |
| C | 0 | 14315 | 2 |
| D | 0 | 22086 | 1 |
| Mode SS | |||
|---|---|---|---|
| Quadrant | BADHDUFLAG | Total packets | Discarded packets |
| A | 0 | 128 | 0 |
| B | 0 | 128 | 0 |
| C | 0 | 128 | 0 |
| D | 0 | 128 | 0 |
| Mode M9 | |||
|---|---|---|---|
| Quadrant | BADHDUFLAG | Total packets | Discarded packets |
| A | 0 | 10 | 0 |
| B | 0 | 10 | 0 |
| C | 0 | 10 | 0 |
| D | 0 | 10 | 0 |
| Quadrant | Total seconds | Saturated seconds | Saturation percentage |
|---|---|---|---|
| A | 6399 | 56 | 0.875137% |
| B | 6400 | 88 | 1.375000% |
| C | 6399 | 138 | 2.156587% |
| D | 6399 | 891 | 13.924051% |
Noise dominated data is calculated using 1-second bins in cleaned event files. If a bin has >2000 counts, and if more than 50% of those come from <1% of pixels, then it is considered to be noise-dominated and hence unusable.
| Quadrant | # 1 sec bins | Bins with >0 counts | Bins with >2000 counts | High rate bins dominated by noise | Noise dominated (total time) | Noise dominated (detector-on time) | Marked lightcurve |
|---|---|---|---|---|---|---|---|
| A | 7359 | 6399 | 0 | 0 | 0.00% | 0.00% | 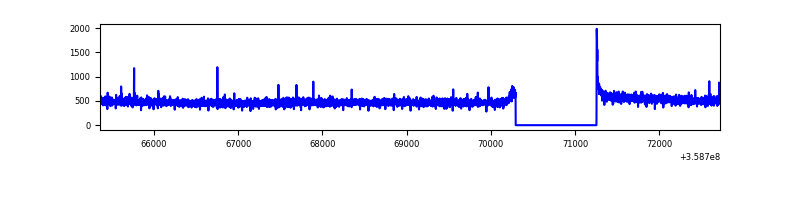 |
| B | 7360 | 6400 | 0 | 0 | 0.00% | 0.00% | 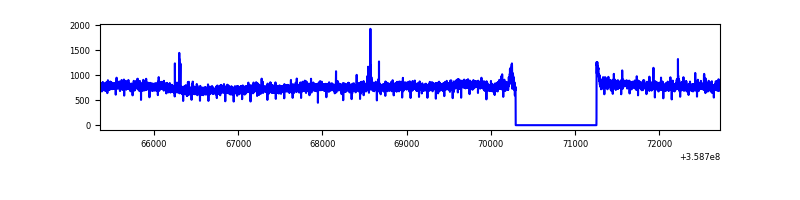 |
| C | 7359 | 6399 | 6 | 6 | 0.08% | 0.09% | 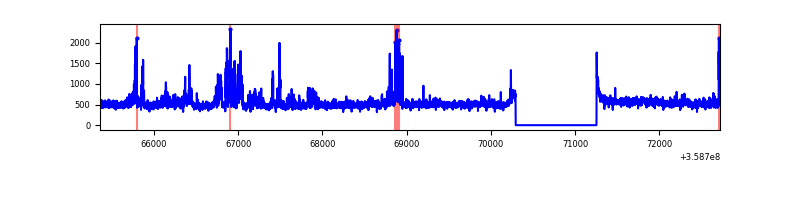 |
| D | 7359 | 6399 | 856 | 856 | 11.63% | 13.38% | 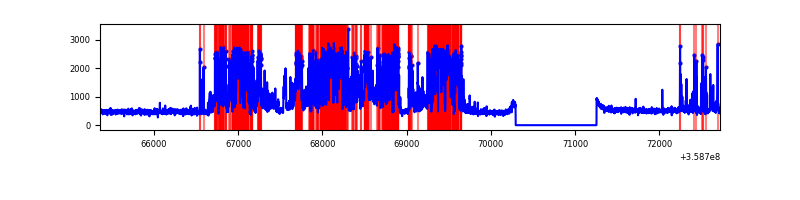 |
Top three noisy pixels from each quadrant. If the there are fewer than three noisy pixels in the level2.evt file, extra rows are filled as -1
| Pixel properties | Quadrant properties | ||||||
|---|---|---|---|---|---|---|---|
| Quadrant | DetID | PixID | Counts | Sigma | Mean | Median | Sigma |
| A | 13 | 254 | 10791 | 62.48 | 800 | 785 | 160.1 |
| A | 8 | 192 | 10434 | 60.25 | 800 | 785 | 160.1 |
| A | 4 | 2 | 9493 | 54.38 | 800 | 785 | 160.1 |
| B | 6 | 159 | 1748344 | 11561.92 | 787 | 767 | 151.1 |
| B | 0 | 229 | 60054 | 392.24 | 787 | 767 | 151.1 |
| B | 12 | 111 | 18715 | 118.74 | 787 | 767 | 151.1 |
| C | 3 | 233 | 321133 | 1809.25 | 756 | 762 | 177.1 |
| C | 14 | 238 | 139665 | 784.44 | 756 | 762 | 177.1 |
| C | 10 | 22 | 91273 | 511.15 | 756 | 762 | 177.1 |
| D | 13 | 104 | 1827925 | 9701.34 | 736 | 719 | 188.3 |
| D | 2 | 250 | 1159109 | 6150.34 | 736 | 719 | 188.3 |
| D | 8 | 195 | 101261 | 533.82 | 736 | 719 | 188.3 |
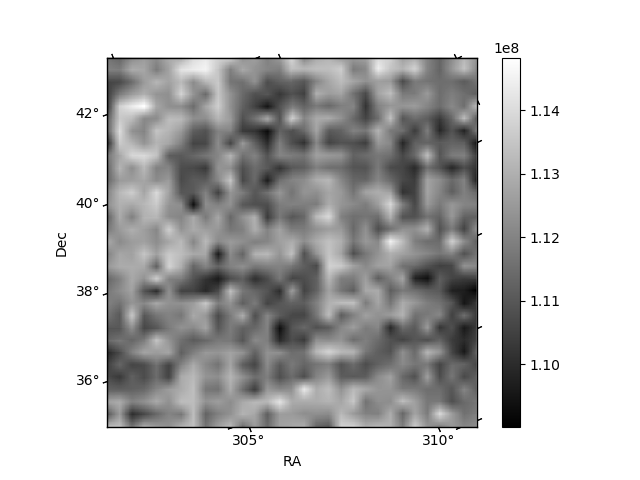
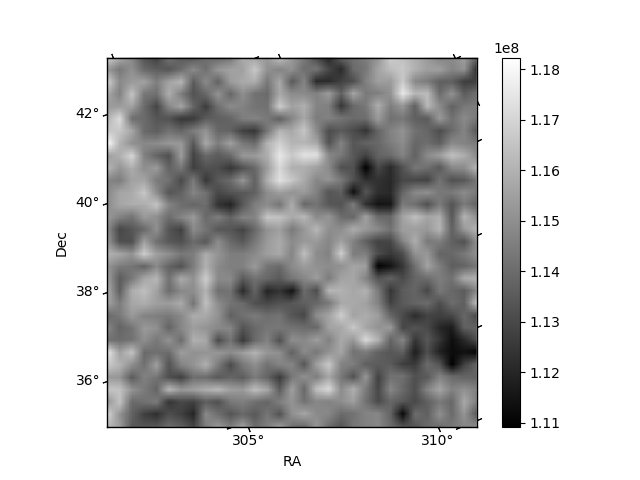
Histogram calculated using DETX and DETY for each event in the final _common_clean file
| Quadrant A | 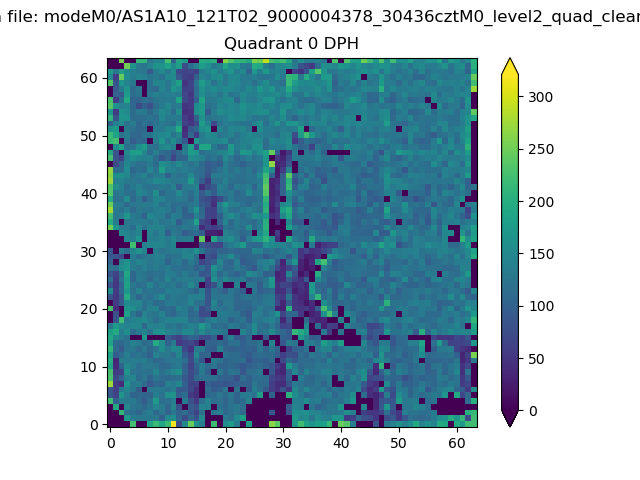 |
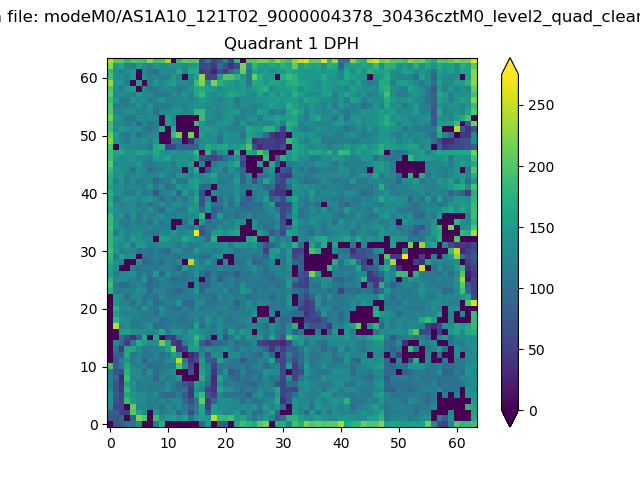 |
Quadrant B |
|---|---|---|---|
| Quadrant D | 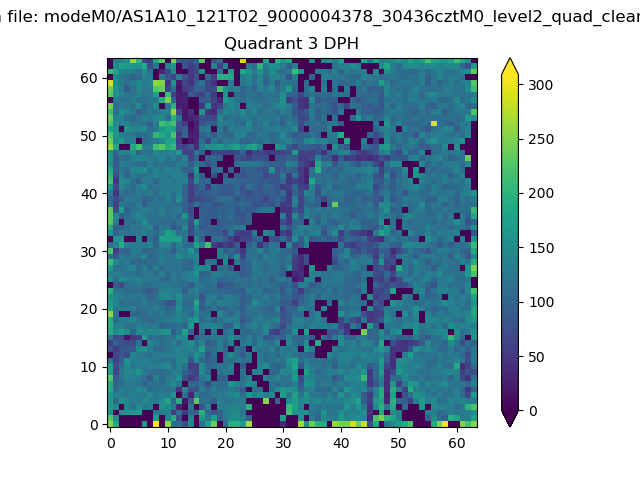 |
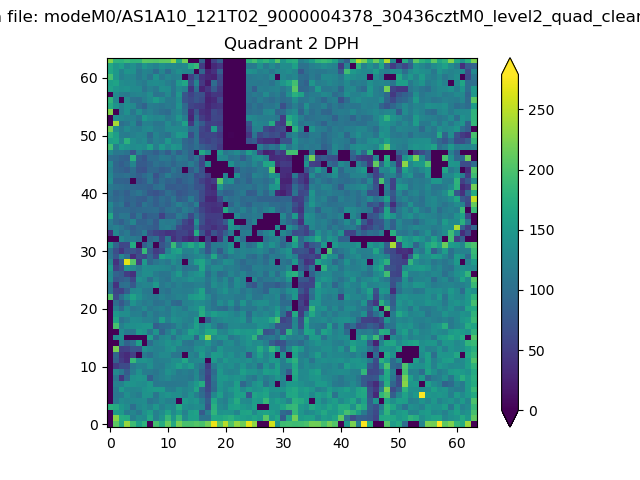 |
Quadrant C |
| Plot type | Count rate plots | Images |
|---|---|---|
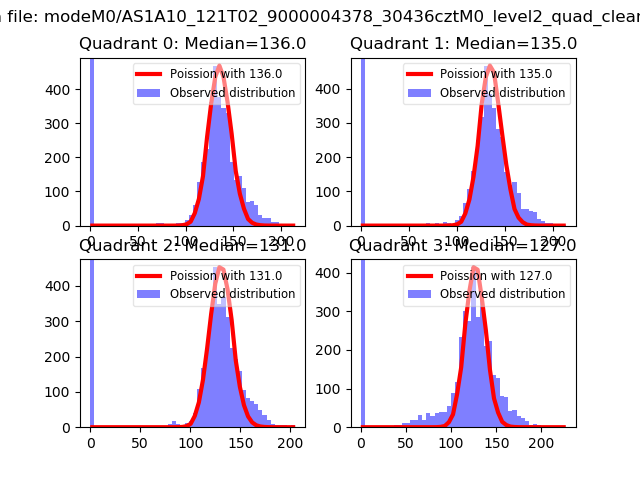
| Comparison with Poisson distribution Blue bars denote a histogram of data divided into 1 sec bins. Red curve is a Poisson curve with rate = median count rate of data. |
 |
 |
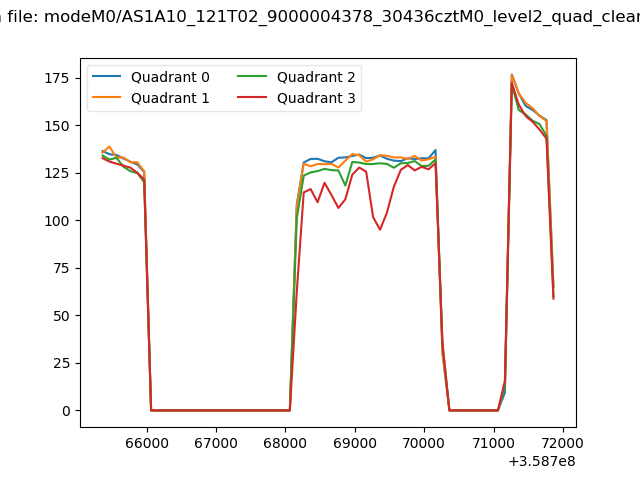
| Quadrant-wise count rates Data is divided into 100 sec bins |
 |
|
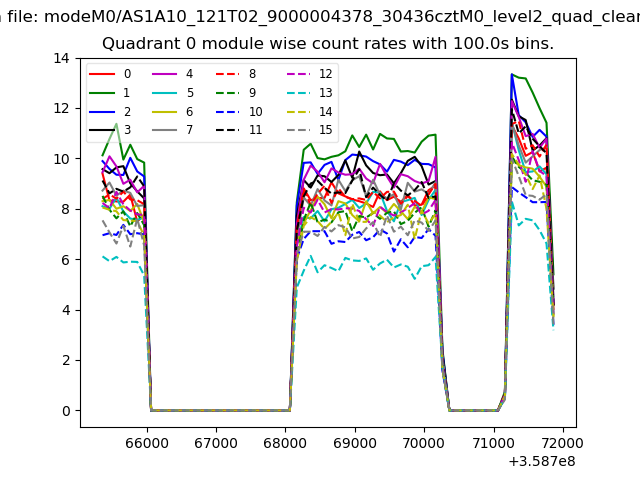
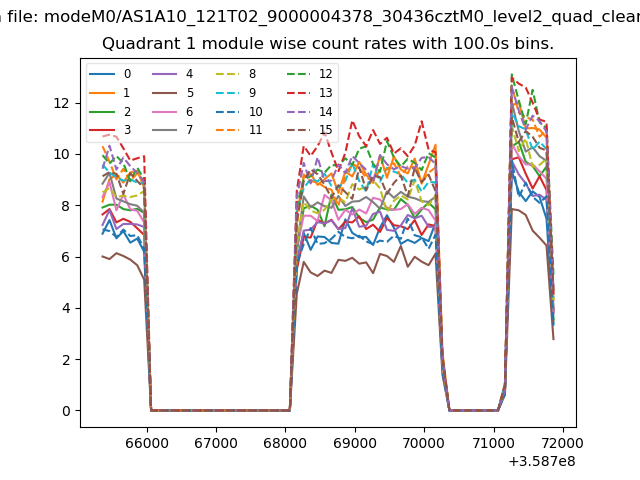
| Module-wise count rates for Quadrant A Data is divided into 100 sec bins |
 |
 |
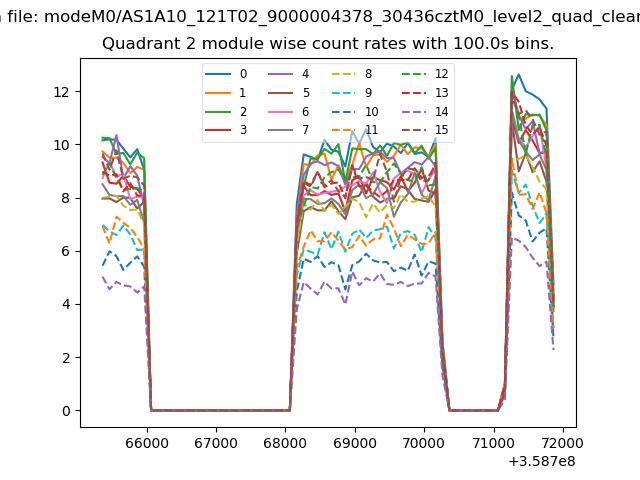
| Module-wise count rates for Quadrant B Data is divided into 100 sec bins |
 |
 |
| Module-wise count rates for Quadrant C Data is divided into 100 sec bins |
 |
 |
| Module-wise count rates for Quadrant D Data is divided into 100 sec bins |
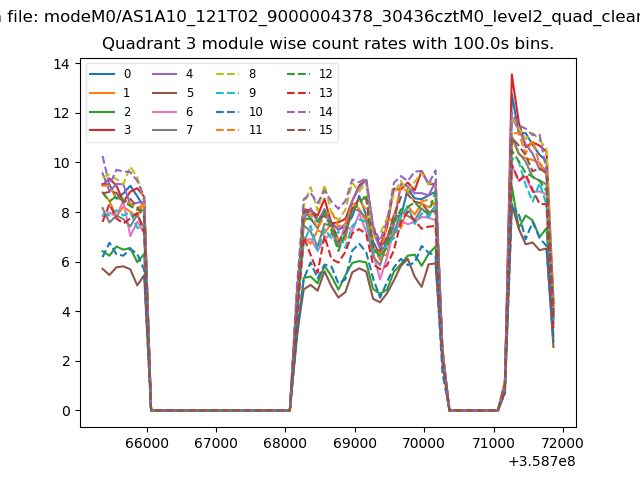 |
 |
| Parameter | Plot |
|---|---|
| CZT HV Monitor | 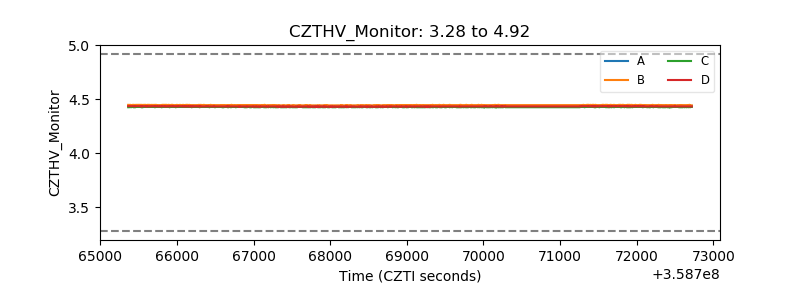 |
| D_VDD | 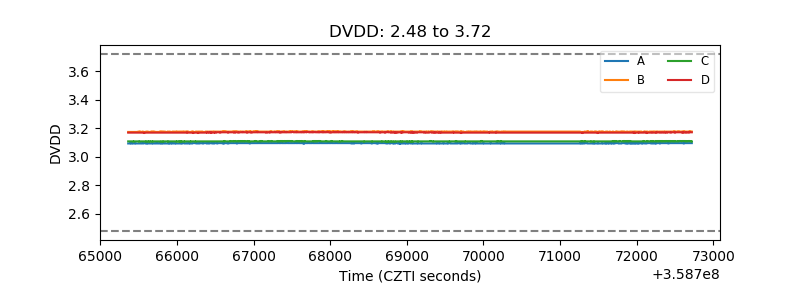 |
| Temperature 1 | 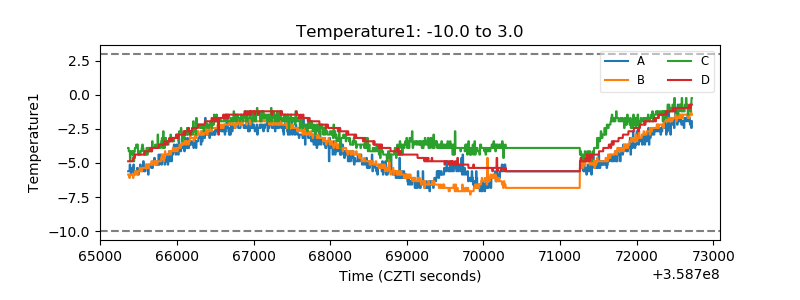 |
| Veto HV Monitor | 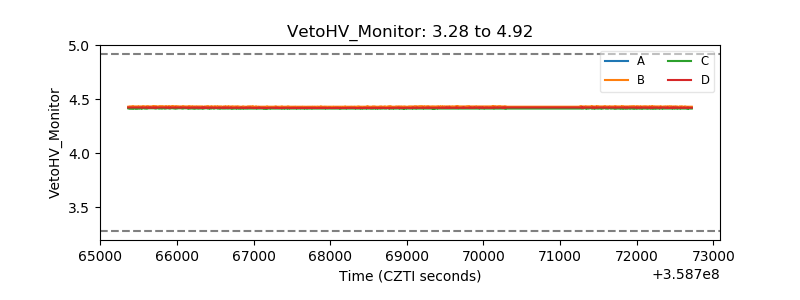 |
| Veto LLD |  |
| Alpha Counter | 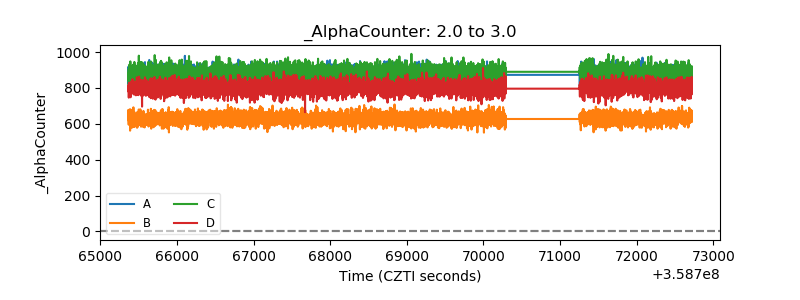 |
| _CPM_Rate | 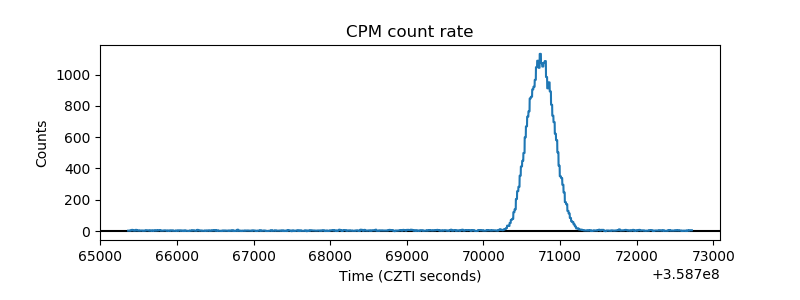 |
| CZT Counter | 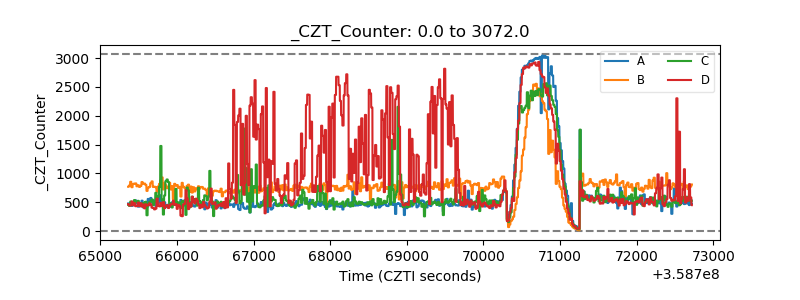 |
| +2.5 Volts monitor |  |
| +5 Volts monitor | 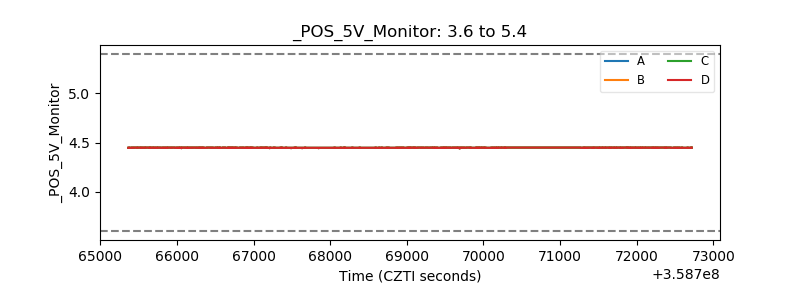 |
| _ROLL_ROT | 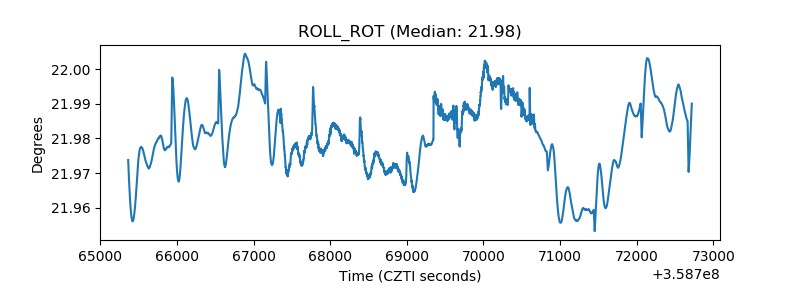 |
| _Roll_DEC | 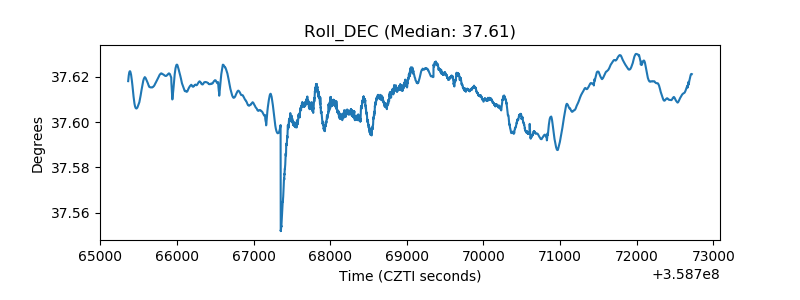 |
| _Roll_RA | 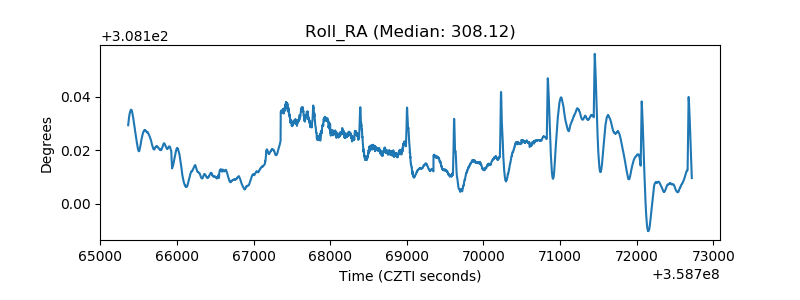 |
| Veto Counter | 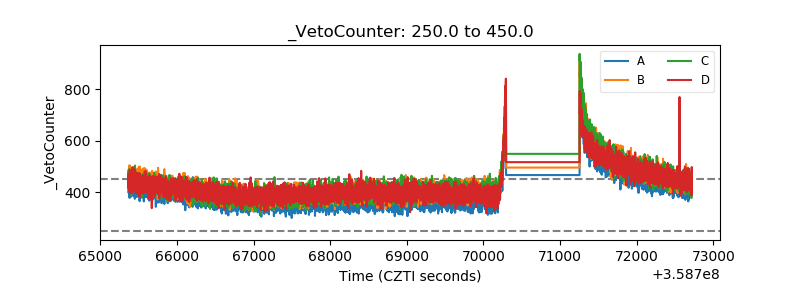 |