| Param | Original file | Final file |
|---|---|---|
| Filename | modeM0/AS1A10_121T02_9000004378_30438cztM0_level2.evt | modeM0/AS1A10_121T02_9000004378_30438cztM0_level2_quad_clean.evt |
| Size (bytes) | 601,496,640 | 76,037,760 |
| Size | 573.6 MB | 72.5 MB |
| Events in quadrant A | 3,556,860 | 473,030 |
| Events in quadrant B | 5,237,966 | 470,803 |
| Events in quadrant C | 3,894,303 | 456,249 |
| Events in quadrant D | 5,084,360 | 445,542 |
| Mode M0 | |||
|---|---|---|---|
| Quadrant | BADHDUFLAG | Total packets | Discarded packets |
| A | 0 | 14585 | 2 |
| B | 0 | 19983 | 3 |
| C | 0 | 15577 | 2 |
| D | 0 | 19449 | 2 |
| Mode SS | |||
|---|---|---|---|
| Quadrant | BADHDUFLAG | Total packets | Discarded packets |
| A | 0 | 132 | 0 |
| B | 0 | 132 | 0 |
| C | 0 | 132 | 0 |
| D | 0 | 132 | 0 |
| Mode M9 | |||
|---|---|---|---|
| Quadrant | BADHDUFLAG | Total packets | Discarded packets |
| A | 0 | 14 | 0 |
| B | 0 | 15 | 0 |
| C | 0 | 15 | 0 |
| D | 0 | 15 | 0 |
| Quadrant | Total seconds | Saturated seconds | Saturation percentage |
|---|---|---|---|
| A | 6552 | 87 | 1.327839% |
| B | 6551 | 121 | 1.847046% |
| C | 6551 | 141 | 2.152343% |
| D | 6551 | 402 | 6.136468% |
Noise dominated data is calculated using 1-second bins in cleaned event files. If a bin has >2000 counts, and if more than 50% of those come from <1% of pixels, then it is considered to be noise-dominated and hence unusable.
| Quadrant | # 1 sec bins | Bins with >0 counts | Bins with >2000 counts | High rate bins dominated by noise | Noise dominated (total time) | Noise dominated (detector-on time) | Marked lightcurve |
|---|---|---|---|---|---|---|---|
| A | 7637 | 6552 | 14 | 14 | 0.18% | 0.21% | 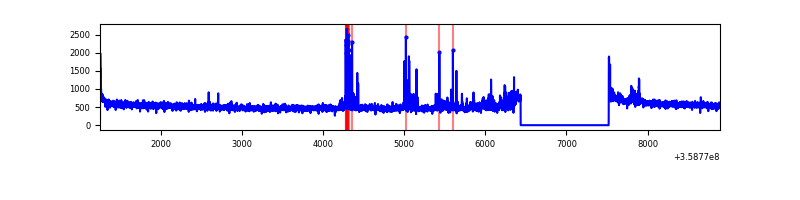 |
| B | 7636 | 6551 | 1 | 1 | 0.01% | 0.02% | 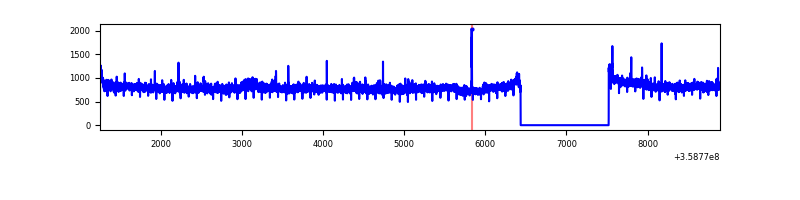 |
| C | 7636 | 6551 | 25 | 25 | 0.33% | 0.38% | 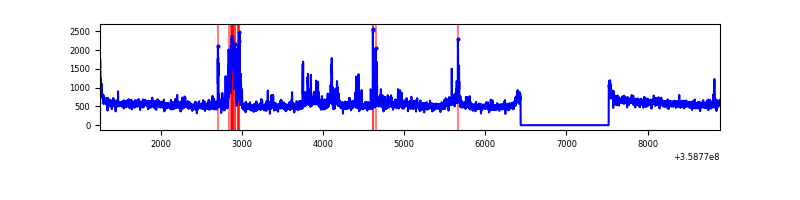 |
| D | 7636 | 6551 | 349 | 349 | 4.57% | 5.33% | 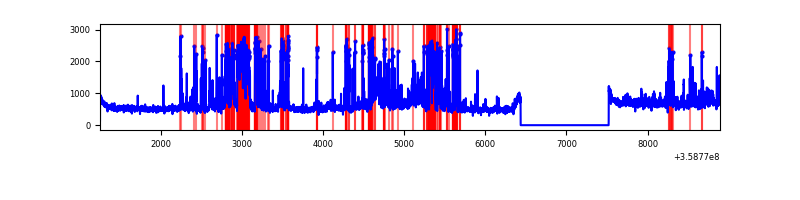 |
Top three noisy pixels from each quadrant. If the there are fewer than three noisy pixels in the level2.evt file, extra rows are filled as -1
| Pixel properties | Quadrant properties | ||||||
|---|---|---|---|---|---|---|---|
| Quadrant | DetID | PixID | Counts | Sigma | Mean | Median | Sigma |
| A | 0 | 13 | 179635 | 1031.72 | 870 | 855 | 173.3 |
| A | 8 | 192 | 18930 | 104.31 | 870 | 855 | 173.3 |
| A | 13 | 254 | 11346 | 60.54 | 870 | 855 | 173.3 |
| B | 6 | 159 | 1813688 | 11170.81 | 852 | 830 | 162.3 |
| B | 0 | 229 | 37027 | 223.05 | 852 | 830 | 162.3 |
| B | 0 | 230 | 21201 | 125.53 | 852 | 830 | 162.3 |
| C | 3 | 233 | 481366 | 2522.98 | 823 | 830 | 190.5 |
| C | 14 | 238 | 133490 | 696.51 | 823 | 830 | 190.5 |
| C | 10 | 22 | 36658 | 188.11 | 823 | 830 | 190.5 |
| D | 13 | 104 | 1242768 | 5860.1 | 816 | 801 | 211.9 |
| D | 8 | 195 | 392935 | 1850.25 | 816 | 801 | 211.9 |
| D | 12 | 227 | 114973 | 538.71 | 816 | 801 | 211.9 |
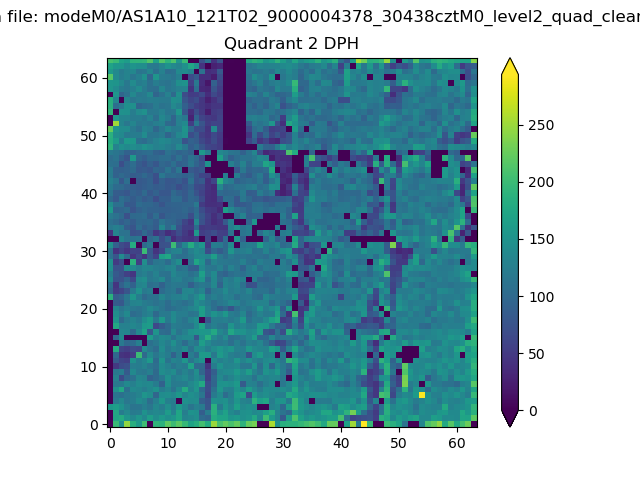
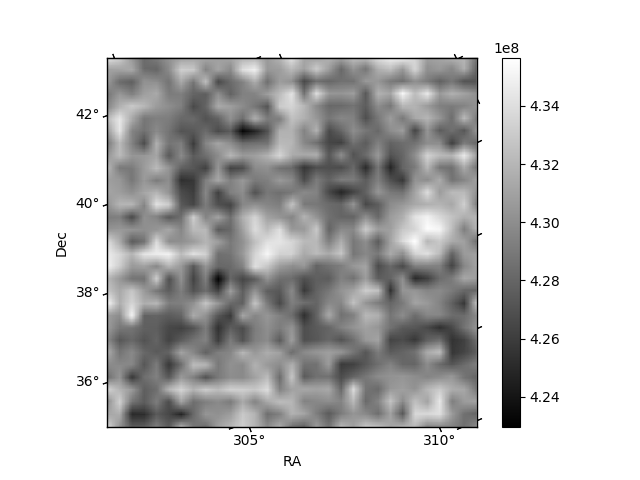
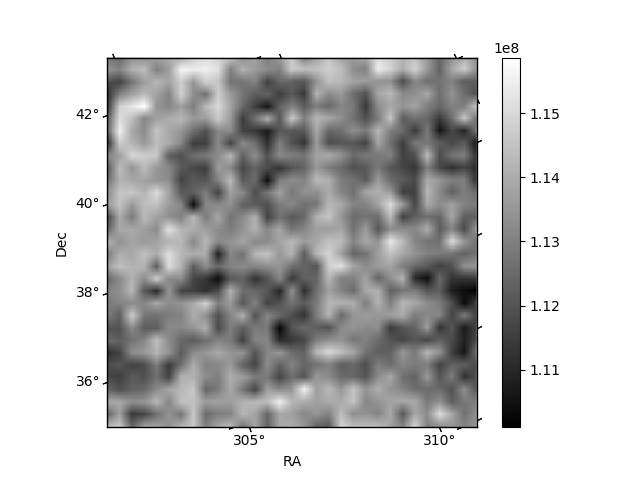
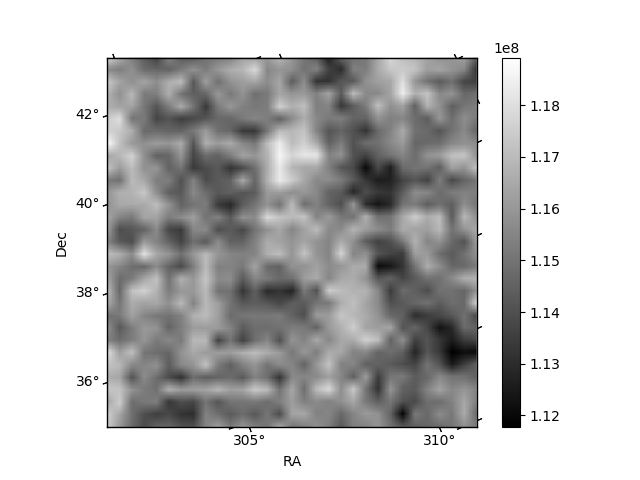
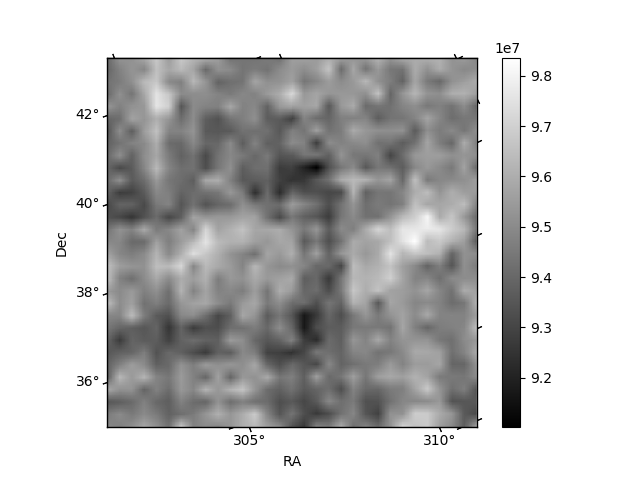
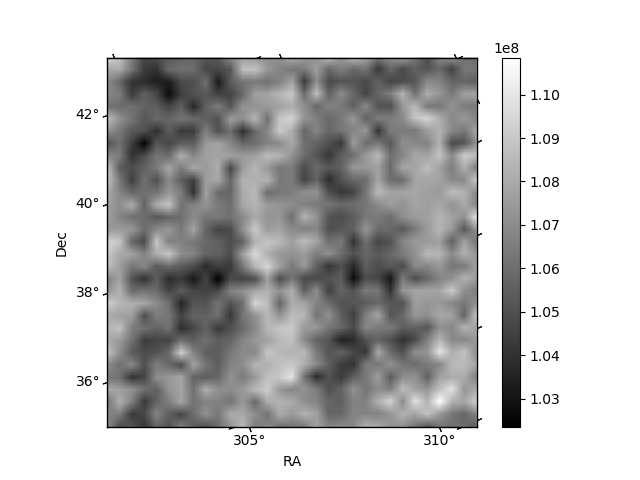
Histogram calculated using DETX and DETY for each event in the final _common_clean file
| Quadrant A | 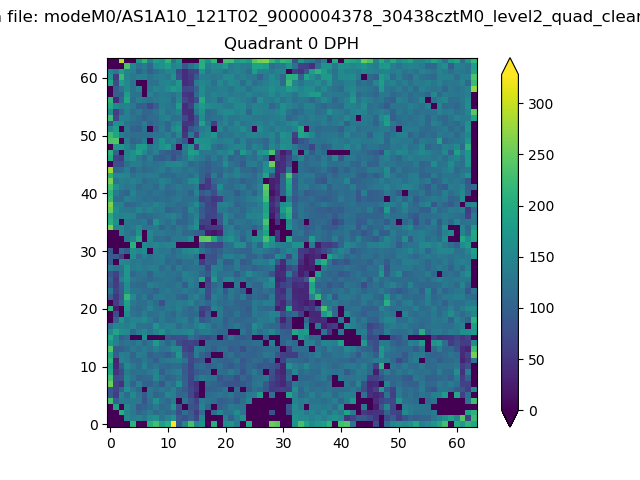 |
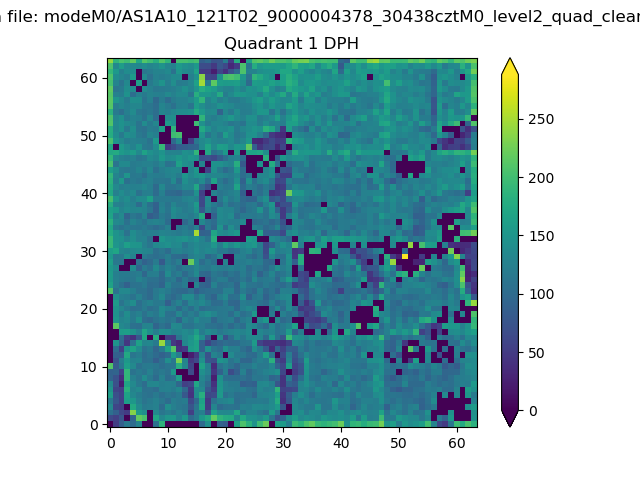 |
Quadrant B |
|---|---|---|---|
| Quadrant D | 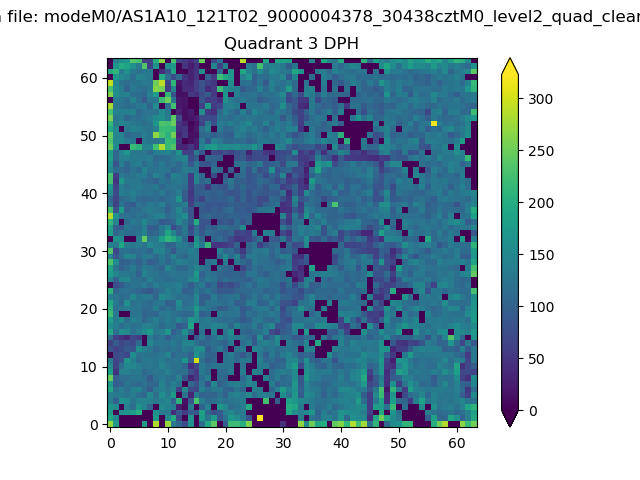 |
 |
Quadrant C |
| Plot type | Count rate plots | Images |
|---|---|---|
| Comparison with Poisson distribution Blue bars denote a histogram of data divided into 1 sec bins. Red curve is a Poisson curve with rate = median count rate of data. |
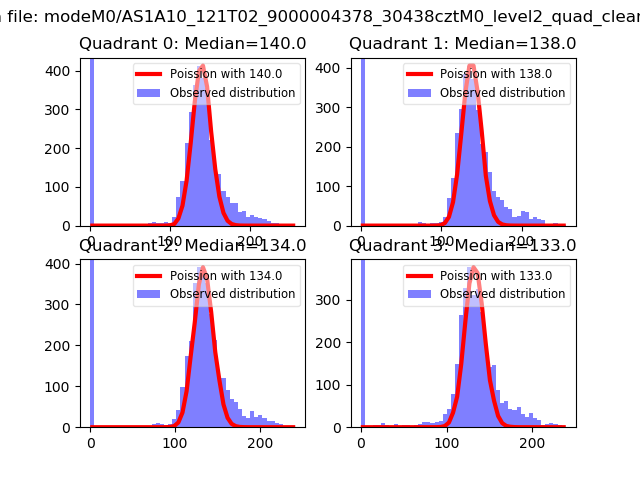 |
 |
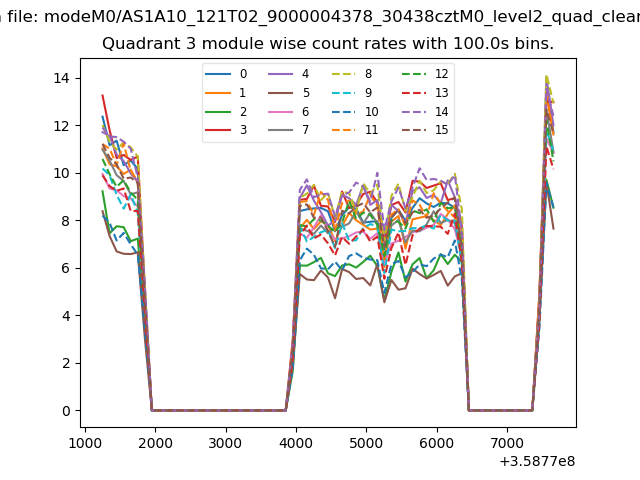
| Quadrant-wise count rates Data is divided into 100 sec bins |
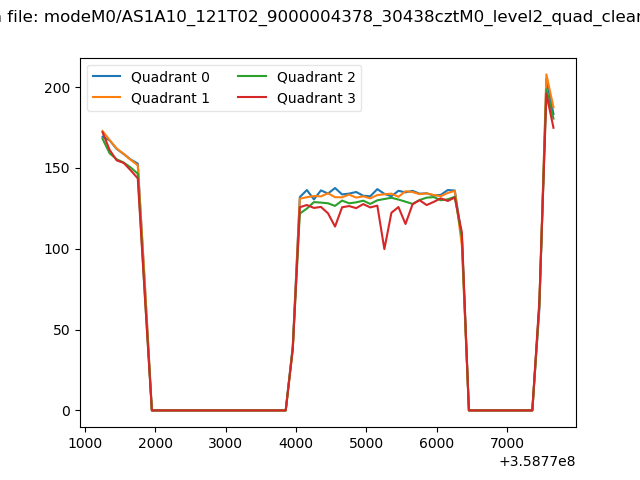 |
|
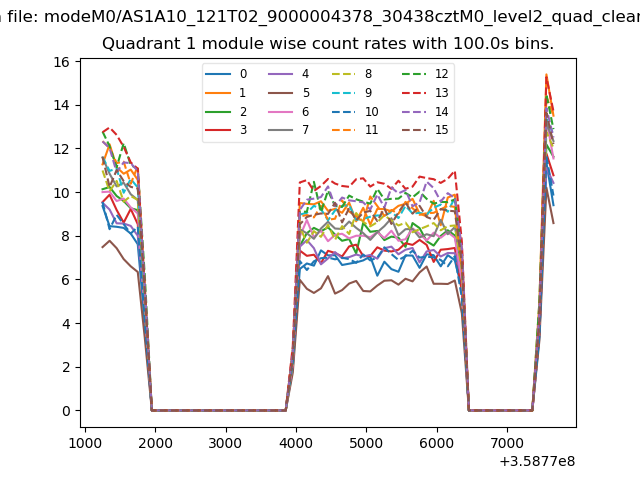
| Module-wise count rates for Quadrant A Data is divided into 100 sec bins |
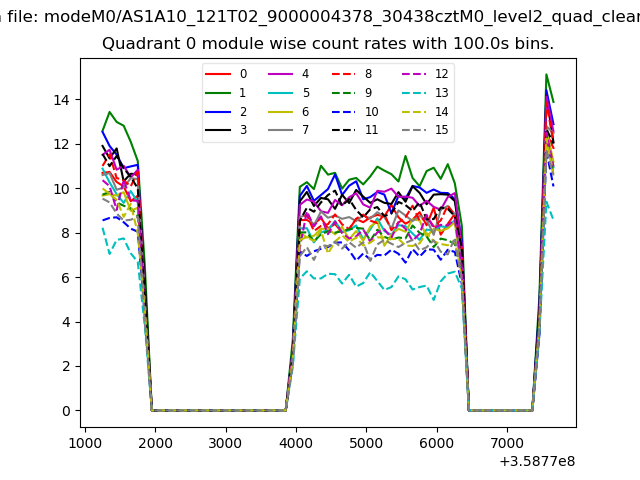 |
 |
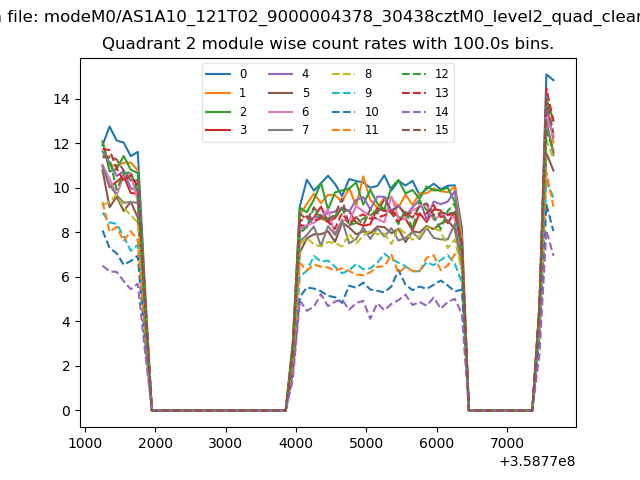
| Module-wise count rates for Quadrant B Data is divided into 100 sec bins |
 |
 |
| Module-wise count rates for Quadrant C Data is divided into 100 sec bins |
 |
 |
| Module-wise count rates for Quadrant D Data is divided into 100 sec bins |
 |
 |
| Parameter | Plot |
|---|---|
| CZT HV Monitor | 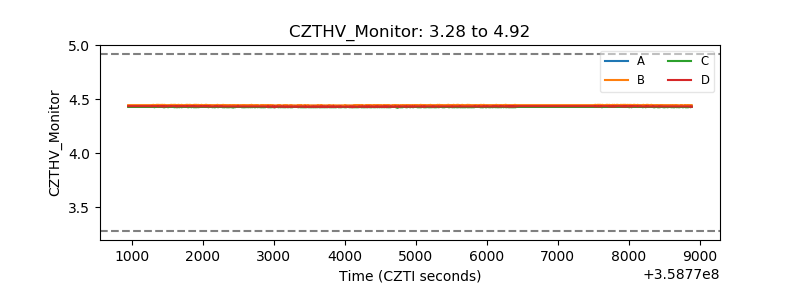 |
| D_VDD | 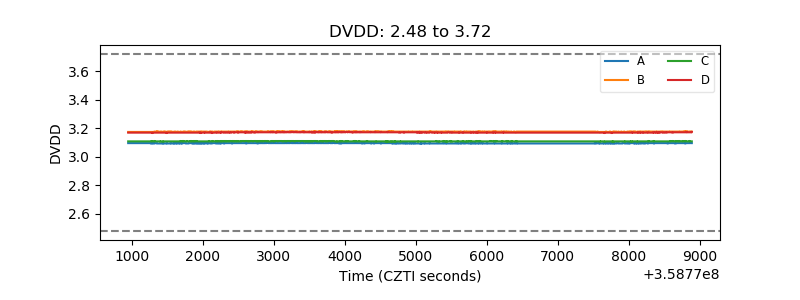 |
| Temperature 1 | 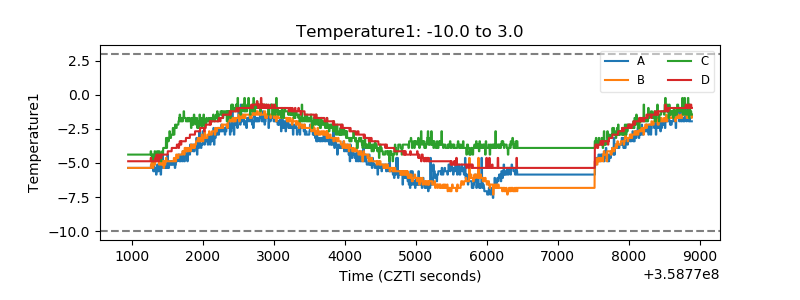 |
| Veto HV Monitor | 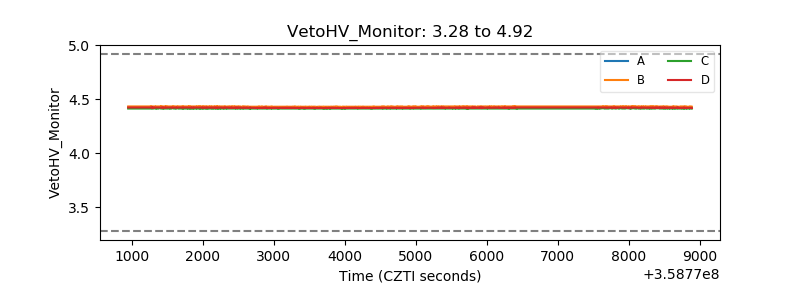 |
| Veto LLD | 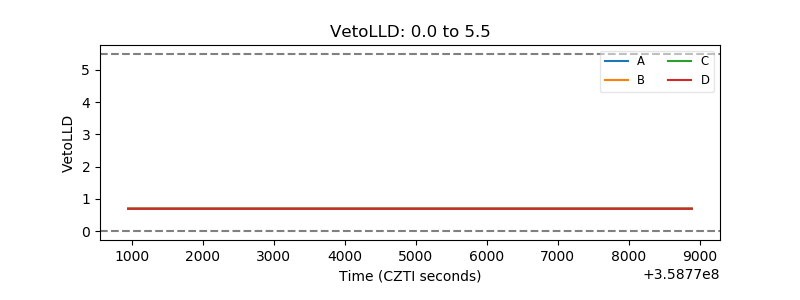 |
| Alpha Counter | 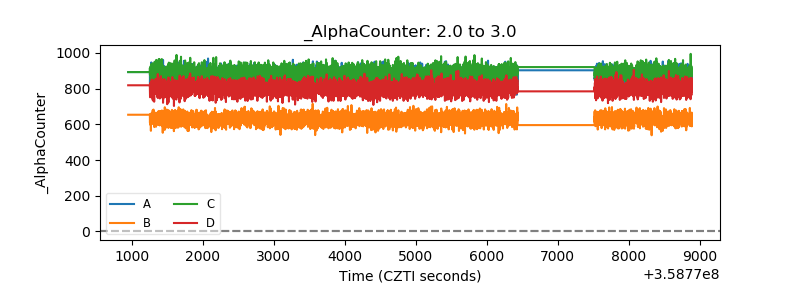 |
| _CPM_Rate | 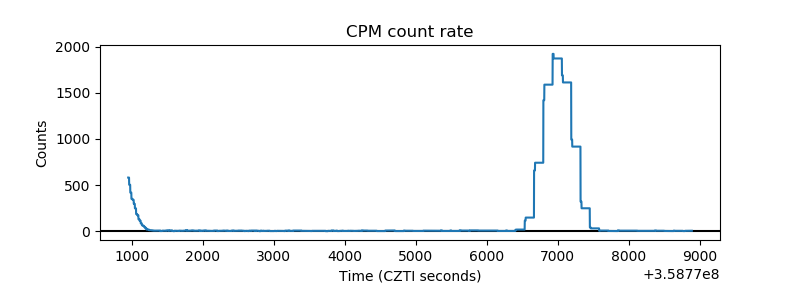 |
| CZT Counter | 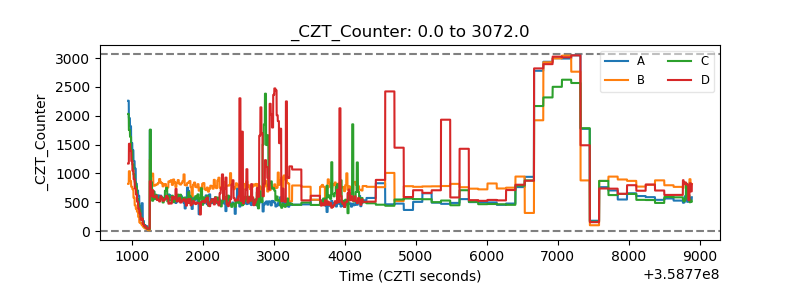 |
| +2.5 Volts monitor | 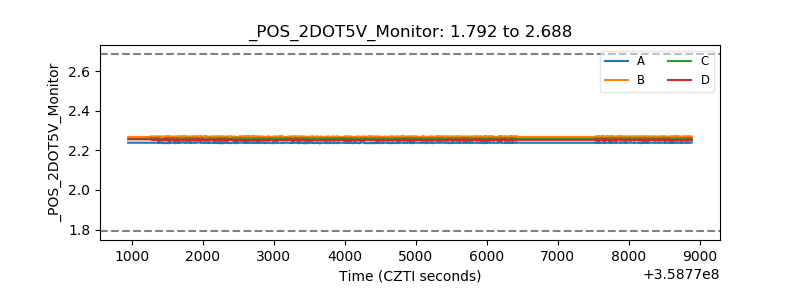 |
| +5 Volts monitor |  |
| _ROLL_ROT | 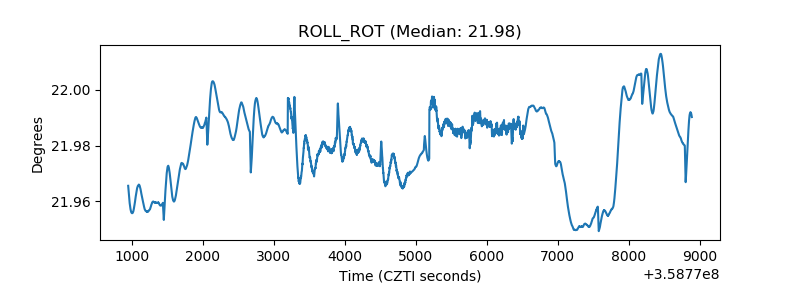 |
| _Roll_DEC | 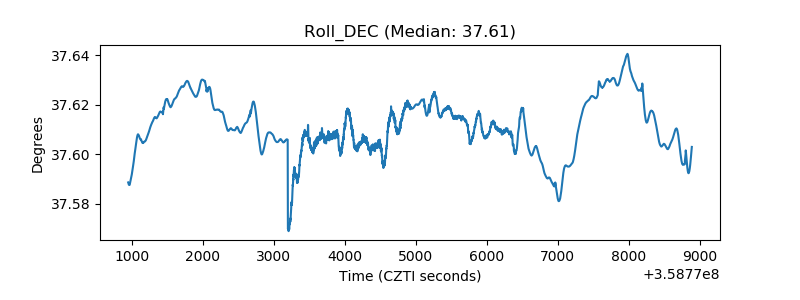 |
| _Roll_RA | 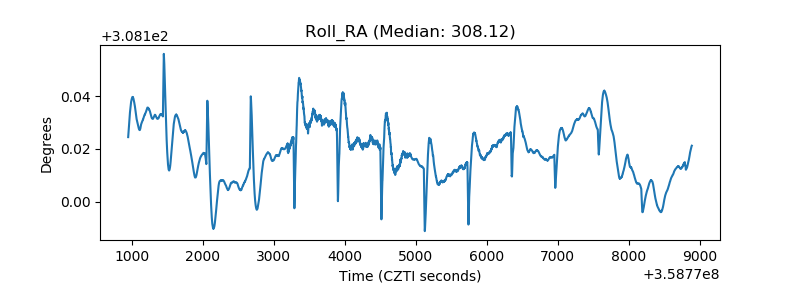 |
| Veto Counter | 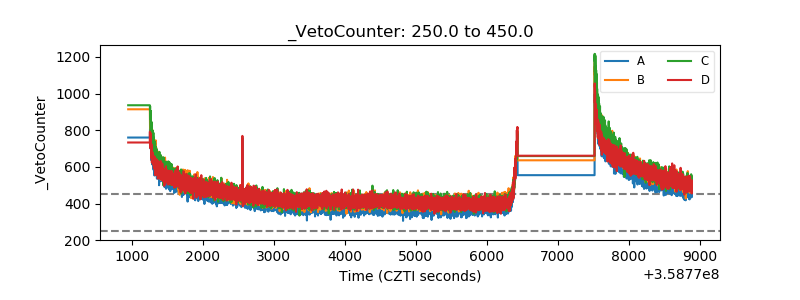 |