| Param | Original file | Final file |
|---|---|---|
| Filename | modeM0/AS1A10_121T02_9000004378_30440cztM0_level2.evt | modeM0/AS1A10_121T02_9000004378_30440cztM0_level2_quad_clean.evt |
| Size (bytes) | 1,435,697,280 | 195,122,880 |
| Size | 1.3 GB | 186.1 MB |
| Events in quadrant A | 8,652,920 | 1,227,907 |
| Events in quadrant B | 13,135,606 | 1,216,589 |
| Events in quadrant C | 9,518,598 | 1,185,278 |
| Events in quadrant D | 11,087,544 | 1,167,286 |
| Mode M0 | |||
|---|---|---|---|
| Quadrant | BADHDUFLAG | Total packets | Discarded packets |
| A | 0 | 35858 | 3 |
| B | 0 | 49663 | 3 |
| C | 0 | 38521 | 3 |
| D | 0 | 43709 | 4 |
| Mode SS | |||
|---|---|---|---|
| Quadrant | BADHDUFLAG | Total packets | Discarded packets |
| A | 0 | 330 | 0 |
| B | 0 | 330 | 0 |
| C | 0 | 330 | 0 |
| D | 0 | 330 | 0 |
| Mode M9 | |||
|---|---|---|---|
| Quadrant | BADHDUFLAG | Total packets | Discarded packets |
| A | 0 | 36 | 0 |
| B | 0 | 36 | 0 |
| C | 0 | 36 | 0 |
| D | 0 | 36 | 0 |
| Quadrant | Total seconds | Saturated seconds | Saturation percentage |
|---|---|---|---|
| A | 16121 | 198 | 1.228212% |
| B | 16122 | 317 | 1.966257% |
| C | 16122 | 343 | 2.127528% |
| D | 16121 | 599 | 3.715650% |
Noise dominated data is calculated using 1-second bins in cleaned event files. If a bin has >2000 counts, and if more than 50% of those come from <1% of pixels, then it is considered to be noise-dominated and hence unusable.
| Quadrant | # 1 sec bins | Bins with >0 counts | Bins with >2000 counts | High rate bins dominated by noise | Noise dominated (total time) | Noise dominated (detector-on time) | Marked lightcurve |
|---|---|---|---|---|---|---|---|
| A | 19712 | 16122 | 14 | 14 | 0.07% | 0.09% | 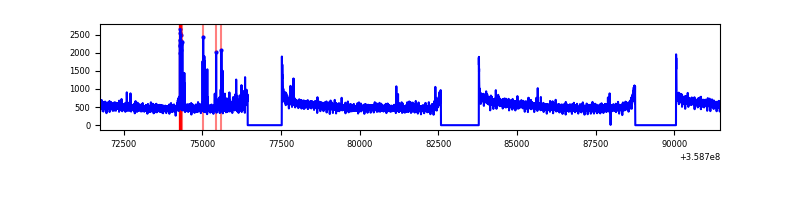 |
| B | 19713 | 16123 | 3 | 3 | 0.02% | 0.02% | 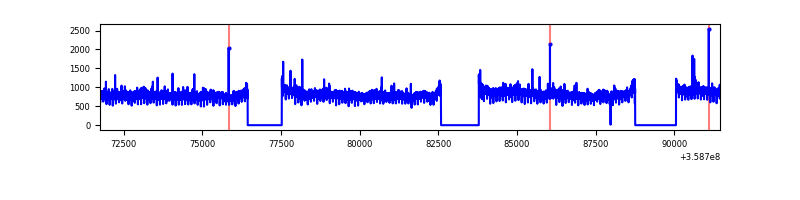 |
| C | 19713 | 16123 | 30 | 30 | 0.15% | 0.19% | 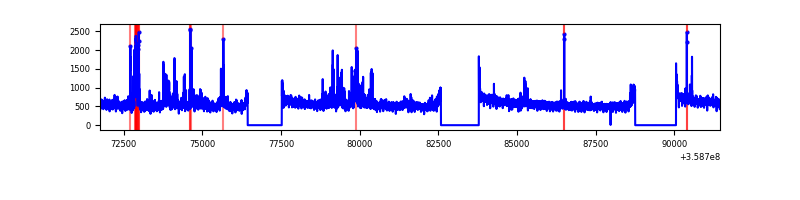 |
| D | 19712 | 16122 | 444 | 444 | 2.25% | 2.75% | 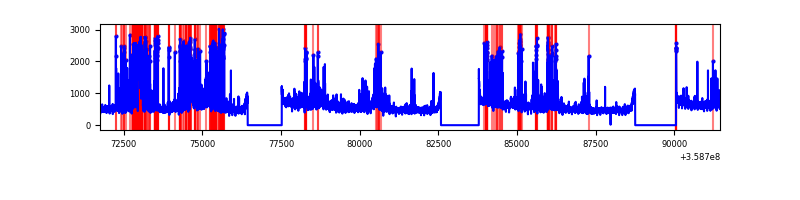 |
Top three noisy pixels from each quadrant. If the there are fewer than three noisy pixels in the level2.evt file, extra rows are filled as -1
| Pixel properties | Quadrant properties | ||||||
|---|---|---|---|---|---|---|---|
| Quadrant | DetID | PixID | Counts | Sigma | Mean | Median | Sigma |
| A | 0 | 13 | 181433 | 418.33 | 2186 | 2150 | 428.6 |
| A | 8 | 192 | 30768 | 66.78 | 2186 | 2150 | 428.6 |
| A | 13 | 254 | 27611 | 59.41 | 2186 | 2150 | 428.6 |
| B | 6 | 159 | 4536849 | 11357.7 | 2146 | 2097 | 399.3 |
| B | 0 | 229 | 117109 | 288.06 | 2146 | 2097 | 399.3 |
| B | 12 | 111 | 48132 | 115.3 | 2146 | 2097 | 399.3 |
| C | 3 | 233 | 890524 | 1846.23 | 2095 | 2115 | 481.2 |
| C | 14 | 238 | 341240 | 704.74 | 2095 | 2115 | 481.2 |
| C | 10 | 22 | 45910 | 91.01 | 2095 | 2115 | 481.2 |
| D | 13 | 104 | 1466543 | 2775.41 | 2092 | 2052 | 527.7 |
| D | 8 | 195 | 643135 | 1214.94 | 2092 | 2052 | 527.7 |
| D | 13 | 249 | 357336 | 673.31 | 2092 | 2052 | 527.7 |
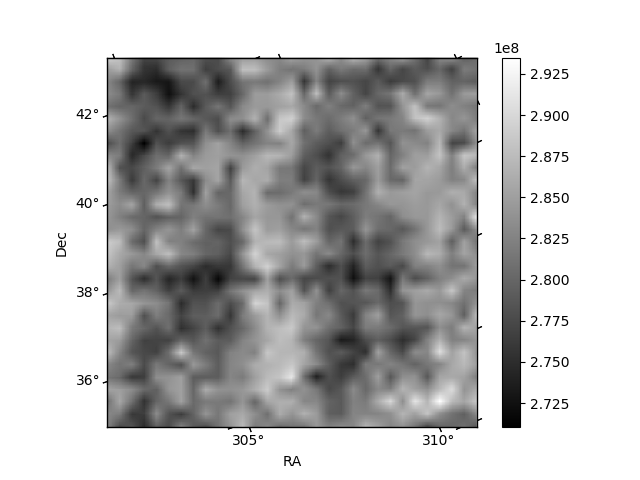
Histogram calculated using DETX and DETY for each event in the final _common_clean file
| Quadrant A | 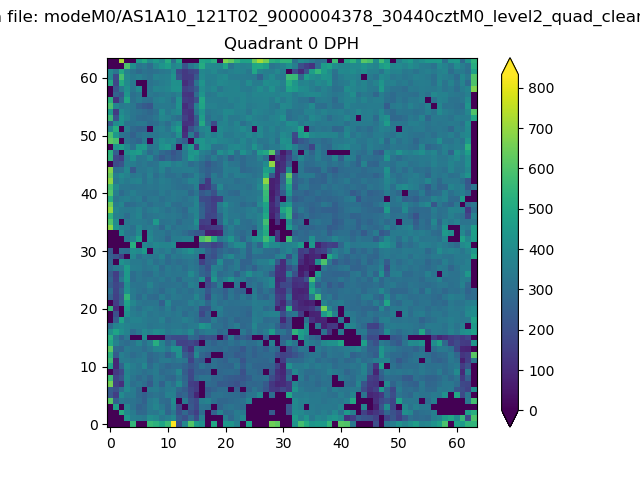 |
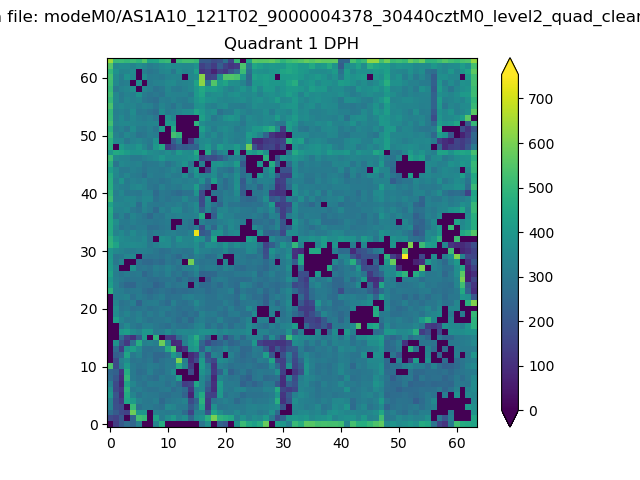 |
Quadrant B |
|---|---|---|---|
| Quadrant D | 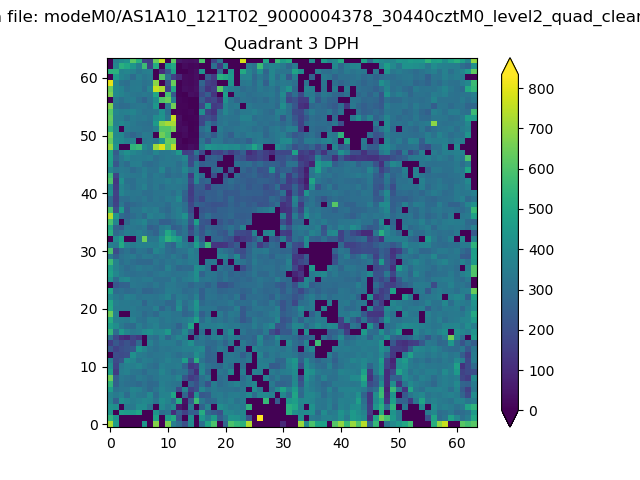 |
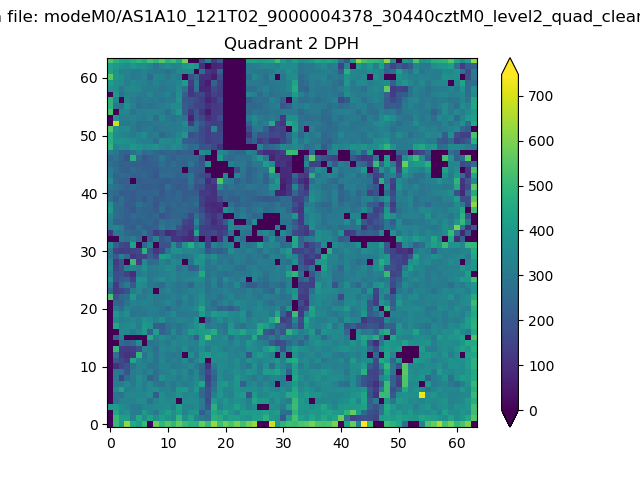 |
Quadrant C |
| Plot type | Count rate plots | Images |
|---|---|---|
| Comparison with Poisson distribution Blue bars denote a histogram of data divided into 1 sec bins. Red curve is a Poisson curve with rate = median count rate of data. |
 |
 |
| Quadrant-wise count rates Data is divided into 100 sec bins |
 |
|
| Module-wise count rates for Quadrant A Data is divided into 100 sec bins |
 |
 |
| Module-wise count rates for Quadrant B Data is divided into 100 sec bins |
 |
 |
| Module-wise count rates for Quadrant C Data is divided into 100 sec bins |
 |
 |
| Module-wise count rates for Quadrant D Data is divided into 100 sec bins |
 |
 |
| Parameter | Plot |
|---|---|
| CZT HV Monitor |  |
| D_VDD | 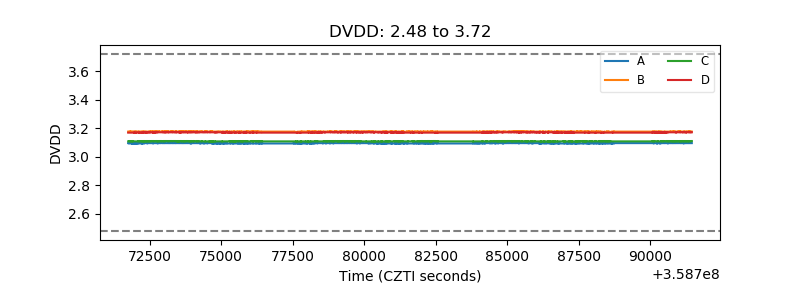 |
| Temperature 1 | 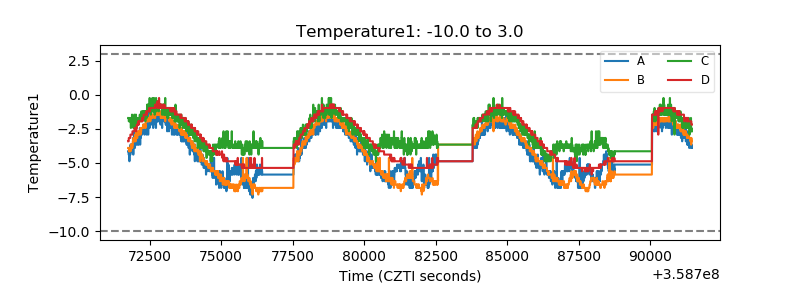 |
| Veto HV Monitor | 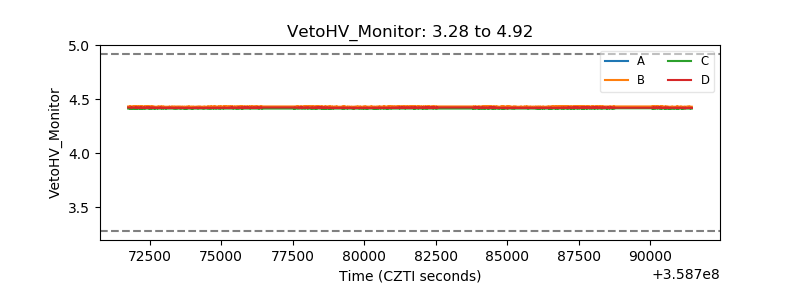 |
| Veto LLD | 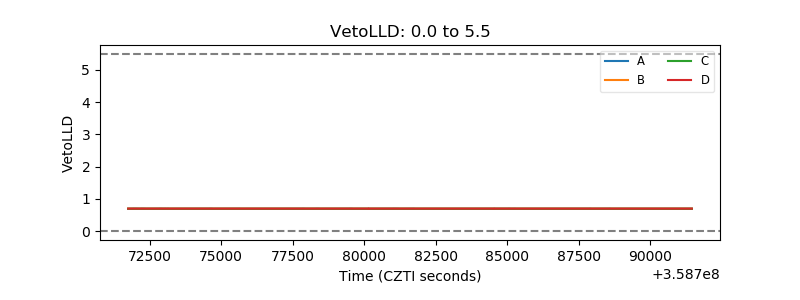 |
| Alpha Counter | 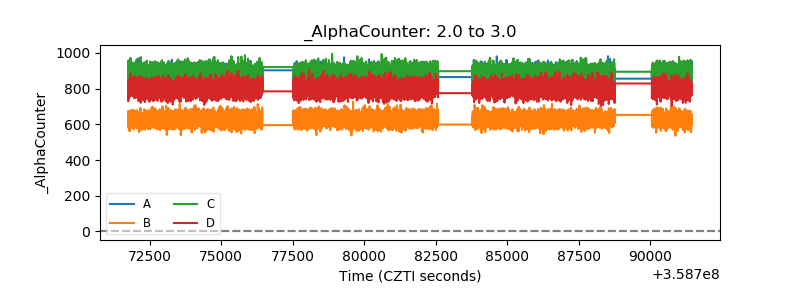 |
| _CPM_Rate | 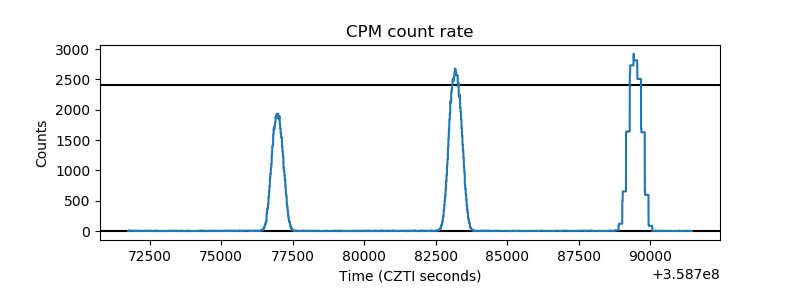 |
| CZT Counter | 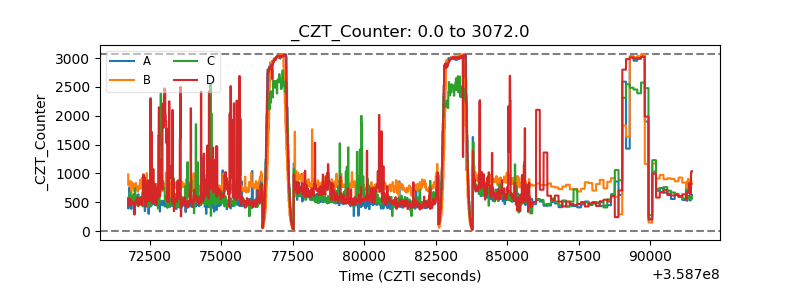 |
| +2.5 Volts monitor |  |
| +5 Volts monitor |  |
| _ROLL_ROT |  |
| _Roll_DEC |  |
| _Roll_RA | 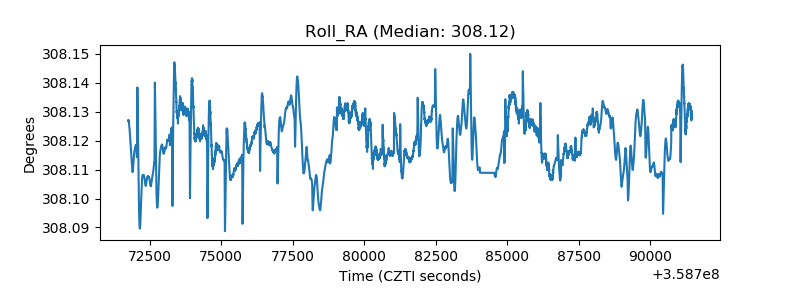 |
| Veto Counter |  |